Abstract
Quantifying pulsatile secretion from serial hormone concentration measurements (deconvolution analysis) requires automated, objective, and accurate detection of pulse times to ensure valid estimation of secretion and elimination parameters. Lack of validated pulse identification constitutes a major deficiency in the deconvolution field, because individual pulse size and number reflect regulated processes that are critical for the function and response of secretory glands. To evaluate deconvolution pulse detection accuracy, four empirical models of true-positive markers of pituitary (LH) pulses were used. 1) Sprague-Dawley rats had recordings of hypothalamic arcuate nucleus multiunit electrical activity, 2) ovariectomized ewes underwent sampling of hypothalamo-pituitary gonadotropin-releasing hormone (GnRH pulses), 3) healthy young men were infused with trains of biosynthetic LH pulses after GnRH receptor blockade, and 4) computer simulations of pulsatile LH profiles were constructed. Outcomes comprised sensitivity, specificity, and receiver-operating characteristic curves. Sensitivity and specificity were 0.93 and 0.97, respectively, for combined empirical data in the rat, sheep, and human (n = 156 pulses) and 0.94 and 0.92, respectively, for computer simulations (n = 1,632 pulses). For simulated data, pulse-set selection by the Akaike information criterion yielded slightly higher sensitivity than by the Bayesian information criterion, and the reverse was true for specificity. False-positive errors occurred primarily at low-pulse amplitude, and false-negative errors occurred principally with close pulse proximity. Random variability (noise), sparse sampling, and rapid pulse frequency reduced pulse detection sensitivity more than specificity. We conclude that an objective automated pulse detection deconvolution procedure has high sensitivity and specificity, thus offering a platform for quantitative neuroendocrine analyses.
Keywords: luteinizing hormone, male, analytical model, biostatistics, secretion, elimination, human, rat, sheep
hormones are secreted in bursts by the hypothalamus, pituitary gland, gonads, adrenal cortex and medulla, pancreatic islets, and parathyroid glands (25). Burst-like secretion conveys significant physiological information to target tissues and confers insights into underlying regulatory processes. Quantifying the number and size of secretory bursts through deconvolution analysis is a prerequisite to understanding how glands respond to physiological signals. The goal is to provide a window into physiological mechanisms that control and pathological factors that disrupt regulation of pulsatile hormone signaling (24). For example, pulses of growth hormone (GH) and luteinizing hormone (LH) reflect hypothalamic signaling and orchestrate pubertal growth, development, and reproduction (20, 26). Conversely, abrogation of GH or LH pulsatility causes pathophysiology in animals and humans. Quantifying the magnitude, frequency, and regularity of pulsatile hormonal secretion is a platform from which normal and abnormal functioning of neuroendocrine networks can be dissected.
Many in vivo endocrine studies require measuring serial hormone concentrations. Estimating secretion and elimination from such time series data involves mathematically partitioning (decomposing) the concentration profile into the unknown simultaneous contributions of secretion and elimination to the pulsatile concentration profile (5, 6, 13–15, 17, 19, 21, 22). The estimation process is termed deconvolution analysis. A recent deconvolution method permits automated assessment of pulse times and simultaneous estimation of secretion and elimination parameters (2, 8, 9). Whenever pulses are part of the analysis, simultaneous calculation of secretion and elimination rates depends critically upon the number and location of pulses assigned in the analysis (25). However, very few deconvolution methods have been subjected to combined empirical and simulation-based validation of the pulse detection component, thereby leaving their accuracy uncertain (25). A rigorously validated and automated deconvolution procedure is necessary to understand how glands signal each other.
The goal of this work was to rigorously assess for the first time the sensitivity and specificity of a recently developed deconvolution method (2, 8, 9) using three separate true-positive (TP) experimental paradigms along with computer simulations of pulsatile time series.
METHODS
Pulse Detection and Deconvolution Method
Details of the method are presented in the appendix. In brief, two optimal sets of pulse times were selected on the basis of the Akaike (AIC) and Bayesian information criteria (BIC), although often the same set was selected by either criterion (1, 16). Additionally, three pairs of minimal pulse detection criteria were evaluated: 1) minimal absolute LH concentration increment of 0.1 IU/l or ng/ml and percentage change of 4.0% defined by the nadir-to-peak rise, 2) minimal absolute increment of 0.2 IU/l or ng/ml and percentage change of 6.5%, and 3) minimal absolute increment of 0.3 IU/l or ng/ml and percentage change of 9.0%. The goal was to determine deconvolution sensitivity and specificity in correctly identifying pulse times via both AIC and BIC and under three pairs of minimal pulse detection criteria using standardized data sets with TP LH pulses.
Materials
Three empirical TP paradigms for independently marked LH pulses and 102 computer simulations were assessed by deconvolution. Known LH pulses were inferred through 1) electrophysiological episodes in the arcuate nucleus in rats, 2) bursts of hypothalamo-pituitary portal-venous gonadotropin-releasing hormone (GnRH) in sheep measured by immunoassay, and 3) timed pulses of biosynthetic LH injected into hypogonadotropic men. Each can be viewed as predictive of peripheral LH pulses (3, 20, 25). The 102 computer simulations were generated from known LH pulse dynamics.
Empirical Data
Rat model.
Adult Sprague-Dawley rats (n = 3) were ovariectomized and chronically implanted with electrodes in the arcuate nucleus of the hypothalamus, as described previously (10). Volleys of multiunit electrical activity (MUA) were construed to mark the initiation of LH pulses. Blood was collected through indwelling cardiac catheters every 5 min for ≤8 h and LH measured by double-antibody radioimmunoassay (10). The sensitivity of the assay was 0.093 ng/ml, and the inter- and intra-assay variations were 6.8 and 5.0%, respectively. Kisspeptin-10 (100 nmol) was injected intravenously as a bolus after ∼100 min of recording. Blood sampling ceased, for the purposes of this analysis, with a terminal naloxone injection (5 μmol/kg) ∼6 h later. All procedures were endorsed by the local animal care committee.
Sheep model.
Five unrestrained ovariectomized Suffolk ewes underwent simultaneous monitoring of hypothalamo-pituitary portal GnRH and peripheral LH every 5 min for 6 h during the breeding season, as described previously (12). Ovine LH and GnRH were measured by immunoassay, and all procedures were approved by the Committee on the Use and Care of Animals of the University of Michigan, in accordance with National Institutes of Health guidelines. The detection limits were 0.12 pg/tube and 0.13 ng/tube, and coefficients of variation were 3.6 and 10.6%, respectively.
Human model.
Nine young men age 18–30 yr participated after providing written, voluntary, informed consent approved by the Mayo Institutional Review Board, as described previously (18). Participants were healthy community-dwelling men within 30% of ideal body weight. Detailed medical inventory excluded a history of infertility, sexual dysfunction, systemic disease, recent weight change (exceeding 2 kg in the preceding 6 wk), androgen therapy, or psychoactive drug use. Outpatient screening was unremarkable in relation to medical history (particularly libido and erectile function), physical examination (including testis size), and fasting morning (0730) biochemical tests of renal, hepatic, hematological, endocrine, and metabolic function.
Volunteers were admitted to the General Clinical Research Center in the morning, and a 2-mg sc loading dose of ganirelix, a GnRH receptor antagonist, was administered at 0800. A second 1-mg dose of ganirelix was administered 12 h later to further suppress pulsatile LH secretion, when peripheral blood sampling was begun every 5 min, and continued for 20 h. Saline and 12.5, 25, 50, or 100 IU recombinant human LH (rhLH; Serono, Geneva, Switzerland) were administered intravenously as a 6-min square-wave infusion every 2 h in randomized order over a 20-h period. Each dose of rhLH or saline was infused twice at known times. Blood was allowed to clot at room temperature, and sera were frozen at −20°C for later assay of LH concentrations. Volunteers were provided three meals each day during the sampling session, and room lights were extinguished at 2300. Participants were allowed to ambulate in the room but not smoke, nap, drink caffeinated beverages, or undertake vigorous exercise.
LH concentrations were measured in duplicate by automated immunochemiluminometry (Beckman Dxi 800 immunoassay; Beckman Coulter, Fullerton, CA), using the World Health Organization Second International Reference Preparation 80/552 as standard. Intra-assay coefficients of variation averaged 6.1% and interassay coefficients of variation 6.5%. Procedural sensitivity was 0.2 IU/l (18).
Computer-Simulated Data
Continuous 24-h LH concentration profiles were simulated mathematically, and discrete 10-min time series derived from there (7–9). The shape of discrete bursts was modeled as a three-parameter γ-probability distribution (waveform; Table 1). The pulse-timing mechanism was assumed to be a Weibull renewal process with the parameters λ and γ. Trains of amplitude-varying LH pulses were created using six pulse frequencies (λ = 6, 10, 16, 20, 25, and 30 pulses/24 h) and five different pulse-time regularity values [γ = 1.0, 1.7, 2.5, 3.1, and 4.0 (unitless)]. Elimination was modeled as biexponential decay with a fixed rapid-phase half-life of 18 min, slow phase of 90 min, and rapid/total decay fraction of 0.37 (23). Superimposed sample noise (random Gaussia variability) was ±5% in the default runs. Basal secretion, the slow half-life, variability in burst mass, pulsing regularity, pulse number, and random experimental error (Table 1) were allowed to vary among realizations by −20, −10, −5, +5, +10, and +20%. Three sets of computer-simulated data were generated for each of the 34 parameter combinations, resulting in 102 time series. This permitted evaluation of performance trends as a function of key simulation parameters.
Table 1.
Primary parameters of LH pulse simulation model
| Parameter | Value |
|---|---|
| Basal secretion, IU/l/min | 0.02 |
| Burst mass, IU/l | 4.0 |
| Pulse frequency, no./24 h* | 16 |
| Interpulse regularity** | 2.5 |
| Waveform of secretory burst† | |
| β1 | 2 |
| β2 | 1 |
| β3 | 1 |
| Half-life rapid, min | 18 |
| Half-life slow, min | 90 |
| Half-life rapid/slow | 0.37 |
| SD of burst mass, IU/l | 2.0 |
| %Experimental error | 5 |
λ and
γ of Weibull renewal process;
generalized γ-probability distribution.
To examine the effect of sampling intensity, we simulated twenty 24-h LH concentration profiles minutely and then censored the data progressively to obtain profiles every 5, 10, 15, 20, and 30 min.
Statistics
Analyses were performed using Matlab Version R2007b (The Mathworks, Natick, MA) and SAS version 9.1 (SAS Institute, Cary, NC). Individual and summary (means ± SD) data are presented. Relative performance of AIC and BIC was compared by a paired t-test. Spearman rank correlation was used to examine trends in sensitivity or specificity resulting from progressive changes in key simulation parameters. Significance was construed at P < 0.05.
True LH pulse times were defined by the timing of arcuate MUA volleys (rat), hypothalamo-pituitary portal GnRH pulses (sheep), experimentally infused pulses of rhLH (human), or a simulated pulse (mathematical simulations). A program-defined pulse-onset time was designated TP if it occurred within 5 min before or 10 min after the known pulse secretion onset. Any other detected pulse was designated falsely positive (FP). A false-negative (FN) error was a pulse missed within the TP window. A true-negative (TN) event was the absence of any program-predicted pulse before the first TP, between any two adjacent TPs, and after the last TP.
Sensitivity and specificity were calculated for each time series as follows: sensitivity = TP/(TP + FN) and specificity = TN/(TN + FP). Overall sensitivity and specificity were defined in the same way, but after all TP, TN, FP, and FN events were pooled.
Receiver-operating characteristic (ROC) curves were determined by plotting paired sensitivity (dependent variable) and one-specificity (independent variable) for each of the nine men and each of the 102 simulated data sets (11). Since plots for the 102 simulated data sets contained overlying points, ROC graphs were also constructed by median smoothing of sensitivity in 0.05-increments of one-specificity.
RESULTS
Rat Model
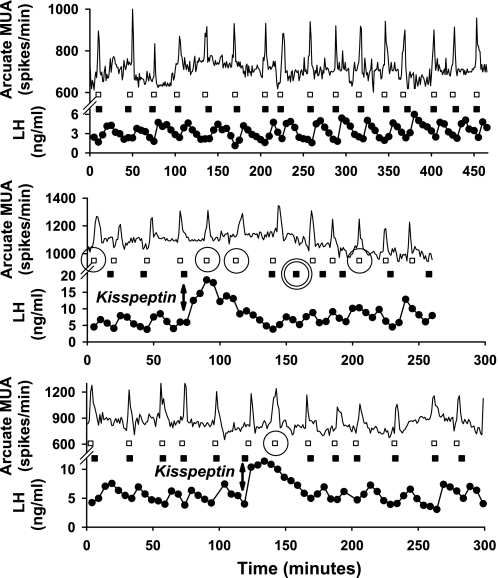
Analyses of LH profiles in the rat yielded identical optimal pulse-time sets for AIC and BIC as well as for the three minimum-detection criteria (minimal absolute LH increments of 0.1, 0.2, and 0.3 ng/ml and minimal %increments of 4.0, 6.5, and 9.0%). Figure 1 illustrates peripheral blood LH pulses and arcuate MUA activity in three rats. Forty-one distinct MUA volleys (Fig. 1, □) were present, for which 35 matching program-estimated LH pulses (Fig. 1, ▪) were correctly detected (TPs). Of the six MUA-defined pulses not detected (FN; Fig. 1, single circles), three occurred immediately after exogenous kisspeptin-induced LH release (Fig. 1, vertical double arrow). There was one FP (Fig. 1, double circle). Overall sensitivity was 0.88 and overall specificity 0.98. If kisspeptin was assumed to alter the expected 1:1 relationship between hypothalamic MUA and LH pulses, then overall sensitivity would be 0.91 (38 TPs out of 41 MUA volleys).
Fig. 1.
Peripheral LH concentration profiles (ng/ml) and hypothalamic arcuate nucleus multiunit electrical activity (MUA; spikes/min) recorded from 3 ovariectomized Sprague-Dawley rats. Bursts of MUA (□) are closely associated with program-predicted LH peaks (▪). Five false negatives (single circle) and 1 false positive (double circle) are shown. Kisspeptin-10 (100 nmol) was injected iv as a bolus after ∼100 min in 2 rats (middle and bottom, vertical double arrows).
Sheep Model
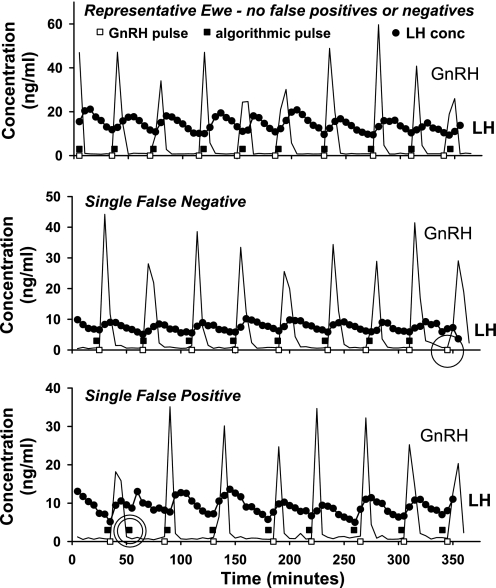
Portal blood GnRH secretory bursts were used as TP identifiers of LH pulses in sheep (Fig. 2). Fig. 2, top, shows data from a representative ewe (1 of 3) with exact concordance between GnRH (□) and algorithmically detected LH (▪) pulses (no FP and no FN). Altogether, there were 44 paired GnRH-LH pulses, of which 43 were identified correctly. Fig. 1, middle, depicts the one FN (circle), and Fig. 1, bottom, depicts the one FP (double circle) identified among all animals. Thus, overall sensitivity and specificity were both 0.98. AIC and BIC results did not differ, and the use of minimum thresholds had no effect on either sensitivity or specificity.
Fig. 2.
Peripheral LH (ng/ml) and hypothalamic portal gonadotropin-releasing hormone (GnRH; ng/ml) concentration profiles from 3 of 5 ewes. GnRH (□) and LH (▪) secretion correlate closely. One false-negative (single circle; middle) and 1 false-positive (double circle; bottom) pulse are shown.
Human Model
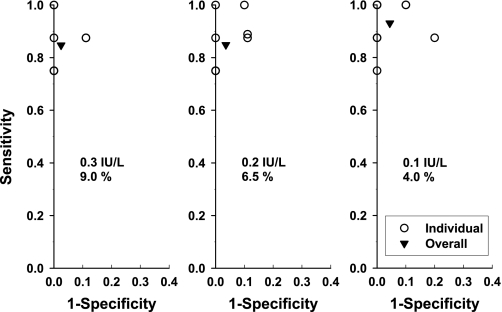
The third in vivo model comprised intravenous injections of pulses of rhLH in nine gonadotropin-suppressed men. ROC curves were obtained by calculating sensitivity and one-specificity for each man's data series (Fig. 3). The AIC and BIC methods produced identical pulse-time sets. However, different pulse-time sets were obtained according to the minimum pulse detection thresholds utilized, and hence, these are illustrated separately (Fig. 3, left, middle, and right). Note overlapping individual points, so only four to six from a maximum of nine points appear in each part of Fig. 3. Lowering the pulse detection minimum threshold (Fig. 3, left, middle, and right) increased sensitivity (0.85, 0.85, and 0.93) and slightly decreased specificity (0.97, 0.96, and 0.95). The least stringent pulse detection criterion pair (Fig. 3, right) achieved the highest combined sensitivity (0.93) and specificity (0.95), wherein 67 of 71 injected LH pulses were detected. The four FNs were associated with infusion of the lowest dose of rhLH (not shown). The four FPs occurred during the second half of the sampling period (not shown), when waning of ganirelix-induced inhibition of GnRH stimulation may have permitted occasional escape of endogenous LH pulses. This illustrates the complementarity of using different paradigms to estimate TP and TN events.
Fig. 3.
Receiver-operating characteristic (ROC) curves of pulse detection accuracy obtained by deconvolution analysis in 9 young men given a GnRH receptor antagonist and then infused with 8 randomly varying pulses of recombinant human LH and 2 of saline (see Fig. 1). Three paired-threshold criteria were used as defined by minimal incremental and %changes of 0.3 IU/l and 9.0% (left), 0.2 IU/l and 6.5% (middle), and 0.1 IU/l and 4.0% (right). Different thresholds yielded slightly different specificities and sensitivities, whereas Akaike (AIC) and Bayesian information criteria (BIC) yielded identical sensitivity and specificity in each subject. Hence, each part shows 9 points (○), although some points are coincident. Overall, sensitivity and specificity (▾) were calculated for each panel by pooling all data (methods).
Computer Simulations
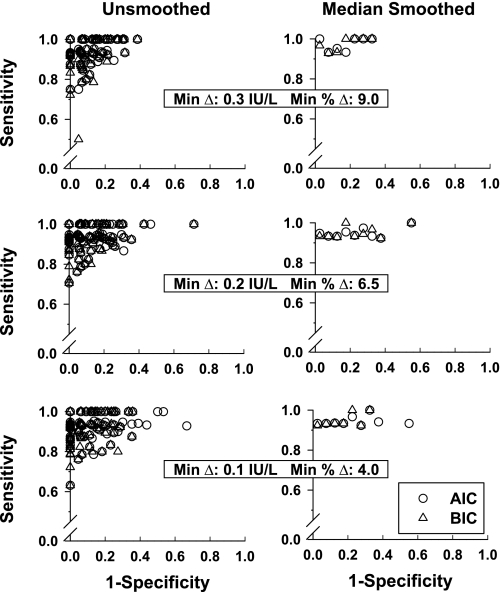
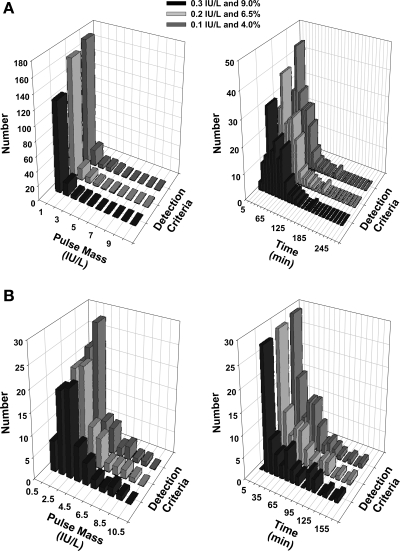
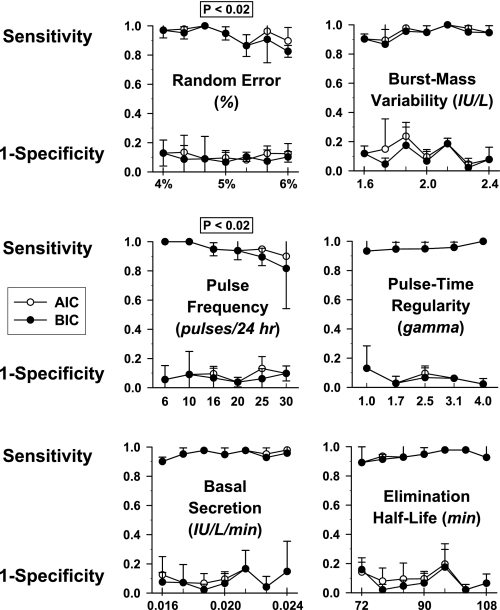
Mathematically simulated data sets were analyzed analogously to in vivo data (Fig. 4). Calculated specificity and sensitivity are shown in Table 2. The AIC method attained significantly but minimally (1–3%) higher sensitivity than the BIC method, whereas the reverse was true for specificity (P < 0.004 for each). In overall performance, BIC was slightly superior to AIC. For all three minimal thresholds explored, BIC achieved overall sensitivity and overall specificity (both >0.90). The nature of FP and FN errors was examined in relation to the mass of simulated secretory bursts (integral of the secretion rate for a burst) and in relation to relative pulse timing. The majority of FPs had a secretory mass of <2.0 IU/l and occurred within 60 min of another pulse (Fig. 5A). The majority of FNs had a mass of <2.5 IU/l and occurred within 45 min of another pulse (Fig. 5B). Thus, FP and FN errors reflect both the size and proximity of simulated pulses, highlighting the need to optimize pulse detection in relation to data characteristics. Optimal sensitivity and specificity on simulated series favored the most stringent criterion pair (LH increment ≥0.3 IU and %rise ≥9%). For illustrative reasons, performance of the least optimal (least stringent) threshold criterion is presented in Fig. 6. Simulations demonstrated that both greater superimposed random variability (noise) and higher average pulse frequency decrease sensitivity (P < 0.02 for each, Spearman rank correlation) but not specificity. Varying secretory burst duration, slow-phase half-life, basal secretion, and random variability of pulse size or pulse timing did not alter pulse detection sensitivity or specificity over the parameter range (± 20%) explored.
Fig. 4.
ROC curves derived from 102 pulse train simulations (1,632 pulses). Mathematical simulations were based on a broad range of starting parameters (Table 1). The 3 paired-threshold criteria (Fig. 3) and AIC (○) and BIC (▵) model selection criteria yielded slightly different specificities and sensitivities. Some points are coincident (left). Median smoothing of sensitivity was applied to each 0.05 increment in 1-specificity (right).
Table 2.
Mean sensitivity and specificity of LH pulse detection by the deconvolution algorithm
|
Stringency |
AIC*
|
BIC*
|
|||
|---|---|---|---|---|---|
| Absolute Change, IU/l | %Change | Sensitivity | Specificity | Sensitivity | Specificity |
| 0.3 | 9.0 | 0.95 | 0.90 | 0.94 | 0.92 |
| 0.2 | 6.5 | 0.94 | 0.87 | 0.93 | 0.90 |
| 0.1 | 4.0 | 0.93 | 0.86 | 0.92 | 0.90 |
AIC, Akaike information criteria; BIC, Bayesian information criteria. In vivo experiments. Total no. of pulses = 156. Sensitivity = 0.93; specificity = 0.97. Mathematical simulations (1,632 pulses).
P < 0.005 for line-by-line AIC vs. BIC comparison.
Fig. 5.
A: 3-dimensional histograms of secretory burst mass (left) and time to nearest pulse (right) for false-positive pulses identified in 102 simulations using 3 detection criteria. The mathematical mass of the secretory burst was computed as the time integral of the secretion rate. B: distribution of false-negative pulses. Data are presently analogous to those in A.
Fig. 6.
Parameter sensitivity analysis using mathematical simulations of LH pulse trains. Simulation parameters were progressively varied in 7 steps across a range of ±20%, viz., random error (top left), variability of secretory burst mass (top right), pulse frequency (middle left), regularity of pulse times (middle right), basal secretion (bottom left), and slow half-life (bottom right). Two significant outcomes were that increasing random error (top left) and pulse frequency (middle left) reduced pulse detection sensitivity (P < 0.02, Spearman rank correlation for each) but not specificity over the ranges explored. Each datum is the mean (± SD) sensitivity and 1-specificity calculated from a single set of simulation parameters realized in triplicate time series. Sensitivity and specificity were ascertained by AIC (○) and BIC (•).
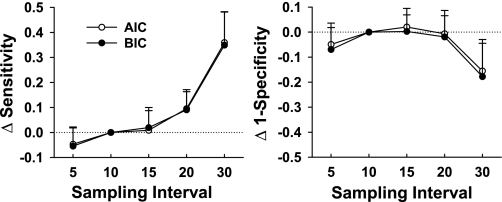
Figure 7 shows the change in sensitivity and one-specificity with increased or decreased sampling intensity, using 10-min sampling as the reference. Sensitivity declines significantly at 30-min sampling, but one-specificity is stable between 5- and 20-min sampling, with a nonsignificant trend to decrease with 30-min data.
Fig. 7.
Incremental effects of altered sampling intensity on sensitivity (left) and 1-specificity (right) using discriminative indexes from 10-min sampling as the standard. No difference from 10-min results is indicated by the dotted line. Positive values for sensitivity increments denote a decline in sensitivity and vice versa for 1-specificity. Each point is the mean (± SD) change from 10-min data calculated from 20 time series. Pulse selection was done using AIC (○) and BIC (•).
DISCUSSION
The present investigation utilized three empirical in vivo paradigms (hypothalamic electrophysiology, hypothalamo-pituitary portal sampling, and pulsatile infusion of recombinant LH) and mathematical computer simulations of LH pulse trains to assess the sensitivity and specificity of pulse detection by a recent deconvolution procedure (2, 8, 9). Rigorous validation, comprising assessment and comparison of key performance parameters, as we have shown here, is essential for objective and reliable quantification of pulsatile secretion in the prototypical GnRH-LH axis and by extension in other pulsatile neuroendocrine systems. Accurate estimation of secretory dynamics is necessary to fully understand how glands signal each other in health and how pathophysiological processes disrupt glandular secretion (3, 4, 20, 25, 26). Analyses of experimental data yielded, respectively, sensitivities and specificities of 0.88 and 0.98 in the rat, 0.98 and 0.98 in the sheep, and 0.93 and 0.95 in the human paradigms. Weighted-mean sensitivity and specificity estimates for all three empirical in vivo models combined (156 pulses) were 0.93 and 0.97, respectively. These values are similar to those inferred using 102 simulated LH profiles (1,632 pulses), viz., sensitivity 0.94 and specificity 0.92. Thus, empirical and simulation-based assessments demonstrate >90% sensitivity and specificity of the pulse detection component of this deconvolution algorithm.
Two commonly employed statistical information criteria (AIC and BIC) were compared with respect to accuracy of selecting the optimal pulse set (1, 16). Information criteria are used statistically to penalize the addition of superfluous parameters (in this study, excessive pulses). In mathematical simulations (Table 1), AIC was slightly (1–3%) but consistently superior to BIC with respect to pulse detection sensitivity, and the reverse was true for specificity. Since these differences were not evident in the analyses of the three animal models, they represent relatively subtle distinctions, indicating that both AIC and BIC provide reasonable independent selection criteria.
The validity of superimposing threshold pulse detection criteria post hoc was also explored. This was done by repeating the parameter estimates after subthreshold pulses were removed. Thresholds were defined as minimally discriminable LH concentration increments (0.1, 0.2, and 0.3 IU/l or ng/ml) and as nominal coefficients of variation of the assay (4, 6.5, and 9%). Plausible threshold criteria primarily reduced false-positive errors in pulse detection. To obviate arbitrary threshold criteria, thresholds should reflect accurately estimated measurement variability in the individual laboratory.
In the case of simulated hormone profiles, one may evaluate pulse detection performance by systematically varying each of the key secretion or elimination parameters (Fig. 6). Pulse detection sensitivity and specificity were stable (both >0.90) to successive stepwise changes in basal secretion, slow half-life, pulse-time variability, and pulse-mass variability. Imposition of greater random error and higher pulse frequencies decreased sensitivity without restricting specificity within the parameter ranges assessed. Thus, as observed for nondeconvolution methods (20, 27), minimizing measurement error and maximizing sampling intensity should enhance pulse detection sensitivity and specificity (Fig. 7). This is because the majority of false-positive pulses were small, and the majority of false-negative errors occurred when pulses were close together (Fig. 5).
In summary, a recent deconvolution method with mathematically verifiable maximum-likelihood parameter estimation achieves >90% sensitivity and specificity of pulse detection in animal models (overall mean 0.95 ± 0.02) and simulated profiles (0.93 ± 0.01). The validation strategies employed may be relevant to assessing other deconvolution procedures as well.
GRANTS
P. Y. Liu was supported by Career Development Award 511929 from the National Health and Medical Research Council of Australia. Studies were supported in part by National Center for Research Resources (Rockville, MD) Grant M01-RR-00585 to the General Clinical Research Center of the Mayo Clinic and Foundation and National Institutes of Health (Bethesda, MD) Grants RO1-AG-23133, AG-19695, DK-73148, AG-29362, AG-29215, R21-AG-23777, and AG-31763.
Supplementary Material
APPENDIX
Pulse Detection and Deconvolution Method
Data were analyzed using a newly introduced combined pulse detection and deconvolution method, as reported (2, 8, 9). Concentrations are first normalized to the unit interval (0, 1) and then selectively smoothed by a nonlinear diffusion algorithm to detect local minima preceding abrupt increases in the data. After all local minima are defined, the program gradually removes (incrementally smoothes) statistically least significant minima one at a time. The result is an array of decremental candidate pulse-time sets (Supplemental Fig. 1A; Supplemental Material for this article are available at the AJP-Endocrinology and Metabolism web site). Multiple possible pulse-time sets are thereby generated [e.g., sets containing N, N-1, N-2 … 1 pulse time(s); Supplemental Fig. 1B]. Deconvolution is applied to each pulse set using maximum-likelihood parameter estimation via the Matlab (The Mathworks) genetic search algorithm. The parameter set includes two terms for a Weibull pulse-renewal process, one for nondrifting basal secretion, three parameters to define a flexible waveform (γ-density), two variables for time-invariant biexponential elimination, and allowable random effects on burst mass constrained to nonnegativity. Realizability of this formalism has been verified by direct mathematical proof (2, 8).
The optimal set of pulse times was then selected on the basis of the AIC and BIC information criteria (1, 16): AIC = −(log likelihood function) + (P); and BIC = −(log likelihood function) + (ln N)(P), where N is the number of data points and P is the number of pulses.
Although it is not described in the original method, three additional pairs of minimal pulse detection criteria were evaluated: 1) minimal absolute LH concentration increment of 0.1 IU/l or ng/ml and percentage change of 4.0% defined by the nadir-to-peak rise, 2) minimal absolute increment of 0.2 IU/l or ng/ml and percentage change of 6.5%, and 3) minimal absolute increment of 0.3 IU/l or ng/ml and percentage change of 9.0%. These determinations were compared with the secretory burst mass (IU of LH secreted or infused per liter distribution volume), which is the time integral of the secretory rate over a given burst (Supplemental Fig. 1C).
The goal was to determine the deconvolution sensitivity and specificity of correctly identifying pulse times.
REFERENCES
- 1.Akaike H A new look at the statistical model identification. IEEE Trans Autom Control 19: 716–723, 1974. [Google Scholar]
- 2.Chattopadhyay S, Veldhuis JD, Keenan DM. Probabilistic recovery of pulsatile, secretory and kinetic structure: an alternating discrete and continuous schema. Quarterly Appl Math 66: 401–421, 2008. [Google Scholar]
- 3.Evans WS, Sollenberger MJ, Booth RA Jr, Rogol AD, Urban RJ, Carlsen EC, Johnson ML, Veldhuis JD. Contemporary aspects of discrete peak-detection algorithms. II. The paradigm of the luteinizing hormone pulse signal in women. Endocr Rev 13: 81–104, 1992. [DOI] [PubMed] [Google Scholar]
- 4.Giustina A, Veldhuis JD. Pathophysiology of the neuroregulation of growth hormone secretion in experimental animals and the human. Endocr Rev 19: 717–797, 1998. [DOI] [PubMed] [Google Scholar]
- 5.Groth TL Conversion of diurnal plasma hormone concentration profiles into secretion rates. Acta Paediatr Scand 372: 57–61, 1991. [DOI] [PubMed] [Google Scholar]
- 6.Jusko WJ, Slaunwhite WR Jr, Aceto T Jr. Partial pharmacodynamic model for the circadian-episodic secretion of cortisol in man. J Clin Endocrinol Metab 40: 278–289, 1975. [DOI] [PubMed] [Google Scholar]
- 7.Keenan DM, Alexander S, Irvine CH, Clarke I, Scott C, Turner A, Tilbrook AJ, Canny BJ, Veldhuis JD. Reconstruction of in vivo time-evolving neuroendocrine dose-response properties unveils admixed deterministic and stochastic elements. Proc Natl Acad Sci USA 101: 6740–6745, 2004. [DOI] [PMC free article] [PubMed] [Google Scholar]
- 8.Keenan DM, Chattopadhyay S, Veldhuis JD. Composite model of time-varying appearance and disappearance of neurohormone pulse signals in blood. J Theor Biol 236: 242–255, 2005. [DOI] [PubMed] [Google Scholar]
- 9.Keenan DM, Roelfsema F, Biermasz N, Veldhuis JD. Physiological control of pituitary hormone secretory-burst mass, frequency, and waveform: a statistical formulation and analysis. Am J Physiol Regul Integr Comp Physiol 285: R664–R673, 2003. [DOI] [PubMed] [Google Scholar]
- 10.Kinsey-Jones JS, Li XF, Luckman SM, O'Byrne KT. Effects of kisspeptin-10 on the electrophysiological manifestation of gonadotropin-releasing hormone pulse generator activity in the female rat. Endocrinology 149: 1004–1008, 2008. [DOI] [PubMed] [Google Scholar]
- 11.Metz CE Basic principles of ROC analysis. Semin Nucl Med 8: 283–298, 1978. [DOI] [PubMed] [Google Scholar]
- 12.Midgley AR, McFadden K, Ghazzi M, Karsch FJ, Brown MB, Mauger DT, Padmanabhan V. Nonclassical secretory dynamics of LH revealed by hypothalamo-hypophyseal portal sampling of sheep. Endocrine 6: 133–143, 1997. [DOI] [PubMed] [Google Scholar]
- 13.O'Sullivan F, O'Sullivan J. Deconvolution of episodic hormone data: an analysis of the role of season on the onset of puberty in cows. Biometrics 44: 339–353, 1988. [PubMed] [Google Scholar]
- 14.Oerter KE, Guardabasso V, Rodbard D. Detection and characterization of peaks and estimation of instantaneous secretory rate for episodic pulsatile hormone secretion. Comput Biomed Res 19: 170–191, 1986. [DOI] [PubMed] [Google Scholar]
- 15.Rebar R, Perlman D, Naftolin F, Yen SS. The estimation of pituitary luteinizing hormone secretion. J Clin Endocrinol Metab 37: 917–927, 1973. [DOI] [PubMed] [Google Scholar]
- 16.Schwarz G Estimating the dimension of a model. Annals of Statistics 6: 461–464, 1978. [Google Scholar]
- 17.Swartz CM, Wahby VS, Vacha R. Characterization of the pituitary response in the TRH test by kinetic modeling. Acta Endocrinol (Copenh) 112: 43–48, 1986. [DOI] [PubMed] [Google Scholar]
- 18.Takahashi PY, Votruba P, Abu-Rub M, Mielke K, Veldhuis JD. Age attenuates testosterone secretion driven by amplitude-varying pulses of recombinant human luteinizing hormone during acute gonadotrope inhibition in healthy men. J Clin Endocrinol Metab 92: 3626–3632, 2007. [DOI] [PubMed] [Google Scholar]
- 19.Toutain PL, Laurentie M, Autefage A, Alvinerie M. Hydrocortisone secretion: production rate and pulse characterization by numerical deconvolution. Am J Physiol Endocrinol Metab 255: E688–E695, 1988. [DOI] [PubMed] [Google Scholar]
- 20.Urban RJ, Evans WS, Rogol AD, Kaiser DL, Johnson ML, Veldhuis JD. Contemporary aspects of discrete peak detection algorithms. I. The paradigm of the luteinizing hormone pulse signal in men. Endocr Rev 9: 3–37, 1988. [DOI] [PubMed] [Google Scholar]
- 21.Van Cauter E Method for characterization of 24-h temporal variation of blood components. Am J Physiol Endocrinol Metab Gastrointest Physiol 237: E255–E264, 1979. [DOI] [PubMed] [Google Scholar]
- 22.Veldhuis JD, Carlson ML, Johnson ML. The pituitary gland secretes in bursts: appraising the nature of glandular secretory impulses by simultaneous multiple-parameter deconvolution of plasma hormone concentrations. Proc Natl Acad Sci USA 84: 7686–7690, 1987. [DOI] [PMC free article] [PubMed] [Google Scholar]
- 23.Veldhuis JD, Fraioli F, Rogol AD, Dufau ML. Metabolic clearance of biologically active luteinizing hormone in man. J Clin Invest 77: 1122–1128, 1986. [DOI] [PMC free article] [PubMed] [Google Scholar]
- 24.Veldhuis JD, Keenan DM, Bowers CY. Peripheral estrogen receptor-α selectively modulates the waveform of GH secretory bursts in healthy women. Am J Physiol Regul Integr Comp Physiol 293: R1514–R1521, 2007. [DOI] [PubMed] [Google Scholar]
- 25.Veldhuis JD, Keenan DM, Pincus SM. Motivations and methods for analyzing pulsatile hormone secretion. Endocr Rev 29: 823–864, 2008. [DOI] [PMC free article] [PubMed] [Google Scholar]
- 26.Veldhuis JD, Roemmich JN, Richmond EJ, Bowers CY. Somatotropic and gonadotropic axes linkages in infancy, childhood, and the puberty-adult transition. Endocr Rev 27: 101–140, 2006. [DOI] [PubMed] [Google Scholar]
- 27.Vieweg WV, Veldhuis JD, Carey RM. Temporal pattern of renin and aldosterone secretion in men: effects of sodium balance. Am J Physiol Renal Fluid Electrolyte Physiol 262: F871–F877, 1992. [DOI] [PubMed] [Google Scholar]
Associated Data
This section collects any data citations, data availability statements, or supplementary materials included in this article.


