Abstract
Regular physical activity improves glucose tolerance and decreases adiposity. Our aim was to investigate the effects of exercise training on subcutaneous (inguinal) and visceral (parametrial) adipose tissue in rats that were fed a chow diet (13% fat) or made insulin resistant by a high-fat diet (60% fat). Sprague-Dawley rats performed 4 wk of voluntary wheel running or were kept as sedentary controls. The training groups fed chow and the high-fat diet achieved similar running distances (8.8 ± 1.8 and 9.3 ± 1.9 km/day, respectively). Training improved oral glucose tolerance in chow-fed rats and prevented the glucose intolerance that occurred in sedentary rats fed the high-fat diet. In both subcutaneous and visceral adipose tissue, the high-fat diet-induced increases in fat pad weight (67% and 133%, respectively), adipocyte size (20% and 43%), and cell number (36% and 65%) were completely prevented by exercise training. Cytokine mRNA expression in visceral fat did not change with exercise training. However, in subcutaneous fat, training actually increased mRNA expression of several cytokines [IL-6: 80% (P < 0.05); TNF-α: 100% (P < 0.05); IL-1 receptor antagonist (IL-1Ra): 57% (P = 0.08)] with no detectable increases in serum cytokine concentrations. In summary, exercise training can overcome high-fat diet-induced impairments in glucose tolerance and increases in adipocyte size, cell number, and fat pad mass. Improved glucose tolerance was accompanied by an increase in cytokine gene expression in subcutaneous fat. This finding raises the possibility of a specific role of subcutaneous adipose tissue in adaptive responses to exercise training.
Keywords: cytokines, adipocytes, insulin resistance
modern lifestyles are often characterized by physical inactivity and abundant consumption of unhealthy diets. The resultant positive energy balance is a major cause for obesity and ultimately leads to insulin resistance and type 2 diabetes. In contrast, regular physical exercise can delay or prevent the onset of type 2 diabetes in high-risk individuals with impaired glucose tolerance (15). Lifestyle changes, including regular physical activity, have been reported to be more effective in preventing diabetes than drug therapy with metformin (15). It is evident that the benefits of exercise training result from a combination of effects on various organs. However, past efforts to better understand the physiological significance of exercise have mainly focused on skeletal muscle, with much less attention to adaptations in adipose tissue.
In recent years, our understanding of adipose tissue has evolved from a mere storage depot for lipids to a multifunctional organ with complex autocrine, paracrine, and endocrine implications. There is considerable evidence that different fat depots, in particular subcutaneous and visceral adipose tissue, have distinct functions. As early as 1950, the French physician Jean Vague observed that individuals with increased upper-body fat accumulation were more likely to develop diabetes than those with predominantly lower-body fat accumulations (22). Since then, a number of epidemiologic studies have established visceral obesity as an independent risk factor for insulin resistance, while subcutaneous fat accumulation has generally been described as less harmful (24). Gene array studies have shown that there is a marked difference in gene expression when visceral and subcutaneous adipose tissue are compared (1). Interestingly, many of the genes that exhibit significantly higher expression in subcutaneous fat are involved in glucose homeostasis, insulin action, and lipid metabolism (1). In line with these findings, a recent study showed improved glucose metabolism in mice when subcutaneous, but not visceral fat was transplanted into the abdominal cavity (21). Despite the compelling evidence for different physiological roles of subcutaneous versus visceral adipose tissue, most studies so far have focused on only one fat depot. Furthermore, no studies have directly compared the effects of exercise training on subcutaneous and visceral fat.
We hypothesized that exercise training can prevent the effects of high-fat feeding on adipose tissue morphology, cytokine expression, and inflammation. We also hypothesized that the subcutaneous and visceral adipose tissue depots will display distinct adaptations to exercise training. Using a model of early high-fat diet-induced obesity in rats, we found that exercise training could prevent glucose intolerance and associated morphological changes in adipose tissue. Four weeks of high-fat feeding did not induce inflammation in our model. In the absence of clear macrophage infiltration, we found that exercise training increased inflammatory cytokine mRNA in subcutaneous but not in visceral adipose tissue. These novel findings suggest that various cytokines expressed by subcutaneous adipose tissue are involved in the physiological responses to exercise training.
RESEARCH DESIGN AND METHODS
Study protocol.
Female Sprague-Dawley rats (∼125 g) were randomly assigned to four groups (n = 6/group), treated with either regular chow diet or high-fat diet and with or without exercise training for a total of 4 wk. All rats were housed in individual cages, and exercise training consisted of voluntary wheel running. Rats in the exercise training group had continuous access to running wheels (Nalgene, Rochester, NY). Completed wheel revolutions and time spent running were monitored. The high-fat diet (Research Diets D12492, New Brunswick, NJ) consisted of (in kcal%) 60% fat, 20% protein, and 20% carbohydrate. After 4 wk, the rats were killed by decapitation. To eliminate acute effects of exercise, all rats in the training groups were moved into individual cages without access to running wheels 1 day before being killed. All animals were fasted for 10 h before decapitation. Blood was collected, and subcutaneous adipose tissue from the inguinal region and visceral adipose tissue from the parametrial fat depots as well as liver and triceps muscle were immediately removed and weighed. One piece (300–500 mg) of each fat depot and liver were saved in fixative for histology, while the remaining tissue was snap frozen and stored in liquid nitrogen. All experiments were reviewed and approved by the Institutional Animal Care and Use Committee of the Joslin Diabetes Center and were conducted in accordance with the guidelines of the National Institutes of Health.
Blood glucose, body weight, and food consumption.
Blood glucose, body weight, and food consumption were recorded weekly. Blood glucose was measured between 1500 and 1600 by obtaining blood samples from the tail of fully conscious rats with a One-Touch-Ultra portable glucometer (Lifescan, Milpitas, CA). Body weights and food consumption were measured with a digital scale (model CS2000, Ohaus).
Oral glucose tolerance test.
After 3 wk, an oral glucose tolerance test was performed. One day before the oral glucose tolerance test, all rats were placed into individual cages without running wheels and were fasted for 10 h before the test. Glucose was administered by oral gavage (2 mg/g body wt), and blood samples were taken from the tail at 0, 15, 30, 60, 120, and 180 min. Blood glucose concentrations were measured as described above. Insulin levels were obtained with a rat insulin ELISA kit (Crystal Chem INSK020, Downers Grove, IL) according to the manufacturer's instructions. The insulin resistance index was calculated as the product of areas under the glucose and insulin curves (glucose AUC × insulin AUC) as previously described (3).
Histology.
Representative samples of subcutaneous and visceral adipose tissues as well as liver from each rat were fixed in a mixture of methanol, chloroform, and glacial acetic acid in a ratio of 6:3:1 for 3 h and then stored in 70% ethanol at 4°C until further processing. Tissues were routinely processed and embedded in paraffin. Five-micrometer-thick tissue sections were stained with hematoxylin and eosin.
Immunohistochemistry.
Four-micrometer-thick sections of formalin-fixed tissues were baked at 60°C for 1 h, followed by deparaffinization and rehydration. Peroxidase activity was blocked with 3% hydrogen peroxide in ethanol for 15 min. To retrieve antigen, the sections were placed in 10 mM citrate buffer (pH 6.0) and heated at 199°F for 30 min with a microwave (800 W, General Electric, Louisville, KY). After blocking with 1.5% rabbit serum for 15 min, the sections were incubated with a monoclonal mouse anti-rat macrophage/monocyte [CD68] antibody (clone: ED-1, Chemicon, Billerica, MA) at a 1:1,000 dilution for 1 h. The primary antibody was detected with a Vectastain Elite avidin-biotin complex (ABC) kit (Vector Laboratories, Burlington, CA); the horse anti-mouse secondary antibody was used at a 1:200 dilution made in 2% rabbit serum of the source and applied for 30 min. ABC was applied for 30 min. All incubations were carried out in a humid chamber at room temperature. The slides were rinsed with phosphate-buffered saline (PBS) between incubations. The sections were developed with 3,3′-diaminobenzidine (DAB) (DAKO, Carpinteria, CA) as substrate and counterstained with Gill's hematoxylin (Fisher Scientific, Pittsburgh, PA).
Adipocyte size.
Relative adipocyte size was estimated at 400-fold magnification of hematoxylin and eosin-stained sections by counting the number of adipocytes in 10 random high-power fields (HPF) of each sample. Relative cell size was expressed as HPF/adipocyte count and normalized to the chow/sedentary group.
DNA measurements.
Approximately 200 mg of adipose tissue was pulverized and homogenized in 6 volumes of high-salt phosphate-buffered saline pH 7.4 (HS-PBS) containing 15 mM NaH2PO4, 81 mM Na2HPO4, and 2 M NaCl. The homogenate (0.5 ml) was incubated on ice for 3 h and centrifuged at 13,000 rpm and 4°C for 1 min, and the supernatant was recovered. Seventy-five microliters of serial diluted DNA standard (D-7656, Sigma, St. Louis, MO) or sample (in duplicate) was added to 1,417.5 μl of HS-PBS and 7.5 μl of 200 μg/ml Hoechst reagent (Hoechst 33258) in borosilicate glass tubes and read on a Versa Fluor fluorometer (Bio-Rad, Hercules, CA). The number of cells in a probed sample of adipose tissue was expressed as DNA per gram of tissue.
Liver and skeletal muscle triacylglycerol concentrations.
Triacylglycerol concentrations in liver and triceps muscle were estimated from glycerol released after ethanolic KOH hydrolysis by a colorimetric method (Sigma).
Serum cytokines.
After decapitation, blood was collected and allowed to clot at room temperature for 20 min before being set on ice. The blood was then centrifuged for 20 min at 8,000 g. Serum was collected and immediately frozen at −80°C. Serum leptin was measured with an ELISA kit (Crystal Chem), serum adiponectin was measured in duplicate with an RIA kit (LINCO Research, St. Charles, MO), and serum TNF-α, IL-6, and IL-1 receptor antagonist (IL-1Ra) concentrations were measured in duplicate with a Rat Adipocyte LINCOplex Kit (no. RADPK-81K, LINCO Research).
Adipose tissue TNF-α protein measurements.
Adipose tissue protein lysates were prepared by homogenizing ∼200 mg of pulverized adipose tissue in a buffer containing (in mM) 20 Tris, pH 7.5, 5 EDTA, 10 Na4P2O7, 100 NaF, 2 Na3VO4, 3 benzamidine, and 1 PMSF, with 1% Nonidet P-40, 10 μM leupeptin, and 10 μg/ml aprotinin. TNF-α levels were measured in protein lysates by a solid-phase sandwich enzyme-linked immunosorbent assay (Alpco Immunoassays, Salem, NH). The intra-assay coefficients of variation provided by the manufacturer were 6.9% and 4.3% for samples containing 130.7 and 912.1 pg/ml, respectively. The interassay coefficients of variation provided by the manufacturer were 9.0% and 7.8% for serum samples containing 135 and 970.9 pg/ml, respectively.
Quantitative polymerase chain reaction.
Total RNA was isolated from subcutaneous and visceral adipose tissue with the RNeasy Lipid Tissue Mini Kit (no. 74804, Qiagen, Valencia, CA) according to the manufacturer's instructions. RNA was reverse transcribed to cDNA with Moloney murine leukemia virus (MMLV) reverse transcriptase (no. M1701, Promega, Madison, WI). For quantitative assessment, real-time polymerase chain reaction was performed by cDNA amplification for 40 cycles with SYBR Green PCR Master Mix (no. 4309155, Applied Biosystems, Framingham, MA) on an ABI Prism 7900 sequence detection system. Primer sequences are shown in Table 1. Differences in the starting quantity of each transcript were calculated relative to the expression of the housekeeping gene β-actin with the formula 2 (where Ct is threshold cycle; K. Livak, PE-ABI, Sequence Detector User Bulletin 2) and normalized to the chow/sedentary group.
Table 1.
Primer sequences
| 5′-3′ Primer Sequence Forward | 5′-3′ Primer Sequence Reverse | |
|---|---|---|
| β-Actin | AAGTCCCTCACCCTCCCAAAAG | AAGCAATGCTGTCACCTTCCC |
| Leptin | CCAAAACCCTCATCAAGACC | GCCAACTGTTGAAGAATGTCCC |
| Adiponectin | AATCCTGCCCAGTCATGAAG | CATCTCCTGGGTCACCCTTA |
| TNF-α | AAATGGGCTCCCTCTCATCAGTTC | TCTGCTTGGTGGTTTGCTACGAC |
| IL-6 | TCCTACCCCAACTTCCAATGCTC | TTGGATGGTCTTGGTCCTTAGCC |
| IL-1Ra | AAGACCTTCTACCTGAGGAACAACC | GCCCAAGAACACATTCCGAAAGTC |
| MCP-1 | CTCACCTGCTGCTACTCATTCACT | TTCCTTATTGGGGTCAGCAC |
| CD-68 | CACTTCGGGCCATGCTTCT | AGGACCAGGCCAATGATGAG |
IL-1Ra, IL-1 receptor antagonist; MCP-1, monocyte chemotactic protein 1.
Statistical analysis.
Data are shown as means ± SE. All data were compared with two-way analysis of variance and Tukey's post hoc analysis. Pearson's correlation coefficients were used to describe the linear association between variables. The differences between groups were considered significant when P < 0.05.
RESULTS
Running distance, body weight, caloric intake, and blood glucose.
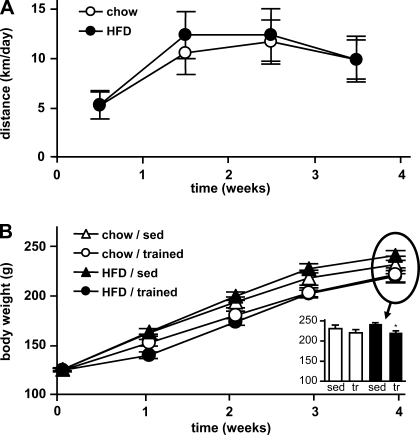
Running distance in the training groups was not different between the rats fed regular chow or a high-fat diet (Fig. 1A, Table 2). The increased energy expenditure through exercise training was compensated for by a significantly higher caloric intake in the training groups (Table 2). Nevertheless, trained animals in the high-fat diet group gained significantly less weight and thus had significantly lower final body weights than their sedentary controls (Fig. 1B). Average blood glucose concentrations were significantly increased in sedentary rats on the high-fat diet, and this effect was negated in the trained rats on the same diet (Table 2).
Fig. 1.
Running distance and body weights. Young female rats on regular chow or high-fat diet (HFD) were kept sedentary (sed) or performed 4 wk of voluntary wheel running (trained, tr). A: running distances in the training groups were continuously monitored over the course of 4 wk. B: body weights were determined at baseline and after 1, 2, 3, and 4 wk. Data are means ± SE. *P < 0.05 vs. sedentary.
Table 2.
Running distance, caloric intake, and blood glucose
| Chow/Sedentary | Chow/Trained | HFD/Sedentary | HFD/Trained | |
|---|---|---|---|---|
| n | 6 | 6 | 6 | 6 |
| Running distance, km/day | N/A | 8.8±1.8 | N/A | 9.3±1.9 |
| Caloric intake, kcal·g body wt−1·wk−1 | 2.02±0.07 | 2.23±0.11* | 2.19±0.14*† | 2.44±0.16*† |
| Blood glucose, mg/dl | 124±1.9 | 120±2.1 | 132±2.5† | 125±1.5* |
Data were averaged over the 4 wk of the study and are represented as means ± SE for n animals. HFD, high-fat diet; N/A, not applicable.
P < 0.05 vs. sedentary;
P < 0.05 vs. chow diet.
Oral glucose tolerance test.
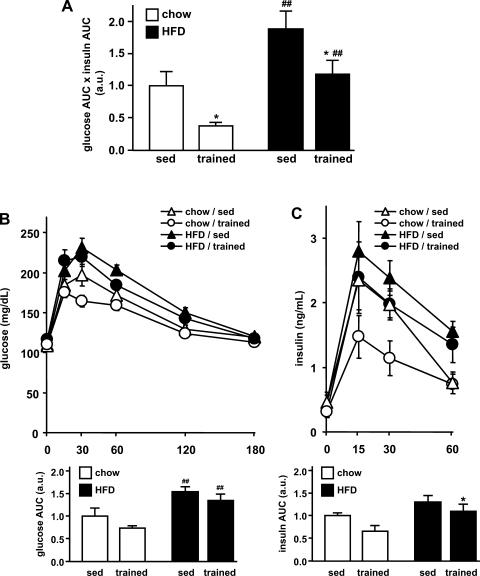
After 3 wk of chow or high-fat diet with or without exercise intervention, glucose tolerance was assessed by an oral glucose tolerance test. Insulin resistance was obtained from the oral glucose tolerance test by combining the responses (AUC) in glucose and insulin levels, both indicators for insulin resistance (Fig. 2). An increase of this value (glucose-insulin index) reflects an increase in insulin resistance (3). High-fat feeding was associated with increased insulin resistance (Fig. 2A). This adverse effect was prevented in the training group. In the chow-fed rats, exercise training was associated with significantly improved insulin sensitivity compared with sedentary rats on the same diet, and also compared with trained rats on a high-fat diet.
Fig. 2.
Oral glucose tolerance. Oral glucose tolerance was assessed after 3 wk. A: as an indicator for insulin resistance, the glucose-insulin index was determined by multiplying the areas under the glucose and insulin curve (glucose AUC × insulin AUC). a.u., Arbitrary units. B: blood glucose was determined at 0, 15, 30, 60, 120, and 180 min after the glucose charge. For each group, the AUC was determined (bottom). C: serum insulin was determined at 0, 15, 30, and 60 min, and AUCs were averaged for comparison between the groups (bottom). Data are means ± SE. *P < 0.05 vs. sedentary; ##P < 0.01 vs. chow diet.
Adipose tissue characteristics.
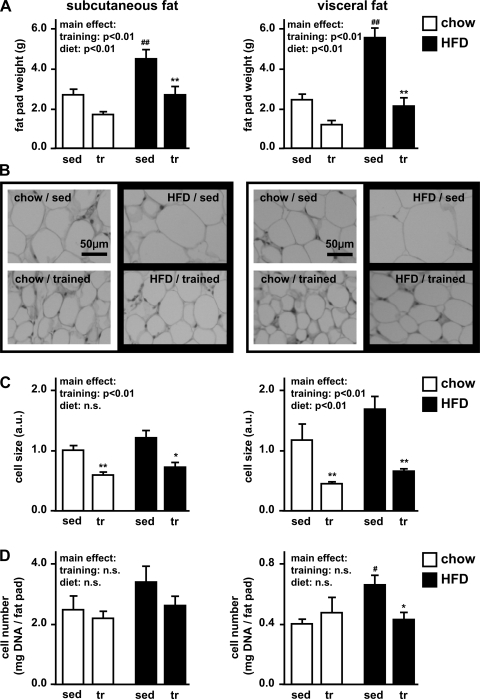
To characterize the plasticity of adipose tissue in response to exercise training, we assessed changes in fat pad mass, adipocyte size, and total cell number. In sedentary rats, high-fat diet significantly increased both subcutaneous and visceral fat pad mass (Fig. 3A). High-fat feeding in the sedentary rats also tended to increase adipocyte size in visceral fat (43%; P = 0.1) and cell number per gram of tissue in subcutaneous fat (36%; P = 0.1) and visceral fat (63%; P = 0.01) (Fig. 3, B–D). These effects were prevented in the trained animals, which showed significantly decreased fat pad mass and adipocyte size compared with their sedentary controls (Fig. 3). Exercise training also induced a significant reduction in cell number in the visceral fat of high-fat diet-fed rats (Fig. 3D). Overall, exercise training prevented the effects of the high-fat diet on characteristics of adipose tissue, and these results were more pronounced in visceral than in subcutaneous fat.
Fig. 3.
Subcutaneous and visceral fat pad weight, adipocyte size, and cell number. Adipose tissue was excised from the subcutaneous (inguinal) and visceral (parametrial) fat depots. A: adipose pad weights were determined. B: paraffin sections were stained with hematoxylin and eosin in order to visualize differences in cell size. C: adipocyte size was estimated by counting adipocytes in 10 high-power fields (HPF). Estimated relative cell size was calculated as HPF/cell number and normalized to chow/sedentary in subcutaneous adipose tissue. D: total cell number was estimated by fluorospectrometric assessment of DNA. Results are expressed as mg DNA/g fat pad. Data are as means ± SE. *P < 0.05 vs. sedentary; **P < 0.01 vs. sedentary; #P < 0.05 vs. chow diet; ##P < 0.01 vs. chow diet.
Triacylglycerol content in skeletal muscle and liver.
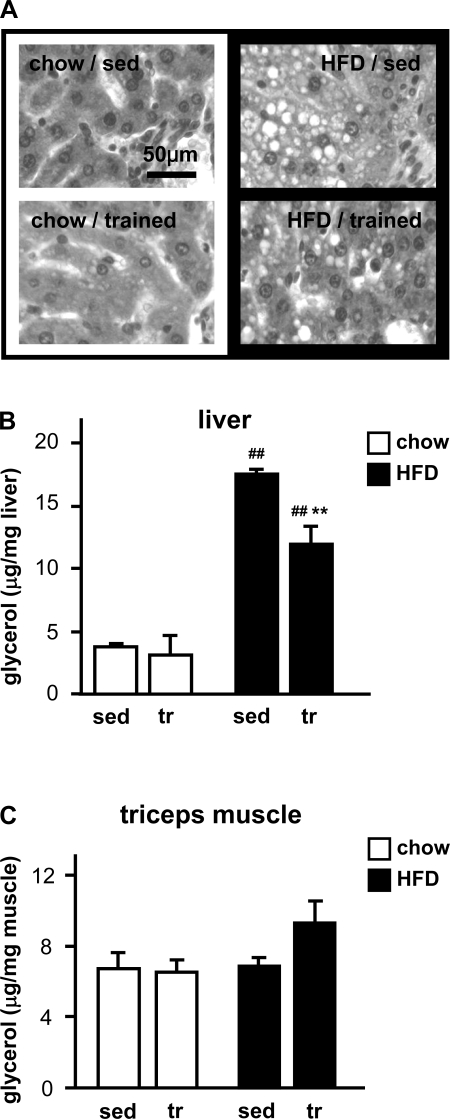
High-fat diet-induced insulin resistance can be caused by increased triacylglycerol content in nonadipose tissues, such as skeletal muscle and liver. We found that high-fat feeding resulted in a clear increase of triacylglycerol in liver (Fig. 4, A and B) but not in skeletal muscle (Fig. 4C). The high-fat diet effect was significantly less pronounced in trained rats.
Fig. 4.
Triacylglycerol content in liver and triceps muscle. A: paraffin sections of liver were stained with hematoxylin and eosin. Triacylglycerol accumulation can be detected in the form of unstained lipid droplets in the high-fat diet groups (right). B and C: triacylglycerol concentrations in liver (B) and triceps muscle (C) were estimated by colorimetric measurements of glycerol released after ethanolic KOH hydrolysis. Data are means ± SE. **P < 0.01 vs. sedentary; ##P < 0.01 vs. chow diet.
Leptin and adiponectin serum concentrations and adipose tissue gene expression.
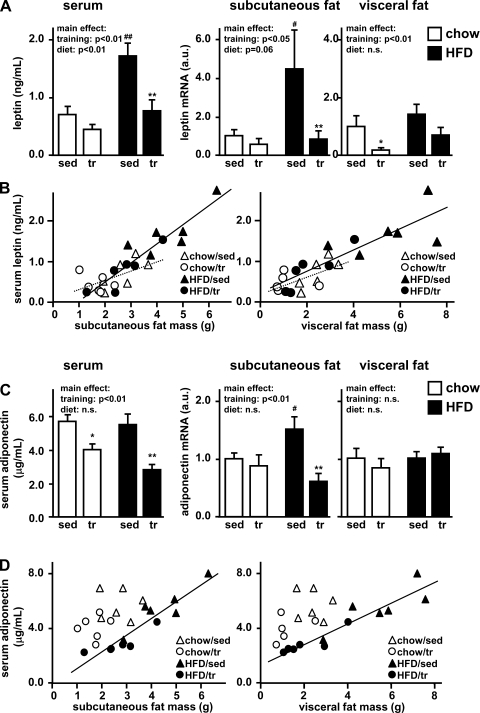
Leptin and adiponectin serum levels may play a role in states of impaired glucose tolerance. Thus, we investigated the effects of exercise training on leptin and adiponectin serum concentrations as well as adipose tissue gene expression. Exercise training was associated with decreased serum leptin, while high-fat feeding significantly increased leptin concentrations (Fig. 5A). These results correlated strongly with both subcutaneous (R = 0.89, P < 0.001) and visceral (R = 0.87, P < 0.001) fat pad mass (Fig. 5B). Accordingly, exercise training was also associated with significantly decreased leptin mRNA expression in both subcutaneous and visceral adipose tissue (main effect: P < 0.05 in both fat depots; Fig. 5A). However, only subcutaneous leptin mRNA was elevated in sedentary high-fat-fed rats, suggesting that subcutaneous adipose tissue may play a predominant role in diet-induced increases in serum leptin.
Fig. 5.
Leptin and adiponectin. A and C: after 4 wk of exercise training and high-fat feeding, serum levels of leptin (A) and adiponectin (C) were determined by LINCO multiplex ELISAs. Adipokine gene expression was assessed in subcutaneous and visceral adipose tissue by real-time PCR. mRNA levels were normalized to the housekeeping gene β-actin and expressed relative to the sedentary/chow group. Data are means ± SE. *P < 0.05 vs. sedentary; **P < 0.01 vs. sedentary; #P < 0.05 vs. chow diet; ##P < 0.01 vs. chow diet. n.s., Not significant. B and D: correlations between adipose pad mass and leptin (B) or adiponectin (D) serum levels are shown for subcutaneous (left) and visceral (right) adipose tissue.
Serum adiponectin was significantly decreased in the trained rats (Fig. 5C). However, exercise training did not affect adiponectin mRNA expression in chow-fed rats in either fat depot. In the high-fat diet group only subcutaneous adiponectin mRNA was increased, and this effect was prevented by exercise training. While serum adiponectin levels correlated with subcutaneous and visceral fat pad mass in rats on the high-fat diet (R = 0.93, P < 0.001), there was no significant correlation in rats on the chow diet (Fig. 5D). In comparing chow-fed rats and high-fat-fed rats with similar fat pad weights, the chow-fed rats had higher serum adiponectin levels (Fig. 5D). Overall, leptin and adiponectin serum levels correlated with fat pad mass, while exercise training per se had little effect on serum levels or gene expression.
Macrophage markers after high-fat diet and exercise training.
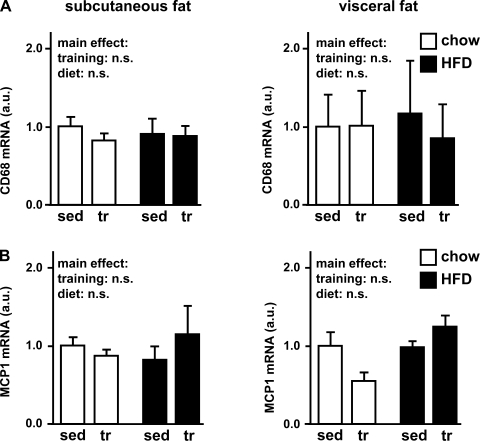
Despite the impressive changes in fat pad weights and adipocyte morphology, immunohistochemical examination of adipose tissues for the macrophage marker CD68 (ED-1) did not show any change after 4 wk of high-fat diet or exercise training (data not shown). Consistent with these findings, CD68 and monocyte chemotactic protein 1 (MCP-1) gene expression in adipose tissue did not change significantly under the different conditions (Fig. 6). Thus, 4 wk of high-fat diet or exercise training was not associated with any significant macrophage infiltration into either subcutaneous or visceral adipose tissue.
Fig. 6.
Macrophage markers—CD68 and monocyte chemotactic protein 1 (MCP-1). As markers for macrophage infiltration into adipose tissue, the macrophage marker gene CD68 (A) and MCP-1 (B) were assessed in subcutaneous and visceral adipose tissue by quantitative PCR. mRNA levels were normalized to the housekeeping gene β-actin and expressed relative to the respective sedentary/chow group. Data are means ± SE.
TNF-α, IL-6, and IL-1Ra serum levels and adipose tissue gene expression.
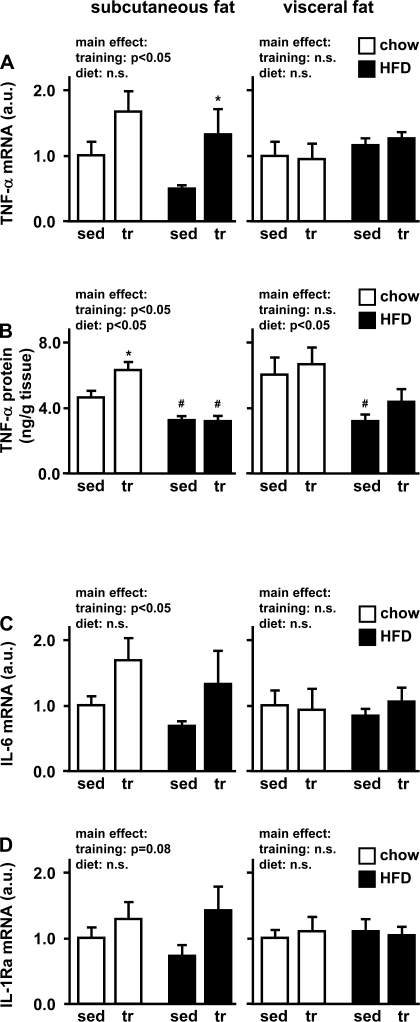
In line with the absence of macrophage infiltration into adipose tissue, 4 wk of exercise training or high-fat diet was not associated with any detectable changes in serum levels of TNF-α, IL-6, or IL-1Ra (data not shown). In our model of early diet-induced insulin resistance, it was interesting to investigate adipose tissue cytokine expression in the absence of macrophage infiltration or systemic inflammation. In visceral adipose tissue, exercise training did not affect cytokine mRNA expression. However, in subcutaneous fat, training actually increased mRNA expression of several cytokines, and these increases were similar in both the chow and high-fat diet groups (main effect: P < 0.05 for TNF-α and IL-6, P = 0.07 for IL-1Ra) (Fig. 7, A, C, and D). To investigate whether mRNA expression is similar to protein concentrations, adipose tissue TNF-α protein was measured. Similar to mRNA levels, TNF-α protein concentration did not respond to exercise training in visceral adipose tissue but was increased in subcutaneous adipose tissue of trained chow-fed rats. Interestingly, this increase was not seen in the high-fat diet group. Moreover, the high-fat diet was associated with decreased TNF-α concentrations in both subcutaneous and visceral adipose tissue (Fig. 7B).
Fig. 7.
TNF-α, IL-6, and IL-1 receptor antagonist (IL-1Ra). After 4 wk of voluntary wheel running, subcutaneous and visceral adipose tissue of chow- and high fat-fed rats was studied for TNF-α (A), IL-6 (C), and IL-1Ra (D) gene expression by quantitative PCR. mRNA levels were normalized to the housekeeping gene β-actin and expressed relative to the respective sedentary/chow group. Adipose tissue TNF-α protein levels (B) were assessed by ELISA and are expressed as nanograms of protein per gram of tissue weight. Data are means ± SE. *P < 0.05 vs. sedentary; #P < 0.05 vs. chow diet.
DISCUSSION
We investigated changes in subcutaneous and visceral adipose tissue in response to high-fat feeding and exercise training in rats. High-fat feeding led to dramatic increases in the total amount of adipose tissue and was associated with decreased oral glucose tolerance. Exercise training preserved normal adipose pad mass and oral glucose tolerance in rats fed a high-fat diet. The total amount of adipose tissue is a function of adipocyte size and number. The enlargement of adipocytes has previously been described as an independent marker for insulin resistance and a risk factor for type 2 diabetes (16, 17, 26). Thus, in our model, the development of insulin resistance after only 3 wk (time point of oral glucose tolerance test) of high-fat feeding might be explained by the increase in fat cell size. This effect was more pronounced in visceral than in subcutaneous adipose tissue, raising the possibility that the more prominent role of visceral fat in the development of obesity-induced insulin resistance may be due in part to visceral fat being more sensitive to high-fat feeding-induced increases in adipocyte cell size.
The exact mechanism by which increased adipocyte cell size leads to insulin resistance is still being debated. One hypothesis is that large adipocytes indicate that the adipose tissue is saturated with lipids. This would lead to increased lipid storage in other organs such as skeletal muscle and liver. We did not detect any changes in triacylglycerol storage in skeletal muscle after high-fat feeding or exercise training. However, high-fat feeding led to an approximately fivefold increase in liver triacylglycerol, which was partially prevented by exercise training. Thus, the development of insulin resistance in response to high-fat feeding may be explained by increased liver triacylglycerol, possibly in association with maximal lipid storage capacity in visceral adipose tissue.
Another mechanism through which adipose tissue can contribute to changes in insulin sensitivity is altered expression of the glucose transporter GLUT4. Even though adipose tissue accounts for <10% of whole body glucose uptake, adipocyte-specific GLUT4-knockout mice develop insulin resistance (7). In the present study, total GLUT4 protein expression did not change significantly with exercise training in subcutaneous or visceral fat (data not shown). Similar to these data, previous results from our laboratory (8) show that plasma membrane GLUT4 protein does not significantly change with exercise training. However, in the same study, microsomal membrane GLUT4 as well as GLUT4 protein per cell and insulin-stimulated GLUT4 in the plasma membrane were increased in visceral fat from trained rats (8). Furthermore, Craig et al. (4) have reported that small adipocytes from trained rats express higher levels of insulin receptors. Thus, despite unchanged total GLUT4 protein levels, exercise training appears to increase insulin-stimulated glucose uptake capacities of adipose tissue. Future studies will be necessary to decipher the complete mechanism through which adipose tissue may contribute to improved whole body insulin sensitivity after exercise training.
Obesity and insulin resistance have frequently been associated with increases in inflammatory cytokines. This has led to the hypothesis that inflammation may be a major cause for the development of diabetes (9). In fact, mice lacking TNF-α or TNF-α receptors are resistant to the development of diabetes (11), and administration of IL-6 to 3T3-L1 adipocytes inhibits insulin-stimulated glucose transport (18). However, IL-6-knockout mice showed mature-onset obesity and glucose intolerance in one study (25) and high-fat feeding-induced increases in glucose levels in another study (5). Thus the role of IL-6 and other cytokines in the development of insulin resistance is still being debated. In our study, we did not detect any cytokine response (TNF-α, IL-6, or IL-1Ra) with 4 wk of high-fat feeding. This is particularly remarkable in view of the dramatic morphological changes in adipose tissue with the high-fat diet, and in view of the development of insulin resistance after only 3 wk of high-fat feeding. TNF-α and IL-6 are mainly produced by the stromal fraction of adipose tissue, in particular by macrophages. Hence, the lack of macrophage infiltration into subcutaneous or visceral adipose tissue after high-fat feeding is consistent with the normal cytokine mRNA expression in the same tissues. In a recent study in which C57BL/6 mice were high-fat fed for up to 20 wk, at least 12 wk of high-fat feeding was necessary to induce clear macrophage infiltrations into adipose tissue and increases in inflammatory markers (20). Our data show that insulin resistance can develop in early stages without any accompanying signs of inflammation, supporting the hypothesis that inflammatory cytokines may be associated with, but not necessarily causally linked to, insulin resistance in the early stages of the disease.
One hypothesis of our study was that exercise training may exert its beneficial effects in part through changes in adipose tissue cytokine expression. Previous studies have been controversial, reporting both decreases (19) and increases (12) in inflammatory cytokines following exercise training. Similar to previous reports (2, 6), we did not detect any changes in serum cytokine levels after exercise training. Adipose tissue TNF-α, IL-6, and IL-1Ra mRNA all increased with exercise training, and this increase was specific to subcutaneous adipose tissue and did not occur in visceral fat. Concurrently, training-induced increases in adipose tissue TNF-α protein concentrations occurred specifically in subcutaneous adipose tissue. In contrast to mRNA levels, however, TNF-α concentrations were elevated only in the trained rats on the chow diet. Tissue protein levels of secretory proteins give a momentary picture and may not fully reflect the dynamics of protein synthesis and release. The local training response of adipose tissue cytokine expression suggests that inflammatory cytokines may play an autocrine or paracrine role. For example, both TNF-α and IL-6 induce lipolysis in adipose tissue (13, 23). Thus, increased expression after training may help to provide lipids, possibly to be taken up by muscle and replenish depleted energy stores after exercise. While TNF-α is known to inhibit skeletal muscle insulin signaling via serine phosphorylation of insulin receptor substrate 1 (10), IL-6 has been suggested to activate AMP-activated protein kinase (AMPK) in muscle and adipose tissue (14) and may thus contribute to improved glucose uptake. Increased TNF-α and IL-6 gene expression might play a role in both lipid and glucose metabolism in trained subcutaneous adipose tissue via autocrine effects, and in adjacent skeletal muscle via paracrine effects. The significance of cytokine expression in trained subcutaneous fat and the mechanisms of potential cross talk between subcutaneous adipose tissue and exercising skeletal muscle remain subject to future investigations. The specific training effect on subcutaneous adipose tissue is of particular interest in view of recent findings from transplantation studies (21) that clearly emphasize a beneficial role of subcutaneous but not visceral fat on glucose metabolism.
In conclusion, our study provides novel insights into the differential responses of subcutaneous and visceral fat to high-fat diet and exercise training. We show that increased insulin resistance after a high-fat diet and improved insulin sensitivity after exercise training correlate closely with morphological changes in subcutaneous and, even more pronounced, in visceral fat. We further demonstrate that high-fat diet-induced obesity and insulin resistance can occur without detectable inflammation. Finally, we provide novel data on cytokine responses to exercise training that are specific to subcutaneous fat and suggest cross talk between skeletal muscle and subcutaneous fat in response to exercise training.
GRANTS
This work was supported by National Institutes of Health (NIH) Grants R01-DK-068626 (L. J. Goodyear) and P30-DK-36836, a Diabetes and Endocrinology Research Center Grant to the Joslin Diabetes Center. K. S. C. Gollisch was supported by a fellowship within the Postdoc Program of the German Academic Exchange Service (DAAD) and J. Brandauer by NIH Training Grant T32-DK-07260-29. N. Jessen was supported by Danish Agency for Science Technology and Innovation Grant 271-07-0719.
Acknowledgments
We thank Dr. Uma Gunasekaran and the Joslin Diabetes Center Specialized Assay Core for technical assistance.
REFERENCES
- 1.Atzmon G, Yang XM, Muzumdar R, Ma XH, Gabriely I, Barzilai N. Differential gene expression between visceral and subcutaneous fat depots. Horm Metab Res 34: 622–628, 2002. [DOI] [PubMed] [Google Scholar]
- 2.Chennaoui M, Drogou C, Gomez-Merino D. Effects of physical training on IL-1beta, IL-6 and IL-1ra concentrations in various brain areas of the rat. Eur Cytokine Netw 19: 8–14, 2008. [DOI] [PubMed] [Google Scholar]
- 3.Cortez MY, Torgan CE, Brozinick JT Jr, Ivy JL. Insulin resistance of obese Zucker rats exercise trained at two different intensities. Am J Physiol Endocrinol Metab 261: E613–E619, 1991. [DOI] [PubMed] [Google Scholar]
- 4.Craig BW, Hammons GT, Garthwaite SM, Jarett L, Holloszy JO. Adaptation of fat cells to exercise: response of glucose uptake and oxidation to insulin. J Appl Physiol 51: 1500–1506, 1981. [DOI] [PubMed] [Google Scholar]
- 5.Di Gregorio GB, Hensley L, Lu T, Ranganathan G, Kern PA. Lipid and carbohydrate metabolism in mice with a targeted mutation in the IL-6 gene: absence of development of age-related obesity. Am J Physiol Endocrinol Metab 287: E182–E187, 2004. [DOI] [PubMed] [Google Scholar]
- 6.Gomez-Merino D, Drogou C, Guezennec CY, Chennaoui M. Effects of chronic exercise on cytokine production in white adipose tissue and skeletal muscle of rats. Cytokine 40: 23–29, 2007. [DOI] [PubMed] [Google Scholar]
- 7.Graham TE, Yang Q, Bluher M, Hammarstedt A, Ciaraldi TP, Henry RR, Wason CJ, Oberbach A, Jansson PA, Smith U, Kahn BB. Retinol-binding protein 4 and insulin resistance in lean, obese, and diabetic subjects. N Engl J Med 354: 2552–2563, 2006. [DOI] [PubMed] [Google Scholar]
- 8.Hirshman MF, Goodyear LJ, Horton ED, Wardzala LJ, Horton ES. Exercise training increases GLUT-4 protein in rat adipose cells. Am J Physiol Endocrinol Metab 264: E882–E889, 1993. [DOI] [PubMed] [Google Scholar]
- 9.Hotamisligil GS Inflammation and metabolic disorders. Nature 444: 860–867, 2006. [DOI] [PubMed] [Google Scholar]
- 10.Hotamisligil GS, Budavari A, Murray D, Spiegelman BM. Reduced tyrosine kinase activity of the insulin receptor in obesity-diabetes. Central role of tumor necrosis factor-alpha. J Clin Invest 94: 1543–1549, 1994. [DOI] [PMC free article] [PubMed] [Google Scholar]
- 11.Hotamisligil GS, Shargill NS, Spiegelman BM. Adipose expression of tumor necrosis factor-alpha: direct role in obesity-linked insulin resistance. Science 259: 87–91, 1993. [DOI] [PubMed] [Google Scholar]
- 12.Ito Y, Nomura S, Ueda H, Sakurai T, Kizaki T, Ohno H, Izawa T. Exercise training increases membrane bound form of tumor necrosis factor-alpha receptors with decreases in the secretion of soluble forms of receptors in rat adipocytes. Life Sci 71: 601–609, 2002. [DOI] [PubMed] [Google Scholar]
- 13.Kawakami M, Murase T, Ogawa H, Ishibashi S, Mori N, Takaku F, Shibata S. Human recombinant TNF suppresses lipoprotein lipase activity and stimulates lipolysis in 3T3-L1 cells. J Biochem (Tokyo) 101: 331–338, 1987. [DOI] [PubMed] [Google Scholar]
- 14.Kelly M, Keller C, Avilucea PR, Keller P, Luo Z, Xiang X, Giralt M, Hidalgo J, Saha AK, Pedersen BK, Ruderman NB. AMPK activity is diminished in tissues of IL-6 knockout mice: the effect of exercise. Biochem Biophys Res Commun 320: 449–454, 2004. [DOI] [PubMed] [Google Scholar]
- 15.Knowler WC, Barrett-Connor E, Fowler SE, Hamman RF, Lachin JM, Walker EA, Nathan DM. Reduction in the incidence of type 2 diabetes with lifestyle intervention or metformin. N Engl J Med 346: 393–403, 2002. [DOI] [PMC free article] [PubMed] [Google Scholar]
- 16.Lawrence JC, Colvin J, Cartee GD, Holloszy JO. Effects of aging and exercise on insulin action in rat adipocytes are correlated with changes in fat cell volume. J Gerontol A Biol Sci Med Sci 44: B88–B92, 1989. [DOI] [PubMed] [Google Scholar]
- 17.Lundgren M, Svensson M, Lindmark S, Renstrom F, Ruge T, Eriksson JW. Fat cell enlargement is an independent marker of insulin resistance and “hyperleptinaemia.” Diabetologia 50: 625–633, 2007. [DOI] [PubMed] [Google Scholar]
- 18.Rotter V, Nagaev I, Smith U. Interleukin-6 (IL-6) induces insulin resistance in 3T3-L1 adipocytes and is, like IL-8 and tumor necrosis factor-alpha, overexpressed in human fat cells from insulin-resistant subjects. J Biol Chem 278: 45777–45784, 2003. [DOI] [PubMed] [Google Scholar]
- 19.Sakurai T, Izawa T, Kizaki T, Ogasawara JE, Shirato K, Imaizumi K, Takahashi K, Ishida H, Ohno H. Exercise training decreases expression of inflammation-related adipokines through reduction of oxidative stress in rat white adipose tissue. Biochem Biophys Res Commun 379: 605–609, 2009. [DOI] [PubMed] [Google Scholar]
- 20.Strissel KJ, Stancheva Z, Miyoshi H, Perfield JW, Defuria J, Jick Z, Greenberg AS, Obin MS. Adipocyte death, adipose tissue remodeling and obesity complications. Diabetes 56: 2910–2918, 2007. [DOI] [PubMed] [Google Scholar]
- 21.Tran TT, Yamamoto Y, Gesta S, Kahn CR. Beneficial effects of subcutaneous fat transplantation on metabolism. Cell Metab 7: 410–420, 2008. [DOI] [PMC free article] [PubMed] [Google Scholar]
- 22.Vague J Sexual differentiations and distribution of fat. Sem Hop 26: 2387–2390, 1950. [PubMed] [Google Scholar]
- 23.van Hall G, Steensberg A, Sacchetti M, Fischer C, Keller C, Schjerling P, Hiscock N, Moller K, Saltin B, Febbraio MA, Pedersen BK. Interleukin-6 stimulates lipolysis and fat oxidation in humans. J Clin Endocrinol Metab 88: 3005–3010, 2003. [DOI] [PubMed] [Google Scholar]
- 24.Wajchenberg BL Subcutaneous and visceral adipose tissue: their relation to the metabolic syndrome. Endocr Rev 21: 697–738, 2000. [DOI] [PubMed] [Google Scholar]
- 25.Wallenius V, Wallenius K, Ahren B, Rudling M, Carlsten H, Dickson SL, Ohlsson C, Jansson JO. Interleukin-6-deficient mice develop mature-onset obesity. Nat Med 8: 75–79, 2002. [DOI] [PubMed] [Google Scholar]
- 26.Weyer C, Foley JE, Bogardus C, Tataranni PA, Pratley RE. Enlarged subcutaneous abdominal adipocyte size, but not obesity itself, predicts type II diabetes independent of insulin resistance. Diabetologia 43: 1498–1506, 2000. [DOI] [PubMed] [Google Scholar]


