Abstract
Increasing efferent renal sympathetic nerve activity (ERSNA) increases afferent renal nerve activity (ARNA), which in turn decreases ERSNA via activation of the renorenal reflexes in the overall goal of maintaining low ERSNA. We now examined whether the ERSNA-induced increases in ARNA are modulated by dietary sodium and the role of endothelin (ET). The ARNA response to reflex increases in ERSNA was enhanced in high (HNa)- vs. low-sodium (LNa) diet rats, 7,560 ± 1,470 vs. 900 ± 390%·s. The norepinephrine (NE) concentration required to increase PGE2 and substance P release from isolated renal pelvises was 10 pM in HNa and 6,250 pM in LNa diet rats. In HNa diet pelvises 10 pM NE increased PGE2 release from 67 ± 6 to 150 ± 13 pg/min and substance P release from 6.7 ± 0.8 to 12.3 ± 1.8 pg/min. In LNa diet pelvises 6,250 pM NE increased PGE2 release from 64 ± 5 to 129 ± 22 pg/min and substance P release from 4.5 ± 0.4 to 6.6 ± 0.7 pg/min. In the renal pelvic wall, ETB-R are present on unmyelinated Schwann cells close to the afferent nerves and ETA-R on smooth muscle cells. ETA-receptor (R) protein expression in the renal pelvic wall is increased in LNa diet. In HNa diet, renal pelvic administration of the ETB-R antagonist BQ788 reduced ERSNA-induced increases in ARNA and NE-induced release of PGE2 and substance P. In LNa diet, the ETA-R antagonist BQ123 enhanced ERSNA-induced increases in ARNA and NE-induced release of substance P without altering PGE2 release. In conclusion, activation of ETB-R and ETA-R contributes to the enhanced and suppressed interaction between ERSNA and ARNA in conditions of HNa and LNa diet, respectively, suggesting a role for ET in the renal control of ERSNA that is dependent on dietary sodium.
Keywords: sensory nerves, substance P, PGE2, endothelin A receptors, endothelin B receptors, renal pelvis, norepinephrine
the majority of the afferent renal nerve fibers are localized in the renal pelvic wall (28, 29, 37) where many of these nerve fibers are in close contact with sympathetic nerves (29). The close contact between the renal afferent and sympathetic nerves provides anatomical support for a functional interaction between efferent renal sympathetic nerve activity (ERSNA) and afferent renal nerve activity (ARNA). Indeed, our previous studies have provided evidence for such an interaction, whereby increases in ERSNA increase ARNA (29). The interaction between ERSNA and ARNA is modulated by norepinephrine (NE), which increases and decreases the activation of the renal sensory nerves by stimulating α1- and α2-adrenoceptors, respectively, located on the renal pelvic sensory nerve fibers. Not only is there an interaction between ERSNA and ARNA, but there is also a reciprocal interaction between ARNA and ERSNA. Increases in ARNA decrease ERSNA, causing a natriuresis, i.e., a renorenal reflex response (33). Thus, ERSNA-induced increases in ARNA would exert a powerful negative feedback control of ERSNA via activation of the renorenal reflexes in the overall goal of maintaining low ERSNA to prevent renal sodium retention.
We reasoned that the ERSNA-ARNA interaction would play a significant role in the renal control of body water and sodium balance if the interaction was modulated by dietary sodium. In conditions of low-sodium (LNa) dietary intake, suppression of the ERSNA-ARNA interaction would increase ERSNA via impairment of the renorenal reflex mechanism leading to sodium retention. In contrast, in conditions of high-sodium (HNa) dietary intake, enhancement of the ERSNA-ARNA interaction, would increase the inhibitory renorenal reflex control of ERSNA, resulting in suppression of ERSNA to prevent/limit sodium retention. This hypothesis derives support from our studies in afferent renal denervated rats fed HNa diet, which are characterized by increased responsiveness of ERSNA to various sympathetic stimuli and increased arterial pressure (23, 31). Furthermore, the responsiveness of the renal mechanosensory nerves to increases in renal pelvic pressure is enhanced in rats fed HNa diet and suppressed in LNa diet rats (25).
Because our studies showed that the interaction between ERSNA and ARNA was enhanced by HNa diet and suppressed by LNa diet, we examined the possible mechanisms involved. We focused on endothelin (ET). ET-1 exerts its effects by activating two G protein-coupled receptors, ETA-R and ETB-R (17). The responses to ET vary with the cell type/organ. The major vascular effects of ETA-R activation are vasoconstriction. The results of activation of ETB-R are more diverse and include vasoconstriction, vasodilation, diuresis, and natriuresis (47). In addition, our previous studies suggested a role for ET-1 in the activation of renal mechanosensory nerves, the nature of which is dependent on dietary sodium intake (24). Activation of renal pelvic ETB-R contributes to the enhanced ARNA responsiveness to renal mechanosensory nerve activation in conditions of HNa diet. In contrast, activation of ETA-R contributes to the suppressed ARNA responsiveness of the renal mechanosensory nerves in conditions of LNa diet. We therefore examined whether activation of ETA-R and/or ETB-R contributed to the dietary sodium-induced modulation of the interaction between ERSNA and ARNA.
The in vivo studies were complemented by in vitro studies in the isolated renal pelvic wall from HNa and LNa diet rats. Because this preparation is by design sympathetically denervated, any effects of dietary sodium on NE-induced release of PGE2 and substance P in the absence or presence of ET-R antagonists would be related to modulation of a postsynaptic mechanism(s) at the sensory nerve endings.
Furthermore, we examined whether altered gene and/or protein expression of ETA-R and/or ETB-R contributes to the differential effects of ET-1 on the responsiveness of the afferent renal nerves in conditions of HNa and LNa diet. We also carried out immunohistochemical studies to determine the cellular distribution of ETA-R and ETB-R in the renal pelvic wall and in T9–L1 dorsal root ganglia (DRGs), which contain the majority of the cell bodies of the afferent renal nerves (3, 6).
METHODS
The study was performed on male Sprague-Dawley rats weighing 197–420 g (mean 291 ± 3 g). Two weeks before the study, rats were placed on either sodium (Na+)-deficient pellets (Na+ = 1.6 meq/kg: MP Biomedicals Solon, Solon, OH) with tap water drinking fluid (LNa diet, n = 84), normal Na+ pellets (Na+ = 163 meq/kg; Teklad) with tap water drinking fluid [normal sodium (NNa) diet, n = 47] or normal Na+ pellets with 0.9% NaCl drinking fluid (HNa diet, n = 65) (25).
The experimental protocols were approved by the Institutional Animal Care and Use Committee and performed according to the “Guide for the Care and Use of Laboratory Animals” from the National Institutes of Health.
Anesthesia was induced with pentobarbital sodium (0.2 mmol/kg ip; Abbott Laboratories).
Gene Expression
RNA was isolated from renal pelvises and T9–L1 DRG dissected from anaesthetized rats fed HNa (n = 8) and LNa diet (n = 8) using the RNAqueous-4PCR kit (Ambion, Huntingdon, UK). Concentration and purity of RNA were determined spectrophotometrically using absorbance at 260 nm and the A260/280 ratio, respectively. No relevant contamination with proteins was present in the samples as shown by an A260/280 ratio higher than 1.9. Reverse transcription was performed with ∼150 ng RNA per reaction and random hexamer primers using the High-Capacity cDNA Reverse Transcription Kit (Applied Biosystems, Foster City, CA). Expression levels were determined by TaqMan real-time PCR performed with ready-to-use TaqMan Universal PCR Master Mix (Applied Biosystems, Foster City, CA) using cDNA corresponding to 3 ng RNA as template and the GeneAmp 5700 Sequence Detection System (Applied Biosystems, Foster City, CA). Design of synthetic oligonucleotide primers and fluorescent probes for ETA-R, ETB-R, and porphobilinogen deaminase (PBGD) were identical to those used previously (48). Furthermore, we included tyrosine 3-monooxygenase/tryptophan 5-monooxygenase activation protein, zeta polypeptide (Ywhaz) using the following primers and probe: forward primer: 5′-CATCTGCAACGACGTACTGTCTCT-3′; probe: 5′-ACTACTACCGCTACTTGGCTGAGGTTGCTG-3′; reverse primer: 5′-GACTGGTCCACAATTCCTTTCTTG-3′. The forward primer spans nucleotides 337 through 360, the probe, nucleotides 432 through 461, and the reverse primer, nucleotides 472 through 495. The PCR included a 10-min activation of the DNA polymerase at 95°C, 40 cycles at 95°C for 15 s for denaturation, and 1 min at 60°C for annealing and extension. PCRs were performed in triplicate. In each experimental plate a no-template control was included to check for any contamination affecting the PCR.
The fluorescence raw data from kinetic PCR were analyzed using Data Analysis for Real-Time PCR [DART-PCR Version 1.0; (42) http://directory.gene-quantification.info/], which allows comparison of DNA amplification efficiency among experimental groups as a prerequisite for quantitative analysis of PCR data. The relative content of mRNA was determined using the geometric mean of the content of PBGD and Ywhaz as endogenous references for normalization.
Western Blot Analysis
Western blot analysis was performed as previously described (49). In short, homogenized renal pelvic and DRG tissues from 8 HNa and 8 LNa diet rats were centrifuged at 100,000 g for 1 h at 4°C. The pellets (membrane fractions) were resuspended and stored at −70°C until Western blot analysis. Total protein concentration was determined by the Biuret reaction (Biorad, München, Germany) using BSA as a standard. Then 25–50 μg protein of DRG tissue and 100 μg protein of pelvic wall tissue were electrophoretically separated on a 10% SDS polyacrylamide gel with a 5% stacking gel and transferred to nitrocellulose (0.2 μm; Schleicher and Schuell/BioSciences, Dassel, Germany). The membrane fractions were blocked with nonfat milk powder and incubated for 18 h at 4°C with antiserum against ETB-R or ETA-R (rabbit; 1: 200; Alomone Labs, Jerusalem, Israel) followed by incubation with peroxidase-labeled goat anti-rabbit (1:10,000; Biorad, München, Germany). Specificity of the antisera was verified by incubating the antisera against the ET-R with excess immunizing peptide. To ascertain an adequate amount of protein, renal pelvic and DRG tissues from two rats were combined for the Western blot analysis resulting in n = 4 from each group of 8 rats.
Immunoreactive bands were detected by using an enhanced chemiluminescence kit (ECL Plus; Amersham Pharmacia Biotech). After being developed, the films were scanned and the bands quantified by densitometry (Gelscan Standard V5.02; BioSciTec). Actin was used as loading control. The data represent the average of 3–5 assays per tissue and rat.
Immunohistochemistry
The immunohistochemical procedures for kidney and DRG tissue have been previously described in detail (28, 29). In brief, anesthetized male Sprague-Dawley rats were transcardially perfused with calcium-free Tyrode solution followed by phosphate buffer, and the kidneys were dissected out and stored in 10% sucrose at 4°C. Sections (14-μm thick) were cut on a cryostat, thaw-mounted onto gelatin-coated slides, and fixed in ice-cold acetone. All primary antibodies were incubated for 24 h at 4°C.
ETB-R.
The sections were incubated with antisera against glial fibrillary acidic protein (GFAP, mouse; 1:1,000; Neuromics, Edina, MN), a marker for satellite cells in DRG and unmyelinated ensheathing Schwann cells in the peripheral nervous system (16) or calcitonin gene-related peptide (CGRP; mouse; 1: 8,000; Drs. J. H. Walsh and H. C. Wong), a marker for sensory nerves. Immunoreactivity was visualized using the tyramide signal amplification system (TSA-Plus; PerkinElmer Life and Analytical Sciences, Waltham, MA). After completion of the protocol for TSA for detection of GFAP or CGRP, the tissue sections were incubated with antiserum for ETB-R (rabbit; 1:100, Alomone Labs) and processed by the indirect immunofluorescence technique. In double-labeling studies with antisera against ETB-R and α-smooth muscle actin (αSMA, mouse, 1:400; Sigma-Aldrich, St Louis, MO), a mixture of the two primary antisera was applied to the tissue sections and processed by the indirect immunofluorescence technique.
ETA-R.
The sections were incubated with antiserum against ETA-R (rabbit; 1:10,000, Alomone Labs). Immunoreactivity was visualized using TSA-Plus. After completion of the protocol for TSA for detection of ETA-R, antiserum for CGRP (mouse; 1:400) or αSMA was applied, and the tissue sections processed by the indirect immunofluorescence technique.
The specificity of the antisera for ETB-R and ETA-R was tested by preincubation of the primary antisera with an excess amount of the fusion protein used as immunogen, the concentration of the immunogen being 100 μg/ml.
The tissue sections were examined using a Nikon Eclipse E600 fluorescence microscope (Tokyo, Japan) equipped with epifluorescence with the appropriate filter combinations. Photographs were taken with a Hamamatsu ORCA-ER C4762–80 digital camera (Hamamatsu City, Japan) using Hamatsu photonics Wasabi software. For confocal analysis a Radiance Plus confocal laser scanning system (Bio-Rad, Hemel Hemstead, UK) installed on a Nikon Eclipse E600 fluorescence microscope was used. Digital images from the microscopy were optimized for image resolution brightness and contrast, and color images were merged using Adobe Photoshop 7.0 (Adobe Systems, San Jose, CA).
In Vivo Studies
After induction of anesthesia (see above), an intravenous infusion of pentobarbital sodium (0.04 mmol·kg−1·h−1) at 50 μl/min into the femoral vein was started and maintained throughout the course of the experiment. Arterial pressure was recorded from a catheter in the femoral artery. The left renal pelvis was perfused with vehicle or various perfusates, described below, throughout the experiment at 20 μl/min via a polyethelene (PE)-10 catheter placed inside a PE-60 catheter located in the left ureter. A PE-10 catheter was placed in the right ureter for collection of urine. ERSNA and ARNA were recorded from the central and peripheral portions, respectively, of the cut ends of two adjacent left renal nerve branches, which were placed on bipolar silver wire electrodes. ERSNA and ARNA were integrated over 1-s intervals, the unit of measure being microvolts per second per one second. All data were collected at 500 Hz and averaged over 2 s. Postmortem renal nerve activity, assessed by crushing the renal nerve bundles central or peripheral to the recording electrode, was subtracted from all values of ERSNA and ARNA, respectively. Renal nerve activity was expressed in percentage of its baseline value during the control period (21–33).
Stimulation of renal sensory nerves.
Renal sensory nerves were stimulated by reflex-mediated increases in ERSNA, which were produced by placing the rat's tail in warm water (29). The threshold for activation of thermal cutaneous stimulation was 49°C in rats fed the NNa and LNa diets and 47°C in rats fed the HNa diet. Because pilot studies showed poor reproducibility of the ERSNA responses to thermal cutaneous stimulation at 49°C in rats fed HNa diet, subsequent studies used a water temperature of 47°C in these rats.
Because our previous studies have shown that increases in ERSNA modulate ARNA by a release of NE, we also examined whether dietary sodium modulated the ARNA responses to renal pelvic perfusion with NE. The renal pelvis was perfused with NE at 2 and 10 pM in rats fed the HNa (n = 11) and NNa (n = 8) diets and 10, 50, and 250 pM in rats fed the LNa diet (n = 11).
In all experimental groups, a 10-min control and a 10-min recovery period bracketed the experimental period.
HNa diet: effects of an ETB-R antagonist on the ARNA responses to reflex increases in ERSNA.
The experiments performed in HNa diet rats were divided into two parts. During each part, the rat's tail was placed in 47°C water during two 3-min experimental periods. Following each experimental period, the rat's tail was immediately placed in room temperature water to quickly terminate the heat stimulation. Twenty minutes after the end of the first part, the renal pelvic perfusate was switched from vehicle to the ETB-R antagonist BQ788 (13) at 1 μM (n = 14). Ten minutes later, the control, experimental, and recovery periods were repeated. Time control experiments (n = 7) were performed similarly except that the renal pelvis was perfused with vehicle throughout the experiment.
LNa diet: effects of an ETA-R antagonist on the ARNA responses to reflex increases in ERSNA.
The experiments performed in LNa diet rats used a similar protocol as above, except the rat's tail was placed in 49°C water. The ETA-R antagonist BQ123 (12) at 5 μM was administered during the second part of the experiment (n = 14). Time control experiments (n = 8) were performed similarly, except the renal pelvis was perfused with vehicle throughout the experiment.
NNa diet: effects of an ETB-R or ETA-R antagonist on the ARNA responses to reflex increases in ERSNA.
The experiments performed in NNa diet rats used a protocol similar to that above. BQ788 and BQ123 were administered during the second part of the experiments in two separate groups of rats, each n = 10.
In vitro Studies
Stimulation of renal sensory nerves in an isolated renal pelvic wall preparation.
Because ET-1 and ET-3 have been shown to modulate the release of NE by presynaptic mechanisms (39, 41, 52), further studies were undertaken in an isolated renal pelvic wall preparation to examine whether the effects of the ET-R antagonists on renal sensory nerve activation involved a mechanism(s) at the peripheral sensory nerve endings, the isolated renal pelvic preparation by design being sympathetically denervated. NE was added to the incubation bath containing isolated renal pelvises from rats fed HNa, NNa, or LNa diet and the release of substance P and PGE2 were measured.
The isolated renal pelvic wall preparation has previously been described in detail (21–30). In brief, following anesthesia, renal pelvises dissected from the kidneys were placed in wells containing 400 μl HEPES buffer maintained at 37°C. Each well contained the pelvic wall from one kidney. Throughout the experiment, the incubation medium was replaced with fresh HEPES every 5 min. The incubation medium was collected in siliconized vials and stored at −80°C for later analysis of substance P and PGE2. After a 2-h equilibration period, the experiment was started with four 5-min control periods followed by one 5-min experimental period and four 5-min recovery periods. NE was added to the incubation bath to both pelvises during the experimental periods.
In our initial studies, we examined whether dietary sodium modulated the release of substance P and PGE2 produced by NE at 250 pM, the threshold concentration required to activate renal sensory nerves in isolated renal pelvises from NNa diet rats (29).
HNa diet: effects of an ETB-R antagonist on the NE-induced release of substance P and PGE2.
Initial experiments were performed to determine the threshold concentration of NE required to increase the release of substance P. Both pelvises were incubated in HEPES buffer as described above. During the experimental period, one pelvis was exposed to 2 pM NE and the other to 10 pM NE (n = 9). In subsequent experiments examining the effects of BQ788 (n = 12), both pelvises were exposed to 10 pM NE during the experimental period. In these experiments, one pelvis was incubated in HEPES buffer and the other pelvis in HEPES buffer containing 1 μM BQ788 throughout the control, experimental, and recovery periods. Renal pelvic release of substance P and PGE2 into the incubation bath was measured throughout the experiment.
LNa diet: effects of an ETA-R antagonist on the NE-induced release of substance P and PGE2.
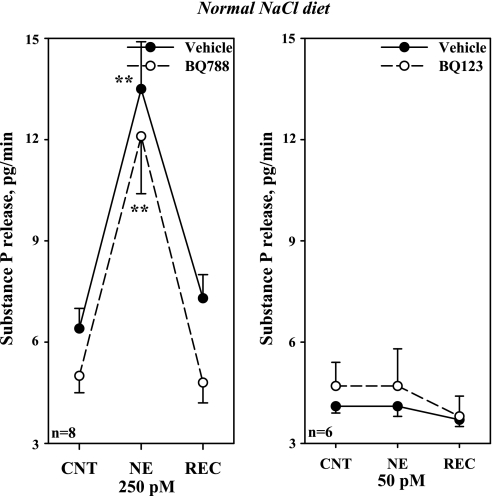
One pelvis was incubated in HEPES buffer and the other pelvis in HEPES buffer containing 1 μM BQ123 throughout the control, experimental, and recovery periods. During the experimental period, both pelvises were exposed to NE at 1,250 pM (n = 12) or 6,250 pM (n = 10). Because our previous studies in NNa diet rats showed that PGE2 facilitated the NE-mediated release of substance P (29), further studies were performed to examine whether addition of PGE2 at a subthreshold concentration for substance P release, 0.03 μM (25), would alter the substance P release by 50 pM NE, in the absence or presence of 1 μM BQ123.
NNa diet; effects of an ETB-R or ETA-R antagonist on the NE-induced release of substance P.
One pelvis was incubated in HEPES buffer and the other pelvis in HEPES buffer containing 1 μM BQ123 (n = 6) or 1 μM BQ788 (n = 8) throughout the control, experimental and recovery periods. During the experimental period, both pelvises were exposed to 250 pM NE.
Renal pelvic contractions: myography.
Because our immunohistochemical studies suggested the presence of ETA-R on smooth muscle cells in the renal pelvic wall, we examined whether ET-1 induced pelvic wall contractions and if so, whether pretreatment with BQ123 modified the ET-1 induced contractions. Renal pelvises from 5 NNa diet rats were mounted in a small vessel wire myograph (model 410A; Danish Myotechnology, Aarhus, Denmark) on two stainless steel wires with diameters of 40 μm and were stretched until rhythmic contractions were observed. Tissues were equilibrated for 45–60 min. The incubation medium (118.5 mM NaCl, 4.7 mM KCl, 1.2 mM MgSO4, 1.2 mM KH2PO4, 25 mM NaHCO3, 2.5 mM CaCl2, 5.6 mM glucose, pH 7.4. fluid) was replaced every 15 min with fresh solution. At steady state, ET-1 (1–300 nM) was added to the incubation bath in a cumulative manner at 6-min intervals with and without the addition of 10 μM BQ123.
Drugs
Substance P antibody (IHC 7451) was acquired from Peninsula Laboratories (San Carlos, CA) and PGE2 from Cayman Chemicals (Ann Arbor, MI). All other reagents/chemicals were from Sigma Aldrich (St. Louis, MO) unless otherwise stated. NE was dissolved in 0.1% ascorbic acid in incubation buffer or 0.15 M NaCl. All other agents were dissolved in incubation buffer (in vitro studies) or 0.15 M NaCl (in vivo studies).
Analytical Procedures
Substance P and PGE2 in the incubation medium was measured by ELISA, as previously described in detail (21–30).
Statistical Analysis
In vivo.
Increases in ERSNA, ARNA, and mean arterial pressure (MAP) produced by placing the tail in warm water were evaluated by calculating the area under the curve of each parameter vs. time, with baseline being the average value of each control period. Likewise, the ARNA responses to NE were calculated as the area under the curve of ARNA vs. time. D'Agostino and Pearson omnibus normality tests were used to determine whether the data were normally distributed. Normally distributed data were analyzed using Student's unpaired t-test, one- or two-way ANOVA for repeated measurements followed by Bonferroni correction for multiple comparisons. Data, which were not normally distributed were analyzed using Wilcoxon signed-rank test, Friedman one-way ANOVA with repeated measures or Kruskal-Wallis one-way ANOVA, each followed by Dunn's multiple comparison test (50). A significance level of 5% was chosen. Data in text and figures are expressed as means ± SE.
RESULTS
Gene and Protein Expression of ETB-R and ETA-R
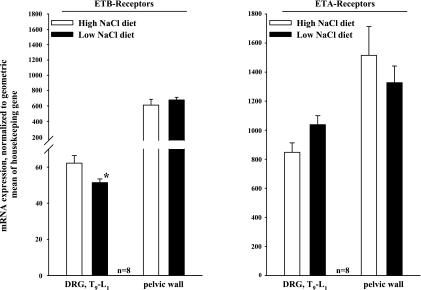
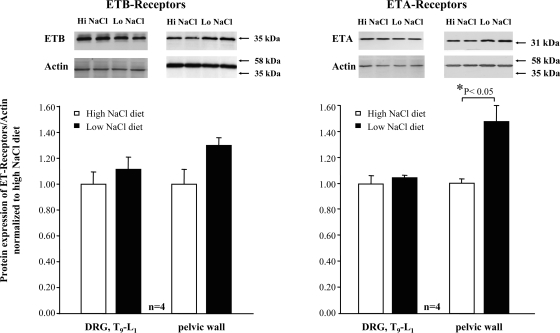
In the renal pelvic wall, there was no difference in gene expression of ETA-R or ETB-R in rats fed HNa or LNa diet (Fig. 1). In T9–L1 DRG, gene expression of ETB-R was slightly higher in rats fed the HNa diet than in rats fed the LNa diet (P < 0.05). Gene expression of ETA-R was similar in the two groups. In renal pelvic tissue, protein expression of ETA-R was lower from rats fed the HNa diet than in rats fed the LNa diet (P < 0.05). Protein expression of ETB-R was similar in the two groups. In T9–L1 DRG, protein expression of ETA-R and ETB-R was similar in rats fed HNa and LNa diet (Fig. 2).
Fig. 1.
mRNA expression of endothelin B-receptor (ETB-R; left) and ETA-R (right) in T9–L1 dorsal root ganglia (DRG) and renal pelvic wall from rats fed the high-sodium (HNa) and low-sodium (LNa) diet. mRNA of ET-R was normalized to the geometric mean of two housekeeping genes, porphobilinogen deaminase (PBGD) and tyrosine 3-monooxygenase/tryptophan 5-monooxygenase activation protein zeta polypeptide (Ywhaz). *P < 0.05 LNa vs. HNa diet.
Fig. 2.
Protein expression of ETB-R (left) and ETA-R (right) in T9–L1 DRG and renal pelvic wall from rats fed the HNa and LNa diet. The ratio of ET-R/actin protein expression was normalized to the average value of the ratio in HNa diet rats. *P < 0.05 LNa vs. HNa diet.
Immunohistochemistry
Localization of ETB-R and ETA-R in renal pelvic and DRG tissue.
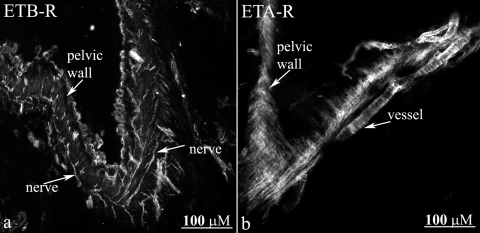
Strong labeling with the antibodies against ETB-R and ETA-R was observed in the renal pelvic wall (Fig. 3, a and b). However, the two antibodies labeled different structures. Whereas, the ETB-R antibody appeared to label nerve fibers (Fig. 3a), the ETA-R antibody appeared to label smooth muscle cells in the pelvic wall and adjacent blood vessels (Fig. 3b). To test this hypothesis we double labeled the sections with antibodies against the ET-R, αSMA, and CGRP.
Fig. 3.
Immunofluorescence for ETB-R (a) in renal pelvic tissue shows nerve fiber-like structures (arrows) among smooth muscle cells. ETA-R-LI is present on smooth muscle cells in the renal pelvic wall and adjacent blood vessels (arrows, b).
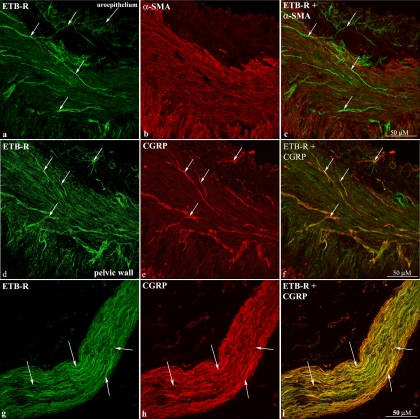
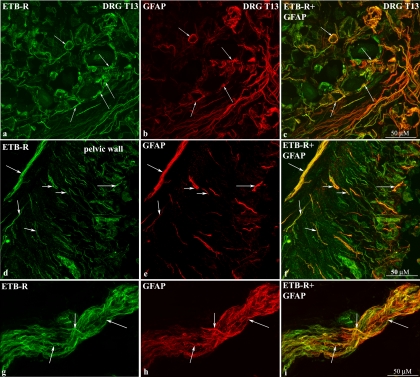
As shown in Fig. 4, a–c and d–f, the ETB-R antibody labeled fiber-like structures running among smooth muscle fibers in the renal pelvic wall that were close to CGRP-immunoreactive (ir) fibers (Fig. 4, d–f). Also, ETB-R-like immunoreactivity (LI) was seen within the uroepithelium. The close localization of the ETB-R-ir structures to the CGRP-ir fibers was further observed in nerve bundles in the renal pelvic area (Fig. 4, g–i). Because these studies suggested that ETB-R were located on or close to CGRP-ir nerve fibers, DRG T9–L1 were labeled with the ETB-R antibody. The ETB-R antibody did not label cell bodies in the DRG but rather satellite cells surrounding the cell bodies as shown by the colocalization of ETB-R-ir and GFAP-ir (Fig. 5, a–c). Because peripheral supporting cells, i.e., unmyelinated ensheathing Schwann cells, can be identified by the GFAP antibody (16), we also double-labeled renal tissue sections with antibodies against ETB-R and GFAP. As shown in Figs. 5, d–f, the majority of the ETB-ir structures were colocalized with GFAP-ir structures. This is further shown in nerve bundles in the pelvic area (Fig. 5, g–i).
Fig. 4.
Immunofluorescence double-labeling of renal pelvic tissue shows ETB-R-ir fiber-like structures among smooth muscle cells (a–c) close to calcitonin gene-related peptide-immunoreactive (CGRP-ir) sensory nerve fibers (d–f). αSMA, α-smooth muscle actin. Likewise, ETB-R -ir and CGRP-ir fibers are overlapping in a nerve bundle close to the renal pelvic wall (g–i).
Fig. 5.
Immunofluorescence double-labeling of T13 DRG shows colocalization of ETB-R-like immunoreactivity (ETB-R-LI) with glial fibrillary acidic protein (GFAP)-LI (arrows) surrounding neuronal cell bodies (a–c). Also, many ETB-R-ir fiber-like structures are colocalized with GFAP-ir structures the renal pelvic wall (d–f) and in a nerve bundle close to the renal pelvic wall (g–i) (arrows).
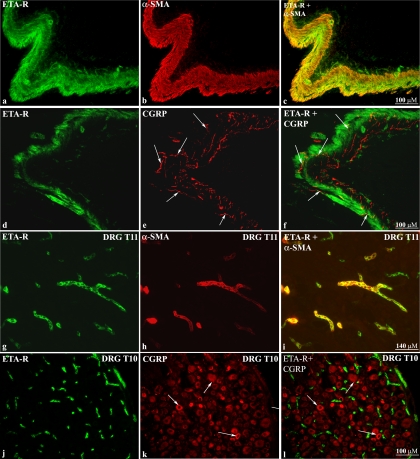
Double-labeling kidney and DRG T9–L1 tissue sections with antibodies against ETA-R, αSMA, and/or CGRP showed that the ETA-R-LI colocalized with αSMA-ir cells (Fig. 6, a–c) but not with CGRP-ir fibers in the pelvic wall (Fig. 6, d–f). The CGRP-ir nerve fibers ran among the ETA-R-ir smooth muscle cells (Fig. 6f). Likewise, in DRG T9–L1, the ETA-R antibody labeled smooth muscle cells in vessels (Fig. 6, g–i) found among the CGRP-ir neural cell bodies (Fig. 6, j–l). The presence of ETA-R on pelvic smooth muscle cells was functionally confirmed by the marked reduction produced by the ETA-R antagonist BQ123 of the ET-1-induced renal pelvic contractions (see Supplemental figure S1 posted with the online publication of this article.).
Fig. 6.
Immunofluorescence double-labeling of renal pelvic tissue shows ETA-R-ir on smooth muscle cells (a–c). CGRP-ir sensory nerve fibers (arrows) are found among the ETA-R-ir smooth muscle cells (d–f). In T11 DRG (g–i) and T10 DRG (j–l) ETA-R-LI was found on smooth muscle cells in vessels distributed among CGRP-ir neuronal cell bodies (arrows).
Similarly to previously reports (54, 58, 59) the ETB-R antibody produced marked labeling of endothelial cells in the glomeruli, endothelial cells, and some smooth muscle cells in blood vessels, including efferent and afferent arterioles and inner medullary collecting duct cells. The ETA-R antibody labeled smooth muscle cells in blood vessels throughout the kidney, including afferent and efferent arterioles and vasa recta (data not shown).
All ETB-R and ETA-R labeling in the kidney and DRG sections was blocked by adsorption with the peptide used as immunogen for the generation of the ETB-R and ETA-R antibody, respectively (Please see Fig. S2, online).
In Vivo
Effects of dietary sodium on the reflex responses to thermal cutaneous stimulation.
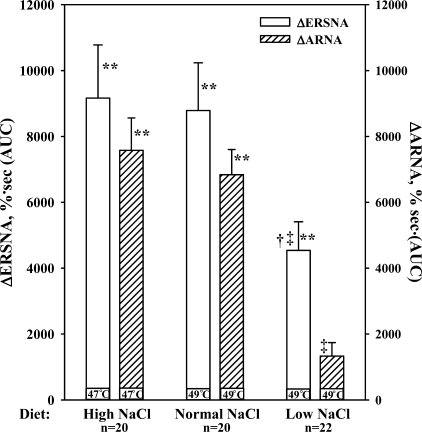
To evaluate the effects of dietary sodium on the responses to thermal cutaneous stimulation, the first responses in the time control groups and the groups subsequently treated with either BQ788 or BQ123 were pooled in each diet group. As shown in Fig. 7 and Table 1, the increases in ERSNA, ARNA, and MAP were suppressed in rats fed LNa diet compared with those in rats fed NNa or HNa diet (P < 0.01). Thermal cutaneous stimulation increased contralateral urinary sodium excretion in all three groups: HNa diet, 45 ± 8% from 1.5 ± 0.2 μmol·min−1·g−1 (P < 0.01); NNa diet, 32 ± 9% from 1.1 ± 0.2 μmol·min−1·g−1 (P < 0.02); and LNa diet, 35 ± 9% from 0.5 ± 0.2 μmol·min−1·g−1 (P < 0.01).
Fig. 7.
In vivo, effects of placing the rat's tail in water at 47°C or 49°C (thermal cutaneous stimulation) on ERSNA and ARNA in rats fed the HNa, NNa, and LNa diet. **P < 0.01 vs. baseline; †P < 0.05, ‡P < 0.01, responses in LNa vs. NNa and HNa diet, respectively. ΔERSNA, efferent renal sympathetic nerve activity response; ΔARNA, afferent renal nerve activity response; AUC, area under the curve of RNA vs. time.
Table 1.
Effects of thermal cutaneous stimulation on mean arterial pressure (MAP) in rats fed high-, normal, and low-sodium diet during vehicle administration
| High-NaCl diet, n = 20 | Normal NaCl diet, n = 20 | Low-NaCl diet, n = 22 | |
|---|---|---|---|
| ΔMAP, mmHg·s | 4470±550* | 4080±20* | 2280±300*†‡ |
ΔMAP responses expressed as area under the curve of MAP vs. time;
P < 0.01 vs. baseline;
P < 0.05 vs. normal sodium diet,
P < 0.01 vs. high-sodium diet.
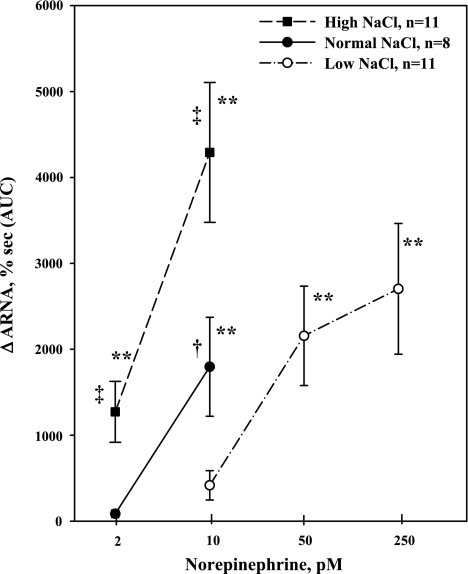
To examine whether the suppressed ARNA responses in LNa diet rats were related to the smaller increases in ERSNA produced by thermal cutaneous stimulation in these rats, we examined whether dietary sodium modulated the ARNA responses to NE administered directly into the renal pelvis. NE caused a dose-dependent increase in ARNA in all rats. The threshold concentration required to increase ARNA was dependent on the Na diet, being 2 pM in HNa diet rats, 10 pM in NNa diet rats, and 50 pM in LNa diet rats (Fig. 8). The ARNA responses to 2 pM NE in HNa diet rats were greater than those produced in NNa diet rats (P < 0.01). Also, the ARNA responses to 10 pM NE in HNa diet rats were greater than those produced in NNa (P < 0.05) and LNa (P < 0.01) diet rats. Contralateral urinary sodium excretion was increased by 2 and 10 pM NE in HNa diet rats [24 ± 8% from 1.3 ± 0.3 μmol·min−1·g−1 (P < 0.05) and 34 ± 7% from 1.5 ± 0.3 μmol·min−1·g−1 (P < 0.01), respectively] and by 10 pM NE in NNa diet rats [21 ± 5% from 1.0 ± 0.1 μmol·min−1·g−1 (P < 0.05)]. Contralateral urinary sodium excretion was not altered by NE in LNa diet rats, which may be related to the low baseline level, 0.11 μmol·min−1·g−1. Importantly, MAP was not affected by renal pelvic administration of NE in any of the groups. Basal MAP was 106 ± 4, 115 ± 4, and 109 ± 5 mmHg in rats fed HNa, NNa, and LNa diet, respectively.
Fig. 8.
In vivo, effects of renal pelvic administration of norepinephrine (NE) at increasing concentrations on ARNA in rats fed the HNa, NNa, and LNa diet. **P < 0.01 vs. baseline; ‡P < 0.01, ARNA responses to 2 pM NE in rats fed HNa vs. NNa diet and ARNA responses to 10 pM NE in rats fed HNa vs. LNa diet. †P < 0.05, ARNA responses to 10 pM NE in rats fed HNa vs. NNa diet.
HNa diet, in vivo: effects of an ETB-R antagonist on the ARNA responses to reflex increases in ERSNA.
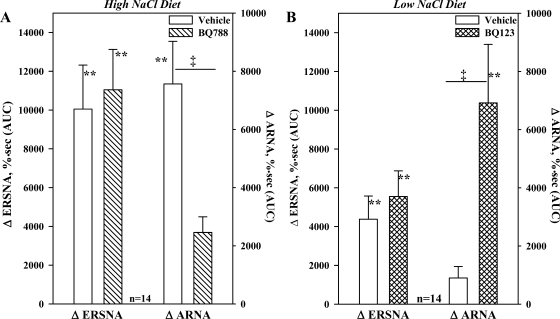
The results depicted in Figs. 7 and 8 suggested that the responsiveness of the renal sensory nerves to NE and reflex increases in ERSNA are modulated by dietary sodium. Because of our previous studies (24), we hypothesized that blocking the renal pelvic ETB-R may modulate the ARNA responses to reflex increases in ERSNA. As shown in Fig. 9A, renal pelvic perfusion with BQ788 reduced the increases in ARNA produced by placing the rat's tail in 47°C water (P < 0.01) without affecting the increases in ERSNA or MAP, 4,700 ± 650 vs. 3,700 ± 450 mmHg·s (not significant).
Fig. 9.
A: in vivo, effects of renal pelvic administration of the ETB-R antagonist BQ788 on the ERSNA and ARNA responses to placing the rat's tail in 47°C water in rats fed HNa diet. B: effects of renal pelvic administration of the ETA-R antagonist BQ123 on the ERSNA and ARNA responses to placing the rat's tail in 49°C water in rats fed LNa diet. **P < 0.01 vs. baseline; ‡P < 0.01, ARNA responses to thermal cutaneous stimulation in the absence and presence of renal pelvic perfusion with BQ788 (A) and BQ123 (B).
In time control experiments the second ARNA and ERSNA responses to thermal cutaneous stimulation were greater than those produced by the first stimulation (P < 0.05). No differences were seen in the two MAP responses (Table 2).
Table 2.
Effects of repeated thermal cutaneous stimulation in rats fed high- or low-sodium diet in the presence of vehicle, time control
|
High-NaCl Diet, n = 7 |
Low-NaCl Diet, n = 8
|
|||
|---|---|---|---|---|
| Vehicle 1 | Vehicle 2 | Vehicle 1 | Vehicle 2 | |
| ΔARNA, %·s | 6750±430a | 11840±3080b,c | 2170±900d | 2140±1050a,e |
| ΔERSNA, %·s | 6450±890b | 11060±1770b,c | 4810±1260b | 4138±1680b,d |
| ΔMAP, mmHg·s | 4040±1050b | 3950±840a | 1386±204b,d | 1060±220e |
ΔARNA, ΔERSNA, and ΔMAP responses expressed as area under the curve of ARNA, ERSNA, or MAP vs. time;
P < 0.05 and
P < 0.01, respectively, vs. baseline;
P < 0.05, high-sodium diet: vehicle-1 vs. vehicle −2 responses;
P < 0.05 and
P < 0.01 vehicle-1 or vehicle-2 responses in low vs. high-sodium diet rats.
LNa diet, in vivo: effects of an ETA-R antagonist on the ARNA responses to reflex increases in ERSNA.
Because of the results of our previous studies (24), we tested the notion that activation of ETA-R might contribute to the suppressed ARNA response to reflex increases in ERSNA. Renal pelvic administration of BQ123 enhanced the ARNA response to thermal cutaneous stimulation to a value similar to that seen in vehicle-treated HNa diet rats (Fig. 9). BQ123 had no effect on the suppressed ERSNA and MAP responses, 2,800 ± 3,390 vs. 2,900 ± 470 mmHg·s.
Repeated placement of the rat's tail in 49°C water in the presence of vehicle (time control) resulted in reproducible increases in ERSNA, ARNA, and MAP (Table 2).
NNa diet, in vivo: effects of an ETB-R or ETA-R antagonist on the ARNA responses to reflex increases in ERSNA.
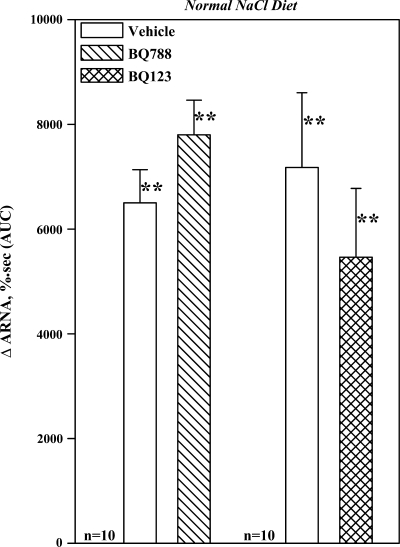
In contrast to our findings in rats fed HNa or LNa diet, renal pelvic administration of BQ788 or BQ123 had no effect on the ARNA responses to thermal cutaneous stimulation in rats fed NNa diet (Fig. 10). Likewise, the increases in ERSNA, 9,150 ± 2,610 and 8.400 ± 1,430%·s and MAP, 3,060 ± 520 and 5,100 ± 760 mmHg·s, produced by thermal cutaneous stimulation in the two groups were unaltered by BQ788 and BQ123.
Fig. 10.
In vivo, effects of renal pelvic perfusion with BQ788 and BQ123 on the ARNA responses to placing the rat's tail in 49°C water. **P < 0.01 vs. baseline.
In Vitro
Effects of dietary sodium on the norepinephrine-induced release of substance P and PGE2.
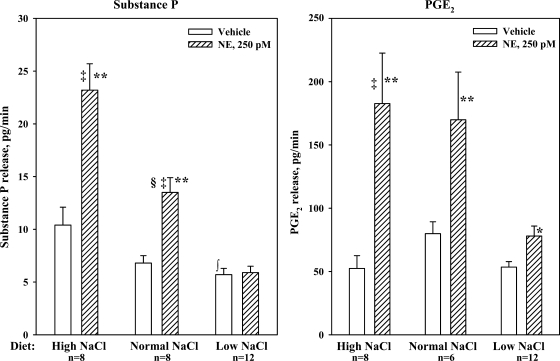
Baseline substance P release from renal pelvises from HNa diet rats was greater than that from LNa diet rats (P < 0.01) (Fig. 11). Adding 250 pM NE to the bath resulted in a reversible release of substance P from renal pelvises from HNa and NNa diet rats (P < 0.01). The NE-mediated release of substance P from HNa diet pelvises was greater than that from NNa diet pelvises (P < 0.01). The NE-mediated increases in substance P release were associated with increases in renal pelvic release of PGE2. In contrast, 250 pM NE failed to increase PGE2 and substance P release from renal pelvises from LNa diet rats.
Fig. 11.
In vitro, effects of 250 pM NE on the release of substance P (left) and PGE2 (right) from isolated renal pelvic wall preparations from rats fed HNa, NNa, and LNa diet. **P < 0.01 vs. baseline; ‡P < 0.01, NE-induced release of substance P and PGE2 from renal pelvises derived from HNa and NNa diet rats vs. LNa diet rats; §P < 0.01 NE-induced substance P release from renal pelvises from rats fed NNa vs. HNa diet rats; ∫P < 0.01, baseline substance P release from renal pelvises from LNa vs. HNa diet rats.
HNa diet, in vitro: effects of an ETB-R antagonist on the NE-induced release of substance P and PGE2.
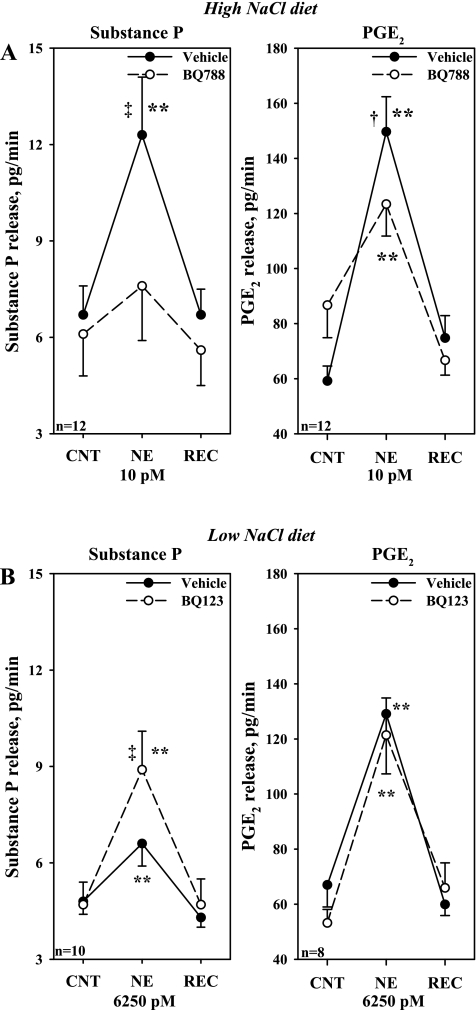
Next we examined whether lower concentrations of NE would increase substance P and PGE2 in HNa diet rats. Whereas 2 pM failed to increase substance P release, 8.1 ± 1.3 to 9.4 ± 1.6 pg/min, 10 pM NE resulted in a reversible increase in the release of substance P, from 8.1 ± 1.5 to 14.7 ± 2.8 pg/min and PGE2, from 57 ± 4 to 144 ± 16 pg/min, both P < 0.01. Subsequent studies showed that adding BQ788 to the incubation bath reduced both the increases in substance P and PGE2 produced by 10 pM NE (Fig. 12A).
Fig. 12.
A: in vitro, effects of BQ788 on the release of substance P and PGE2 produced by 10 pM NE in isolated renal pelvic wall preparations from rats fed the HNa diet. B: effects of BQ123 on the release of substance P and PGE2 produced by 6,250 pM NE in isolated renal pelvic wall preparations from rats fed the LNa diet. **P < 0.01, vs. baseline; † P < 0.05, NE-induced PGE2 release in the presence of vehicle vs. BQ788; ‡ P < 0.01 NE-induced substance P release in the presence of vehicle vs. BQ788 (A) and BQ123 (B). CNT, control; REC, recovery.
LNa diet, in vitro: effects of an ETA-R antagonist on the NE-induced release of substance P and PGE2.
Because 250 pM NE failed to increase substance P release in rats fed LNa diet, we tested whether higher concentrations of NE would increase substance P release in the absence or presence of BQ123. Adding 1,250 pM NE to the bath did not increase substance P release in the absence or presence of BQ123 in the bath (Table 3). Adding 6,250 pM NE to the bath resulted in a small increase in substance P release, which was enhanced by BQ123 in the bath (Fig. 12B). However, BQ123 had no effect on the NE-mediated increase in PGE2 release (Fig. 12B). Adding 0.03 μM PGE2 to the bath lowered the NE concentration required to increase substance P release from 6,250 to 50 pM, but only in the presence of BQ123 (Table 4).
Table 3.
Effects of norepinephrine 1250 pM on substance P and PGE2 release from isolated renal pelvic wall preparations derived from from low sodium diet rats
|
Substance P, pg/min |
PGE2, pg/min
|
|||||
|---|---|---|---|---|---|---|
| Control | NE, 1,250 pM | Recovery | Control | NE, 1,250 pM | Recovery | |
| Vehicle | 5.4±0.6 | 5.0±0.7 | 4.4±0.6 | 65.4±5.0 | 100.8±10.5* | 66.2±5.5 |
| BQ123 | 5.7±0.9 | 6.2±0.6 | 4.4±0.7 | 62.3±8.1 | 107.0±15.3* | 62.1±7.9 |
P < 0.01 vs. average of control and recovery.
Table 4.
Effects of 1 μM BQ123 on the release of substance P produced by 50 pM norepinephrine in isolated renal pelvic wall preparations derived from low-sodium diet rats
| Control | Norepinephrine, 50 pM | Recovery | |
|---|---|---|---|
| Vehicle+PGE2 | 8.1±1.1 | 8.9±1.3 | 7.1±0.9 |
| BQ123+PGE2 | 7.9±1.0 | 15.5±2.2*† | 7.1±1.2 |
PGE2 (0.03 μM) was present throughout the experiment; n =13 rats,
P < 0.01 increase in substance P release produced by NE in the presence of BQ123 vs. vehicle;
P < 0.01 vs. average of control and recovery.
NNa, in vitro: effects of an ETB-R and ETA-R antagonist on the NE-induced release of substance P and PGE2.
Similar to our in vivo studies in NNa diet rats (Fig. 10), adding BQ788 or BQ123 had no effect on the release of substance P produced by NE from renal pelvises derived from rats fed NNa diet (Fig. 13).
Fig. 13.
In vitro, effects of BQ788 and BQ123 on the release of substance P produced by NE, 250 pM (left) and 50 pM (right), respectively, in NNa diet rats. **P < 0.01 vs. baseline.
DISCUSSION
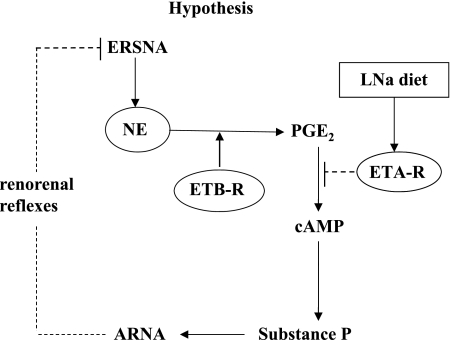
Increases in ERSNA increase ARNA, which in turn provides a powerful negative feedback control of ERSNA in the overall goal of maintaining low ERSNA to limit sodium retention (29) (Fig. 14). The present study shows that the ERSNA-ARNA interaction is modulated dietary sodium. The increases in ARNA produced by reflex increases in ERSNA are enhanced by HNa diet and suppressed by LNa diet by a mechanism(s) involving PGE2-dependent release of NE. Furthermore, our data suggest a role for ET in the modulation of the ERSNA-ARNA interaction produced by dietary sodium. In the renal pelvic wall, ETA-R-LI was found on smooth cells and ETB-R-ir fibers close to sensory nerve fibers. The ARNA responses to reflex increases in ERSNA were suppressed by renal pelvic administration of an ETB-R antagonist in HNa diet and enhanced by an ETA-R antagonist in LNa diet rats. Our data suggest that activation of ETB-R on or close to the sensory nerves in the renal pelvic wall contributes to the enhanced interaction between ERSNA and ARNA in HNa diet rats. Conversely, activation of ETA-R on smooth muscle cells in the renal pelvic wall contributes to the reduced interaction between ERSNA and ARNA in LNa diet rats. The differential effect of ET-1 on ETB-R and ETA-R in conditions of HNa and LNa diet may, at least in part, be related to increased ETA-R protein expression in LNa diet rats (Fig. 14).
Fig. 14.
Our studies suggest that ERSNA-induced increases in NE release lead to an increase in renal pelvic PGE2 synthesis/release. In conditions of HNa dietary intake, activation of ETB-R on or close to unmyelinated Schwann cells surrounding the sensory nerves in the renal pelvic wall facilitates/enhances the synthesis/release of PGE2 leading to enhanced release of substance P and increases in ARNA. The increased ARNA exerts a negative feedback control of ERSNA via activation of the renorenal reflexes in the overall goal of maintaining a low level of ERSNA during HNa dietary intake. In conditions of LNa dietary intake, increased expression of ETA-R on smooth muscle fibers close to the sensory nerves in the renal pelvic wall leads to ET-1-induced suppression of NE-induced release of substance P and ARNA by a mechanism(s) downstream of PGE2 synthesis. Suppression of ARNA leads to disinhibition of the renorenal reflex control of ERSNA, which would contribute to compensatory sodium retention during LNa dietary intake.
Dietary Sodium Modulates the Interaction Between ERSNA and ARNA
The interaction between ERSNA and ARNA involves renal pelvic release of NE, which activates α1- and α2-adrenoceptors on renal sensory nerves leading to increases and decreases in renal PGE2 synthesis/release, respectively (29). The current data show that the ERSNA-ARNA interaction is suppressed by LNa diet and enhanced by HNa diet. These data suggest an important physiological role for the ERSNA-ARNA interaction in renal control of water and sodium homeostasis. In HNa dietary condition, the enhancement of the ERSNA-ARNA interaction would increase the inhibitory renorenal reflex control of ERSNA, resulting in suppression of ERSNA to prevent/limit sodium retention. In LNa dietary condition, the reduced ERSNA-ARNA interaction would increase ERSNA via suppression of the renorenal reflex mechanism leading to sodium retention (Fig. 14).
The reduced ARNA response to thermal cutaneous stimulation was associated with smaller increases in ERSNA and MAP in LNa vs. HNa and NNa diet rats. However, it is unlikely that the reduced ARNA response to reflex increases in ERSNA was due to the reduced ERSNA response to thermal cutaneous stimulation in these rats. Whereas in HNa diet rats, the ARNA responses to thermal cutaneous stimulation were correlated with the magnitude of the ERSNA responses (r2 = 0.59, P < 0.01), they were not in LNa diet rats (r2 = 0.09). Calculation of the expected increases in ARNA from the measured increases in ERSNA in LNa diet rats using the regression curve equation derived from the data in HNa diet rats shows larger ARNA responses compared with those actually achieved by thermal cutaneous stimulation in the LNa diet rats. These data suggest that the ARNA responses to thermal cutaneous stimulation in LNa diet rats are controlled/suppressed by some mechanism(s) other than the increases in ERSNA. Further studies examining the effects of NE administered directly into the renal pelvis and to an isolated renal pelvic wall preparation from rats fed various sodium diets supported this hypothesis. The threshold concentration of NE required to increase ARNA and substance P release was lowest in HNa diet rats and highest in LNa diet rats.
The increases in ARNA produced by renal pelvic administration of NE were associated with increases in contralateral urinary sodium excretion. Because MAP was not affected by renal pelvic administration of NE, the contralateral natriuretic responses most likely were the result of activation of the renorenal reflex mechanism (33).
It is unlikely that the differential responsiveness of the renal sensory nerves in rats fed various sodium diets was related to basal urinary sodium concentration. The responsiveness of the renal sensory nerves is not affected by changes in urinary sodium concentrations between 10 and 900 mM (32). In the present study, urinary sodium concentrations varied from 39 ± 6 mM in LNa diet rats (n = 27) and 107 ± 16 mM in NNa diet rats (n = 27) to 160 ± 13 mM in HNa diet rats (n = 32).
ETB-R and ETA-R in Renal Pelvic and DRG Tissue
The similar ET-1 content in renal pelvic and T9–L1 DRG tissue in HNa and LNa diet rats (24) excluded the possibility that the differential effects of ET-1 in the activation of renal sensory nerves in HNa and LNa diet rats were related to different ET-1 expression. Our previous functional studies suggested that ET-R are localized in the renal pelvic wall tissue (24). Our current studies showed 1) that both ET-R are synthesized in renal pelvic and T9–L1 DRG tissue and 2) an increased expression of ETA-R in renal pelvic tissue from LNa diet rats, a finding similar to that in renal medullary tissue (19). The increased ETA-R expression may reflect increased endogenous ANG II modulating the expression of these receptors (56).
ETB-R-ir structures are in close contact with CGRP-ir fibers and GFAP-ir structures among smooth muscle fibers in the renal pelvic wall. These data suggest that ETB-R are localized on or close to unmyelinated Schwann cells surrounding sensory nerve fibers in the renal pelvic wall. The presence of Schwann cells in the renal pelvic wall has previously been shown in close conjunction to sympathetic nerve fibers (5). The presence of ETB-R on Schwann cells close to renal pelvic sensory nerves is supported by colocalization of ETB-R-LI and GFAP-LI in satellite cells surrounding CGRP-ir cell bodies in T9–L1 DRGs, a finding similar to that by Pomonis et al. (45) in lumbar DRGs. The exact mechanism(s) by which activation of ETB-R on peripheral Schwann cells may modulate ARNA remains unclear, but it is well known that glial cells can modulate neurotransmission by increasing intracellular Ca2+ in response to various neurotransmitters, including ET-1 (10, 53). ETB-R are expressed on glial cells throughout the central nervous system (40) and on immortalized Schwann cells (55).
Our studies further showed colabeling of ETA-R and αSMA in smooth muscle cells in the pelvic wall and in small vessels in and adjacent to the renal pelvic wall, throughout the kidney and in T9–L1 DRG. CGRP-ir fibers were found among ETA-R-ir smooth muscle cells in the renal pelvic wall. The presence of ETA-R on renal pelvic smooth muscle cells was functionally supported by our studies showing abolition of the ET-1 induced renal pelvic contraction by the ETA-R antagonist BQ123. Our data in DRG are in an apparent conflict with those by Pomonis et al. (45), who showed ETA-R labeling in CGRP-ir neural cell bodies but no labeling of vascular smooth muscle in lumbar DRG. However, our data are in agreement with numerous studies showing the presence of ETA-R in vascular smooth muscle in various central and peripheral organs, including brain (10), spinal cord (43), heart, and kidney (e.g., 10). Even if the intense labeling of the smooth muscle cells would obscure a faint labeling of the sensory nerves in our studies, our findings would suggest that the predominant structures labeled with the ETA-R antibody are the smooth muscle fibers in the renal pelvic wall and vasculature both in the kidney and DRG.
Role of ETB-R and ETA-R in the Dietary Sodium Induced Modulation of the Interaction Between ERSNA and ARNA
Although much attention has been placed on ET as a mediator of pain (e.g., 4, 18), previous studies suggested that ET may also play a role in the maintenance of water and sodium homeostasis. Activation of ETB-R is known to cause a diuresis and natriuresis (47). The ETB-R-deficient rat and the mouse with collecting duct-specific knockout of ET-1 develop salt-sensitive hypertension (1, 7, 44), presumably to facilitate excretion of an increased sodium load. Moreover, our previous studies demonstrated a role for ET in the activation of renal mechanosensory nerves that was dependent on dietary sodium (24). The current results extend our previous findings and provide further evidence for ET as an important component of the spectrum of renal mechanisms involved in the renal control of water and sodium during changes in dietary sodium intake. The ERSNA-induced increases in ARNA were reduced by an ETB-R antagonist in HNa diet rats and enhanced by an ETA-R antagonist in LNa diet rats. The route of administration of the ET-R antagonists, i.e., directly into the renal pelvis, suggested that the effects of the ET-R antagonists on the ERSNA-ARNA interaction involved mechanisms at the peripheral sensory nerve endings in the renal pelvic area. This hypothesis was confirmed by the presence of ETA-R and ETB-R receptors close to sensory nerves in the renal pelvic wall and our studies in the isolated sympathetically denervated renal pelvic wall preparation. Adding an ETB-R antagonist to the incubation bath reduced the NE-induced release of PGE2 and substance P from HNa diet pelvises. Because the NE-release of substance P is dependent on intact PG syntheses (29), these data suggest that stimulation of ETB-R contributes to the enhanced activation of renal sensory nerves by a PGE2-dependent mechanism. In contrast, in renal pelvises from LNa diet rats, the ETA-R antagonist enhanced the NE-mediated release of substance P without affecting the release of PGE2, suggesting that the activation of ETA-R modulates renal sensory nerve activity by a mechanism downstream of PGE2 synthesis (Fig. 14).
The NE concentration required to activate renal sensory nerves in vitro was much lower than that in vivo. This was especially true for LNa dietary conditions. Renal COX-2 expression is regulated by dietary sodium intake. Renal medullary COX-2 expression is increased in HNa and decreased in LNa diet, whereas the reverse is true for renal cortical COX-2 expression (8, 14, 57). COX-2 is also present in the renal pelvic wall (27). Assuming that the expression of COX-2 is regulated by similar mechanisms in the renal pelvic wall and medulla, the impaired interaction between ERSNA and ARNA in the LNa diet may in part be related to reduced renal pelvic wall COX-2 expression and increased activation of ETA-R. This hypothesis was tested and confirmed by our studies showing that adding an ETA-R antagonist and PGE2, at a subtreshold concentration for substance P release, to the incubation bath lowered the NE concentration required for substance P release from 6,250 to 50 pM.
Possible Mechanisms Involved in the Contribution of ET-1 to the Modulation of Interaction Between ERSNA and ARNA Produced by Dietary Sodium
There are numerous studies linking activation of ETB-R to increased PGE2 synthesis. Activation of ETB-R increases intracellular Ca2+ via activation of phospholipase C (PLC) in isolated glomerular cells (46). This is of interest in view of numerous studies showing increases in intracellular Ca2+ in glial cells in response to ET-1 (53) and that activation of protein kinase C (PKC) in the renal pelvic wall leads to induction of COX-2, increased PGE2 synthesis, activation of cAMP and substance P release (26, 27, 29). Furthermore, studies in astrocytes (34) and renal nonneural tissue (11) show that ET-3 and ET-1 induce COX-2 expression, increase PGE2 synthesis, and activate cAMP (51), possibly by activating ETB-R (20). These previous studies together with our current findings suggest that in conditions of HNa intake, activation of ETB-R on Schwann cells enveloping sensory nerves in the renal pelvic wall contributes to the NE-mediated release of PGE2, possibly involving activation of PLC/PKC, resulting in release of substance P and activation of the renal sensory nerves (Fig. 14).
The mechanisms involved in the ETA-R-mediated suppression of the ERSNA-ARNA interaction are currently unknown. It is unlikely that the ETA-R-mediated suppression of the responsiveness of renal sensory nerves is related to ETA-R-induced renal pelvic wall contractions, which most likely would increase rather than decrease ARNA. On the other hand, the presence of ETA-R on smooth muscle cells in small vessels in and adjacent to the renal pelvic wall may suggest that the ETA-R induced modulation of renal sensory nerve activation is related to local vasoconstriction with ischemia leading to an increase in oxygen free radicals (35, 38), which have been shown to impair carotid baroreceptor activity (36). The close anatomical relationship between ETA-R-ir smooth muscle cells and CGRP-ir fibers may support such a hypothesis. The lack of effect of BQ123 on the NE-induced release of PGE2 suggests that activation of ETA-R suppresses the activation of renal sensory nerves by a mechanism(s) downstream of PGE2 release (Fig. 14). These data together with our previous studies, which showed that activation of ETA-R contributes to the ANG II-induced suppression of the activation of renal mechanosensory nerves (21), may suggest that the ETA-R-induced suppression of the renal sensory nerves involves inhibition of the PGE2-mediated activation of adenylyl cyclase by a pertussis toxin sensitive mechanism (22).
Perspectives
In conditions of HNa dietary conditions, the enhancement of the interaction between ERSNA and ARNA would increase the inhibitory renorenal reflex control of ERSNA resulting in suppression of ERSNA to prevent/limit sodium retention. In contrast, in conditions of LNa dietary intake suppression of the interaction between ERSNA and ARNA would increase ERSNA via impairment of the renorenal reflex mechanism leading to sodium retention. The importance of this interaction in the control of water and sodium homeostasis and the regulation of arterial pressure has been shown in rats with disrupted afferent renal innervation. These rats are characterized by increased ERSNA responsiveness to general activation of the sympathetic nervous system, eventually leading to renal sodium retention and increased arterial pressure in conditions of increased dietary sodium intake (23, 31).
Our data showing that ET-1 may enhance or suppress the interaction between ERSNA and ARNA dependent on the dietary sodium intake suggest that ET-1 contributes importantly to the renal mechanisms involved in the control of ERSNA and maintenance of sodium balance. Thus an impairment of the interaction between ERSNA and ARNA may contribute to the salt sensitive hypertension in the ETB-R deficient rat (7, 44). Interestingly, administration of an ETA-R antagonist reduces arterial pressure in these rats.
GRANT
This work was supported by grants from the Department of Veterans Affairs, National Heart, Lung and Blood Institute (RO1-HL-66068), American Heart Association Heartland Affiliate (Grant-in-Aid 0750046Z), the Alfried Krupp von Bohlen and Halbach Foundation Collegiate Program “Life Science-Medicine, Life and Health” Sciences at the Alfried Krupp Science College in Greifswald, Germany, Swedish Research Council (04X-2887) and Knut and Alice Wallenberg Foundation, Sweden.
DISCLAIMER
The content is solely the responsibility of the authors and does not necessarily represent the official views of National Heart, Lung and Blood Institute or the National Institutes of Health.
Supplementary Material
Acknowledgments
We are grateful for generous supply of the CGRP antisera from the late Dr. J. H. Walsh and Dr. H. C. Wong, The Center for Ulcer Research and Education of the Veterans Affairs/ University of California Gastroenteric Biology Center, Los Angeles.
REFERENCES
- 1.Ahn D, Ge Y, Stricklett PK, Gill P, Taylor D, Hughes AK, Yanagisawa M, Miller L, Nelson RD, Kohan DE. Collecting duct-specific knockout of endothelin-1 causes hypertension and sodium retention. J Clin Invest 114: 504–511, 2004. [DOI] [PMC free article] [PubMed] [Google Scholar]
- 2.Barajas L, Powers K. Monoaminergic innervation of the rat kidney: a quantitative study. Am J Physiol Renal Fluid Electrolyte Physiol 259: F503–F511, 1990. [DOI] [PubMed] [Google Scholar]
- 3.Burg M, Zahm DS, Knuepfer MM. Immunocytochemical co-localization of substance P and calcitonin gene-related peptide in afferent renal nerve soma of the rat. Neurosci Lett 173: 87–93, 1994. [DOI] [PubMed] [Google Scholar]
- 4.da Cunha JM, Rae GA, Ferreira SH, Cunha de Q F. Endothelins induce ETB receptor-mediated mechanical hypernociception in rat hindpaw: roles of cAMP and protein kinase C. Eur J Pharmacol 501: 87–94, 2004. [DOI] [PubMed] [Google Scholar]
- 5.Darlot F, Artuso A, Lautredou-Audouy N, Casellas D. Topology of Schwann cells and sympathetic innervation along preglomerular vessels: a confocal microscopic study in S100B/EGFP transgenic mice. Am J Physiol Renal Physiol 295: F1142–F1148, 2008. [DOI] [PubMed] [Google Scholar]
- 6.Donovan MK, Wyss JM, Winternitz SR. Localization of renal sensory neurons using fluorescent dye technique. Brain Res 259: 119–122, 1983. [DOI] [PubMed] [Google Scholar]
- 7.Gariepy CE, Ohuchi T, Williams C, Richardson JA, Yanagisawa M. Salt-sensitive hypertension in endothelin-B receptor-deficient rats. J Clin Invest 105: 925–933, 2000. [DOI] [PMC free article] [PubMed] [Google Scholar]
- 8.Harris RC, McKanna JA, Akai Y, Jacobson HR, Dubois RN. Cyclooxygenase-2 is associated with the macula densa of rat kidney and increases with salt restriction. J Clin Invest 94: 2504–2510, 1994. [DOI] [PMC free article] [PubMed] [Google Scholar]
- 9.Haydon PG Glia: listening and talking to the synapse. Nat Rev Neurosci 2: 185–193, 2001. [DOI] [PubMed] [Google Scholar]
- 10.Hori S, Komatsu Y, Shigemoto R, Mizuno N, Nakanishi S. Distinct tissue distribution and cellular localization of two messenger ribonucleic acids encoding different subtypes of rat endothelin receptors. Endocrinology 130: 1885–1895, 1992. [DOI] [PubMed] [Google Scholar]
- 11.Hughes AK, Padilla E, Kutchera WA, Michael JR, Kohan DE. Endothelin-1 induction of cyclooxygenase expression in rat mesangial cells. Kidney Int 47: 53–61, 1995. [DOI] [PubMed] [Google Scholar]
- 12.Ihara M, Noguchi K, Saeki T, Fukuroda T, Tsuchida S, Kimura S, Fukami T, Ishikawa K, Nishikibe M, Yano M. Biological profiles of highly potent endothelin antagonists selective for the ETA receptor. Life Sci 50: 247–255, 1992. [DOI] [PubMed] [Google Scholar]
- 13.Ishikawa K, Ihara M, Noguchi K, Mase T, Mino N, Saeki T, Fukuroda T, Fukami T, Ozaki S, Nagase T, Nishikibe M, Yano M. Biochemical and pharmacological profile of a potent and selective endothelin B-receptor antagonist BQ-788. Proc Natl Acad Sci USA 91: 4892–4896, 1994. [DOI] [PMC free article] [PubMed] [Google Scholar]
- 14.Jensen BL, Kurtz A. Differential regulation of renal cyclooxygenase mRNA by dietary salt intake. Kidney Int 52: 1242–1249, 1997. [DOI] [PubMed] [Google Scholar]
- 15.Jessen KR Glial cell. Int J Biochem Cell Biol 36: 1861–1867, 2004. [DOI] [PubMed] [Google Scholar]
- 16.Jessen KR, Morgan L, Stewart HJ, Mirsky R. Three markers of adult non-myelin-forming Schwann cells, 217c(Ran-1), A5E3 and GFAP; development and regulation by neuron-Schwann cell interaction. Development 109: 91–103, 1990. [DOI] [PubMed] [Google Scholar]
- 17.Karet FE, Kuc RE, Davenport AP. Novel ligands BQ123 and BQ3020 characterize endothelin receptor subtypes ETA A and ETB in human kidney. Kidney Int 44: 36–42, 1993. [DOI] [PubMed] [Google Scholar]
- 18.Klass M, Hord A, Wilcox M, Denson D, Csete M. A role for endothelin in neuropathic pain after constriction injury of the sciatic nerve. Anesth Analg 101: 1757–1762, 2005. [DOI] [PubMed] [Google Scholar]
- 19.Klinger F, Grimm R, Steinbach A, Tanneberger M, Kunert-Keil C, Rettig R, Grisk O. Low NaCl intake elevates renal medullary endothelin-1 and endothelin A receptor mRNA but not the sensitivity of renal Na excretion to ETA receptor blockade in rats. Acta Physiol 192: 429–442, 2008. [DOI] [PubMed] [Google Scholar]
- 20.Kohan DE, Padilla E, Hughes AK. Endothelin B receptor mediates ET-1 effects on cAMP and PGE2 accumulation in rat IMCD. Am J Physiol Renal Fluid Electrolyte Physiol 265: F670–F676, 1993. [DOI] [PubMed] [Google Scholar]
- 21.Kopp UC, Cicha MZ, Smith LA. Activation of endothelin-A receptors contributes to angiotensin-induced suppression of renal sensory nerve activation. Hypertension 49: 141–147, 2007. [DOI] [PubMed] [Google Scholar]
- 22.Kopp UC, Cicha MZ, Smith LA. Angiotensin blocks substance P release from renal sensory nerves by inhibiting PGE2-mediated activation of cAMP. Am J Physiol Renal Physiol 285: F472–F483, 2003. [DOI] [PubMed] [Google Scholar]
- 23.Kopp UC, Cicha MZ, Smith LA. Arterial pressure increases in afferent renal denervated rats on high sodium diet. Hypertension 42: 968–973, 2003. [DOI] [PubMed] [Google Scholar]
- 24.Kopp UC, Cicha Smith LA MZ. Differential effects of endothelin on the activation of renal mechanosensory nerves: stimulatory in high and inhibitory in low sodium diet. Am J Physiol Regul Integr Comp Physiol 291: R1545–R1556, 2006. [DOI] [PubMed] [Google Scholar]
- 25.Kopp UC, Cicha MZ, Smith LA. Endogenous angiotensin modulates PGE2-mediated release of substance P from renal mechanosensory nerve fibers. Am J Physiol Regul Integr Comp Physiol 282: R19–R30, 2002. [DOI] [PubMed] [Google Scholar]
- 26.Kopp UC, Cicha MZ, Smith LA. PGE2 increases release of substance P from renal sensory nerves by activating the cAMP-PKA transduction cascade. Am J Physiol Regul Integr Comp Physiol 282: R1618–R1627, 2002. [DOI] [PubMed] [Google Scholar]
- 27.Kopp UC, Cicha MZ, Smith LA, Haeggström JZ, Samuelsson B, Hökfelt T. Cyclooxygenase-2 involved in stimulation of renal mechanosensitive neurons. Hypertension 35: 373–378, 2000. [DOI] [PubMed] [Google Scholar]
- 28.Kopp UC, Cicha MZ, Smith LA, Hökfelt T. Nitric oxide modulates the renal sensory nerve fibers by mechanisms related to substance P receptor activation. Am J Physiol Regul Integr Comp Physiol 281: R279–R290, 2001. [DOI] [PubMed] [Google Scholar]
- 29.Kopp UC, Cicha MZ, Smith LA, Mulder J, Hokfelt T. Renal sympathetic nerve activity modulates afferent renal nerve activity by PGE2-dependent activation of α1- and α2-adrenoceptors on renal sensory nerve fibers. Am J Physiol Regul Integr Comp Physiol 293: R1561–R1572, 2007. [DOI] [PubMed] [Google Scholar]
- 30.Kopp UC, Farley DM, Cicha MZ, Smith LA. Activation of renal mechanosensitive neurons involves bradykinin, protein kinase C, PGE2 and substance P. Am J Physiol Regul Integr Comp Physiol 278: R937–R946, 2000. [DOI] [PubMed] [Google Scholar]
- 31.Kopp UC, Jones SY, DiBona GF. Afferent renal denervation impairs baroreflex control of efferent renal sympathetic nerve activity. Am J Physiol Regul Integr Comp Physiol 295: R1882–R1890, 2008. [DOI] [PMC free article] [PubMed] [Google Scholar]
- 32.Kopp UC, Smith LA, Pence A. Na+-K+-ATPase inhibition sensitizes renal mechanoreceptors activated by physiological increases in renal pelvic pressure. Am J Physiol Regul Integr Comp Physiol 267: R1109–R1117, 1994. [DOI] [PubMed] [Google Scholar]
- 33.Kopp UC, Olson LA, DiBona GF. Renorenal reflex responses to mechano-and chemoreceptor stimulation in the dog and rat. Am J Physiol Renal Fluid Electrolyte Physiol 246: F67–F77, 1984. [DOI] [PubMed] [Google Scholar]
- 34.Koyama Y, Mizobata T, Yamamoto N, Hashimoto H, Matsuda T, Baba A. Endothelins stimulate expression of cyclooxygenase 2 in rat cultured astrocytes. J Neurochem 73: 1004–1011, 1999. [DOI] [PubMed] [Google Scholar]
- 35.Laplante MA, Wu R, Moreau P, de Champlain J. Endothelin mediates superoxide production in angiotensin II-induced hypertension in rats. Free Radic Biol Med 38: 589–596, 2005. [DOI] [PubMed] [Google Scholar]
- 36.Li Z, Mao HZ, Abboud FM, Chapleau MW. Oxygen-derived free radical contribute to baroreceptor dysfunction in atherosclerotic rabbits. Cir Res 79: 802–811, 1996. [DOI] [PubMed] [Google Scholar]
- 37.Liu L, Barajas L. The rat renal nerves during development. Anat Embryol 188: 345–361, 1993. [DOI] [PubMed] [Google Scholar]
- 38.Loomis ED, Sullivan JC, Osmond DA, Pollock DM, Pollock JS. Endothelin mediates superoxide production and vasoconstriction through activation of NADPH oxidase and uncoupled nitric-oxide synthase in the rat aorta. J Pharmacol Exp Ther 315: 1058–1064, 2005. [DOI] [PubMed] [Google Scholar]
- 39.Matsuo G, Matsumura Y, Tadano K, Morimoto S. Effects of sarafotoxin S6c on antidiuresis and norepinephrine overflow induced by simulation of renal nerves in anesthetized dogs. J Pharmacol Exp Ther 280: 905–910, 1997. [PubMed] [Google Scholar]
- 40.Nakagomi S, Kiryu-Seo S, Kiyama H. Endothelin-converting enzymes and endothelin receptor B messenger RNAs are expressed in different neural cell species and these messenger RNAs are coordinately induced in neurons and astrocytes respectively following nerve injury. Neuroscience 101: 441–449, 2000. [DOI] [PubMed] [Google Scholar]
- 41.Nakamura K, Okada S, Yokotani K. Endothelin Eta and ETB-receptor-mediated inhibition of noradrenaline release from isolated rat stomach. J Pharm Sci 91: 34–40, 2003. [DOI] [PubMed] [Google Scholar]
- 42.Peirson SN, Butler JN, Foster RG. Experimental validation of novel and conventional approaches to quantitative real-time PCR data analysis. Nucl Acids Res 31: e73, 2003. [DOI] [PMC free article] [PubMed] [Google Scholar]
- 43.Peters CM, Rogers SD, Pomonis JD, Egnaczyck GF, Keyser CP, Schmidt JA, Ghilardi JR, Maggio JE, Mantyh PW. Endothelin receptor expression in the normal and injured spinal cord: potential involvement in injury-induced ischemia and gliosis. Exp Neurol 180: 1–13, 2003. [DOI] [PubMed] [Google Scholar]
- 44.Pollock DM, Pollock JS. Evidence for endothelin involvement in the response to high salt. Am J Physiol Renal Physiol 281: F144–F150, 2001. [DOI] [PubMed] [Google Scholar]
- 45.Pomonis JD, Rogers SD, Peters CM, Ghilardi JR, Mantyh PW. Expression and localization of endothelin receptors: implications for the involvement of peripheral glia in nociception. J Neurosci 21: 999–1006, 2001. [DOI] [PMC free article] [PubMed] [Google Scholar]
- 46.Ritthaler T, Scholz H, Ackermann M, Riegger G, Kurtz A, Krämer BK. Effects of endothelins on renin secretion from isolated mouse renal juxtaglomerular cells. Am J Physiol Renal Fluid Electrolyte Physiol 268: F39–F45, 1995. [DOI] [PubMed] [Google Scholar]
- 47.Rubanyi GM, Polokoff MA. Endothelins: molecular biology, biochemistry, pharmacology, physiology and pathophysiology. Pharmacol Rev 46: 325–415, 1994. [PubMed] [Google Scholar]
- 48.Schlüter T, Grimm R, Steinbach A, Lorenz G, Rettig R, Grisk O. Neonatal sympathectomy reduces NADPH oxidase activity and vascular resistance in spontaneously hypertensive rat kidneys. Am J Physiol Regul Integr Comp Physiol 291: R391–R399, 2006. [DOI] [PubMed] [Google Scholar]
- 49.Schlüter T, Steinbach AC, Steffen A, Rettig R, Grisk O. Apocynin-induced vasodilation involves Rho kinase inhibition but not NADPH oxidase inhibition. Cardiovasc Res 80: 271–279, 2008. [DOI] [PubMed] [Google Scholar]
- 50.Siegel S, Castellan N Jr. Nonparametric Statistics for the Behavioral Sciences (2nd Edition). New York: McGraw-Hill, 1988, p. 87–95, 103–111, 128–137, 174–183.
- 51.Simonson MS, Dunn MJ. Endothelin-1 stimulates contraction of rat glomerular mesangial cells and potentiates β-adrenergic-mediated cyclic adenosine monophosphate accumulation. J Clin Invest 85: 790–797, 1990. [DOI] [PMC free article] [PubMed] [Google Scholar]
- 52.Takagi H, Hisa H, Satoh S. Effects of endothelin on adrenergic neurotransmission in the dog kidney. Eur J Pharmacol 203: 291–294, 1991. [DOI] [PubMed] [Google Scholar]
- 53.Verkhratsky A, Orkand RA, Kettenmann H. Glial calcium: homeostasis and signalling function. Physiol Rev 78: 99–141, 1998. [DOI] [PubMed] [Google Scholar]
- 54.Wendel M, Knels L, Kummer W, Koch T. Distribution of endothelin receptor subtype ETA and ETB in the rat kidney. J Histochem Cytochem 54: 1193–1203, 2006. [DOI] [PubMed] [Google Scholar]
- 55.Wilkins PL, Suchovsky D, Berti-Mattera LN. Immortalized Schwann cells express endothelin receptors coupled to adenylyl cyclase and phospholipase C. Neurochem Res 22: 409–418, 1997. [DOI] [PubMed] [Google Scholar]
- 56.Xia Y, Karmazyn M. Obligatory role for endogenous endothelin in mediating the hypertrophic effects of phenylephrine and angiotensin II in neonatal rat ventricular myocytes: evidence for two distinct mechanisms for endothelin regulation. J Pharmacol Exp Ther 310: 43–51, 2004. [DOI] [PubMed] [Google Scholar]
- 57.Yang T, Singh I, Pham H, Sun D, Smart A, Schnermann JB, Briggs JP. Regulation of cyclooxygenase expression in the rat kidney by dietary salt intake. Am J Physiol Renal Physiol 274: F481–F489, 1998. [DOI] [PubMed] [Google Scholar]
- 58.Yukimura T, Notoya M, Mizojiri K, Mizuhira V, Matsuura T, Ebara T, Miura K, Kim S, Iwao H, Song K. High resolution localization of endothelin receptors in rat renal medulla. Kidney Int 50: 135–147, 1996. [DOI] [PubMed] [Google Scholar]
- 59.Zhuo JL Renomedullary interstitial cells: a target for endocrine and paracrine actions of vasoactive peptides in the renal medulla. Clin Exp Pharmacol Physiol 27: 465–473, 2000. [DOI] [PubMed] [Google Scholar]
Associated Data
This section collects any data citations, data availability statements, or supplementary materials included in this article.


