Abstract
The number of known alternative human isoforms has been increasing steadily with the amount of available transcription data. To date, over 100 000 isoforms have been detected in EST libraries, and at least 75% of human genes have at least one alternative isoform. In this paper, we propose that most alternative splicing events are the result of noise in the splicing process. We show that the number of isoforms and their abundance can be predicted by a simple stochastic noise model that takes into account two factors: the number of introns in a gene and the expression level of a gene. The results strongly support the hypothesis that most alternative splicing is a consequence of stochastic noise in the splicing machinery, and has no functional significance. The results are also consistent with error rates tuned to ensure that an adequate level of functional product is produced and to reduce the toxic effect of accumulation of misfolding proteins. Based on simulation of sampling of virtual cDNA libraries, we estimate that error rates range from 1 to 10% depending on the number of introns and the expression level of a gene.
BACKGROUND
The number of human genes with alternative splicing is presently not well established. Early estimates based on expressed sequence tag (EST) data suggested that around 35–40% of all genes have at least one alternative isoform (1,2). Current estimates based on a larger collection of EST libraries, high-throughput sequencing and microarray experiments show numbers as high as 95% (3). It is now clear that nearly every gene with potential for splicing produces alternative isoforms.
Numerous bioinformatics studies have analyzed tissue specificity, species conservation, domain architecture, sequence properties and structural properties of isoforms (2,4–7). Most studies relate the probability of an alternative splice isoform having function to tissue specificity, abundance, or conservation across species. It is estimated that ∼10–20% of all of alternative splicing events are conserved across two or more species (8–12). Conserved alternative splicing events are found to be enriched in characteristics consistent with generation of novel molecular function, such as increased coding frame preservation, increase in abundance and preference for changes in functional regions (13). While some of these conserved isoforms likely have function, it is by no means clear that all do. Additionally, the functional properties of the much larger set of low-abundance species-specific isoforms are left open.
There are essentially four hypotheses that can explain the presence of these isoforms: (i) alternative isoforms produce novel protein sequence and thus generate new functionality (4,14–16); (ii) alternative isoforms that do not code for functional proteins but rather regulate the total abundance of functional isoform(s) by nonsense-mediated decay (NMD) or protein degradation pathways (17,18); (iii) alternative isoforms are consistently produced, but have no functional consequences; and (iv) alternative isoforms are the result of stochastic noise in the splicing process (15,19–21).
As noted above, there is clear evidence that hypotheses 1 and 2—that splicing products produce proteins with alternative functions or serve to regulate the level of production of functional protein—are partially correct. Hypotheses 3 and 4—that alternative splicing products are mostly nonfunctional—are suggested by the large fraction of splice forms that are of low abundance and not conserved across species. These are unlikely to code for functional protein products, but as long as they do not negatively impact the normal function of a gene there is little selection pressure to limit their production. It has been proposed that alternative isoforms might serve as a testing ground for molecular evolution (22–24).
In this paper, we explore the consequences of hypothesis 4, that stochastic noise largely determines the number of alternative isoforms and their transcript abundance. Random fluctuations in various environmental and cellular and molecular factors result in nonperfect selection of splice sites, and as a consequence a single gene will produce low-level expression of many different alternative products. In this context, biologically meaningful alternative splicing can be viewed as regulated selection of splice sites, in the background of a much larger set of all possible variations. We will refer to instances of unregulated splice site selection as ‘errors’, and an ‘error rate’ as a frequency with which such events occur.
We make two key observations supporting the noisy splicing hypothesis: The number of isoforms increases as a function of the expression level of a gene and with the number of introns in a gene. That is, the greater the number of splicing reactions—the greater the number of opportunities to select alternative splice sites—the greater is the number of isoforms produced. We find that there is large variability in implied error rates and that genes with many splicing reactions have reduced error rates. Based on these observations, we propose that there is selection pressure on highly expressed genes and genes with a large number of introns to maintain low levels of alternative splicing.
To more quantitatively investigate the validity of the noise hypothesis, we have developed three models of error rate per splicing reaction: (i) a constant error rate model; (ii) error rates varying with the number of introns in a gene; and (iii) error rates varying with the number of introns and transcripts of a gene. Each model was tested by simulating the production and experimental sampling of transcripts from virtual complementary DNA (cDNA) libraries. The observed data are most consistent with the error model that takes into account the number of introns and the relative abundance of a gene. Furthermore, we find that the density of predicted exon splicing enhancers increases with the number of splicing reactions, implying better-determined splice sites in genes undergoing many splicing reactions. The success of the model in reproducing nontrivial observed trends in the experimental data strongly supports the view that a large fraction of minor isoforms are indeed nonfunctional.
METHODS
Data sources
The human genome sequence (25) was downloaded from NCBI (NCBI Human Genome Build 35). The transcript data were obtained from Refseq (26) (Release 17; May 2006; 29 475 sequences), and Unigene (26) (May 2006; 6 586 000 sequences). The location of genes on chromosomes was taken from Refseq database annotation. For each gene, all sequences were aligned to a human genomic contig using the sim4 algorithm (27) and then checked for alignment errors (see list of rules below).
Alignment quality control
The following five rules are used to identify sequences containing likely alignment and sequencing errors.
All implied splice sites must conform to the spliceosome pattern - ′GT/AG′.
All exons must have >90% identity with the corresponding genomic sequence.
Alignment to genomic sequence must not contain any missing segments.
The sequence around exon junctions (6 nt into each exon) must have 100% identity with the corresponding contig.
The cDNA must not contain any introns of size <30 nt.
Two additional filters were applied to minor isoforms: (a) minor isoforms must share at least one exon with the corresponding major isoform (overlap of >1 nt); and (ii) minor isoforms must not contain an intron retention event relative to the major isoform.
Selection of major isoform
For each gene, we identified one of the cDNAs as the major isoform—that is, the isoform whose splicing patterns are most frequently observed across all Unigene EST libraries. The exon structure of major isoforms is used as a reference to which the exon structures of minor isoforms are compared. To determine major isoforms, sequences are sorted using the following procedure. First, we created a list of introns and all sequences that are associated with those introns. For each intron in a cDNA, we calculate the number of EST sequences and number of unique EST libraries that contain this intron. For each cDNA we then compute three values: sequence length, number of ESTs containing one or more of its introns and the number of unique EST libraries containing any of its introns. Finally, we sort the cDNAs using these values in the following order: (i) number of unique EST libraries; (ii) total number of ESTs; and (iii) sequence length.
The top ranking sequence is selected as the major isoform.
Data sets
Complete set
EST sequences from all Unigene EST libraries (8674 libraries in total) that have a unique mapping to a Refseq gene entry. The data set contains 15 342 genes with 5 313 618 EST sequences that have passed quality-control checks.
CGAP set
Subset of 325 libraries from the ‘complete set’. Only nonnormalized libraries derived from normal tissue samples are included. (14 397 genes, 530 618 EST sequences).
CGAP lung set
A subset of 16 libraries from the ‘complete set’. Only non-normalized libraries derived from a normal lung tissue are included. (6728 genes, 21 894 EST sequences)
Lib8840
The single largest UNIGENE EST library, from normal pancreatic islet cells (4447 genes, 40 083 EST sequences, NCBI dbEST Library #8840).
Identification of alternative splicing events
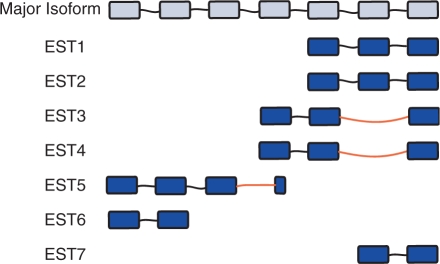
For each gene, we compare the intron structure of the major isoform with the intron structure of each EST sequence. If an EST sequence contains at least one intron that differs from the corresponding major isoform intron at the 5′ or 3′ splice site, that EST is counted as an alternative transcript. The total number of alternative transcripts is defined as the total number of ESTs containing alternative splicing. The fraction of alternative transcripts is defined as the number of ESTs with alternative splicing divided by the total number of ESTs for a gene. The number of isoforms for a gene is defined as the number of unique intron patterns discovered in the EST libraries. We also defined the number of detected splicing reactions as the total number of introns observed in all EST sequences of a gene (illustrated in Figure 1).
Figure 1.
Example analysis of EST sequences. In this hypothetical example, the major isoform of a gene has six introns and seven ESTs have been observed in a library. Three of the ESTs sequences (EST3, EST4, EST5) contain alternative introns—introns that differ at the 3′ and/or 5′ end from corresponding intron in the major isoform. The fractional abundance of alternative transcripts is 42% (3 out of 7). The number of isoforms for this gene is 3 (major isoform, EST3 isoform and EST5 isoforms). EST4 is not counted as an additional isoform because it has the same pattern as EST3. There are a total of 13 detected splicing reactions (count of all introns from all ESTs) and 3 of these splicing reactions are classified as alternative. The implied error rate for this gene is 0.23 (3 out of 13 splicing reactions).
EST-based abundance measure
To estimate the abundance of transcripts for a gene per cell based on the EST library collection, we used the following formula:
| 1 |
where N(gene) is the number of observed ESTs for a given gene, N(total) is the size of the CGAP EST library, and C is a scaling constant (∼1.5 in CGAP 325 library subset) to make the total number of generated transcripts equal to 800 000, approximately the content of a single human cell (28).
Microarray-based abundance measure
Microarray data from the NCBI GEO Series GSE3526 were used in this study. These data cover over 100 different normal tissues from 10 human subjects. The comparison between microarray signal values and ESTs counts per gene in the CGAP subset is shown in Supplementary Figure 4. For each gene, we compute average signal values across 353 samples from the microarray series. The genes were grouped into 100 equal-size bins, based on the average signal values, and within each group, the mean number of observed ESTs and the mean microarray signal were calculated. The signal value is a measure of probe intensity and it has been shown (28) that log(probe intensity) is linearly proportional to log(transcripts per cell). We find a strong correlation between number of ESTs per gene and microarray signal values (correlation 0.93, P-value <2e-16) on a log–log scale. Based on the fit between microarray signal and ESTs per gene, we use the following formula to estimate the number of transcripts of each gene in a cell:
| 2 |
Where S is the microarray signal value, α = 0.34 and k = 0.91 are values obtained from the fit of EST counts to microarray signal (Supplementary Figure 4), and C = 2 is a scaling constant to make the total number of generated transcripts equal to 800 000, approximately the content of a single human cell (28).
Binary transcript representation
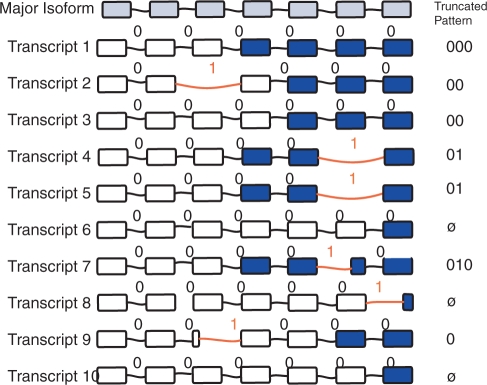
Using the intron counts, error rate and numbers of transcripts per cell, we simulate the intron structure of a set of transcripts for each gene, as many transcripts as in a single cell. Figure 5 gives an illustrative example, for a gene with six introns and 10 transcripts. The intron structure of a given transcript is encoded as a binary string of length equal to the number of introns in the major isoform. The alternative introns—introns that differ from the major isoform in location of the 5′ or 3′ splice site—are represented by the symbol ‘1’, while introns with same genomic coordinates as the major isoform are represented by the symbol ‘0’. In this schema, transcripts 1, 3, 6 and 10 encode the major isoform of the gene, producing the string ‘000000’. Transcripts 2, 4 and 5 contain exon skips that are different from the major isoform for two introns, thus producing ‘01000’, ‘00001’ and ‘00001’ strings. Transcripts 7–9 contain alternative 5′ and 3′ splicing events that modify only one intron, thus producing ‘000010’, ‘000001’ and ‘001000’ strings respectively. In generating the strings, exon indels are chosen ∼49% of the time, alternative 5′ splice sites are chosen ∼25% and alternative 3′ splice sites are chosen the remaining ∼26% of the time, in accordance with the overall ratio found in 56 419 completely sequenced cDNAs (7). There are two drawbacks to binary representation of isoforms. First, events that modify both 3′ and 5′ ends of an intron are not taken into account. Second, the binary representation cannot distinguish between an alternative 3′ isoform and an alternative 5′ of the isoform of the same intron. As a consequence, we occasionally undercount the number of unique isoforms for a given gene. We tested a number of alternative alphabet representations, and found no significant difference in results, as the frequency of these events tends to be low.
Figure 5.
Binary isoforms. Simulation and sampling of the isoform composition of a gene with 10 virtual transcripts and 6 introns. Exons are shown as rectangles. Alternative splicing events are indicated by red intron bridges. The binary intron representation is shown above each bridge, with the symbol ‘1’ indicating an alternative splicing event, and the symbol ‘0’ representing a major splicing event. In the set of 10 there are total of six alternative transcripts (those with at least one ‘1': transcripts 2, 4, 5, 7, 8 and 9) with five unique alternative isoforms (one pattern occurs twice, in transcripts 4 and 5). In this example, we assume that partial message sequencing only included the colored exons. With this particular sequencing, three alternative transcripts are selected (4, 5 and 7), containing two of the five unique alternative isoforms (represented by the patterns 01 and 010). If an EST sequence contains zero introns, it is truncated to a null string, illustrated with transcripts 6, 8 and 10.
Simulation of sampling
Given the number of cells N in the simulation, each cell containing 800 000 transcripts, with the transcript per gene distribution obtained from microarray- or EST-based estimates, we simulate clone selection by randomly pooling out X number of transcripts from the pool. For example, in the simulations shown in Figures 6–8, we generated 800 000 000 virtual transcripts (1000 cells), and randomly selected ∼530 000 of them for virtual sequencing (the number in the CGAP EST library).
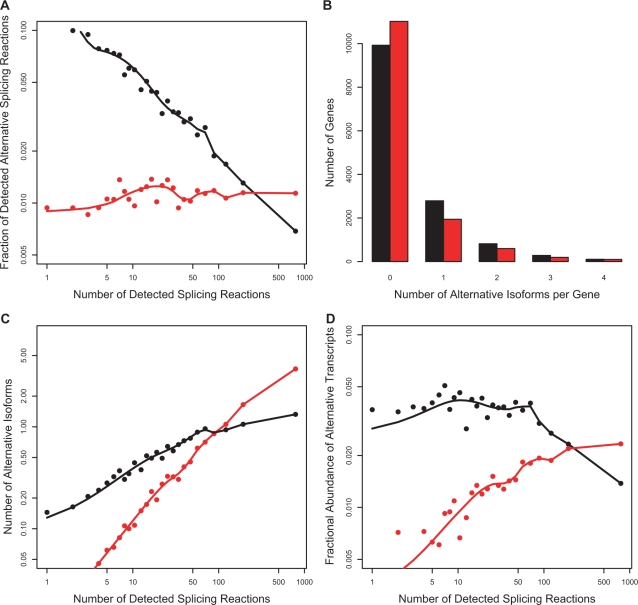
Figure 6.
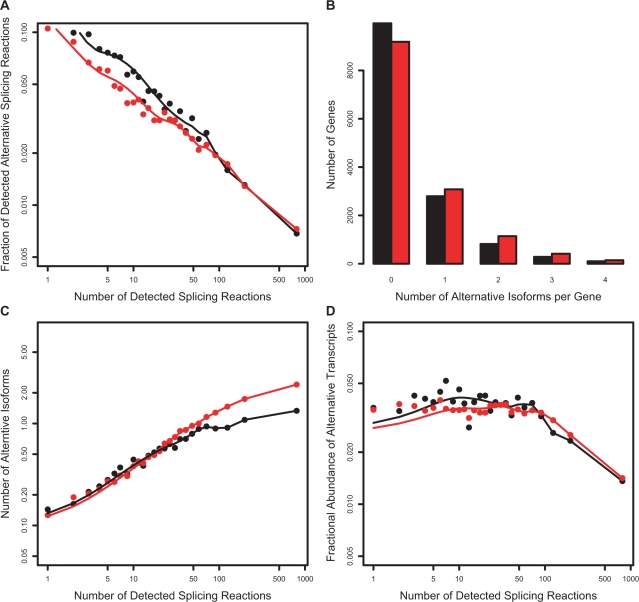
Model 1. Simulation of sampling in a virtual cDNA library with 1000 cells. Transcripts generated with a constant error rate. Red points—simulation result with error rate of 1%. Black points—observed data in the CGAP Library Subset. (A) Fraction of alternative splicing reactions produced by the model compared to observed value. (B) Number of detected alternative isoforms per gene distribution. (C) Increase in number of detected alternative isoforms as a function of number of detected splicing reactions. (D) Fractional abundance of alternative transcripts. With the exception of the number of isoforms per gene (B), this model is a poor fit to observed data.
Figure 7.
Model 2. Simulation of sampling in a virtual cDNA library with 1000 cells. The error rate varies with the number of introns in a gene, and transcripts are generated with an error rate determined by Equation (3) with α = 0.25. Red points—predicted data. Black points—observed data in the CGAP Library Subset. (A) Fraction of alternative splicing reactions produced by the model compared to observed value. (B) Number of detected alternative isoforms per gene distribution. (C) Increase in number of detected alternative isoforms as a function of number of detected splicing reactions. (D) Fractional abundance of alternative transcripts. Model 2 produces a better fit to the observed data at a low number of splicing reactions, but fails for high (>100) numbers of splicing reactions.
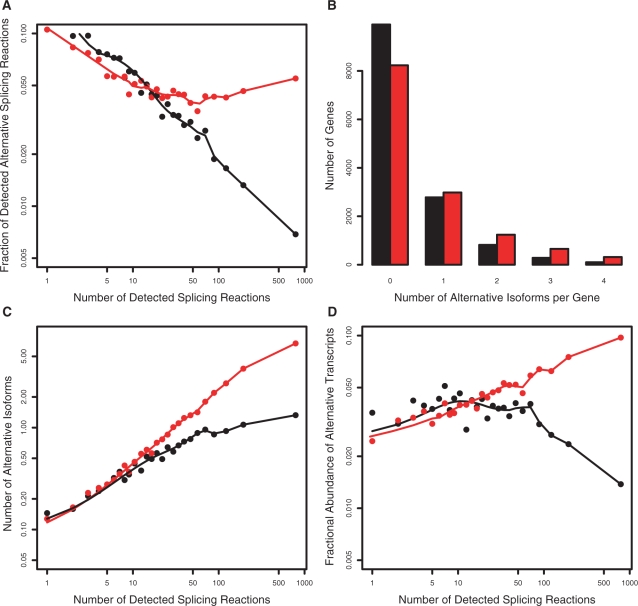
Figure 8.
Model 3. Simulation of sampling in a virtual cDNA library with 1000 cells. The error rate varies with the number of introns and the expression level of a gene, and transcripts generated with error rates determined by Equation (5) with parameter values α = 0.3 and β = 0.015. Simulation in red, observed data in black (CGAP Subset). (A) Fraction of alternative splicing reactions produced by the model compared to observed value. (B) Number of detected alternative isoforms per gene distribution. (C) Increase in number of detected alternative isoforms as a function of number of detected splicing reactions. (D) Fractional abundance of alternative transcripts. Model 3 correctly reproduces the decrease in error rates with increasing number of splicing reactions, number isoforms per gene and fractional abundance of alternative transcripts. It slightly over-predicts the increase in number of isoforms for genes with high (>100) numbers of splicing reactions, but otherwise provides an excellent fit to the trends in the experimental data.
Each selected virtual transcript is then truncated, to include only Y of its introns, where Y is obtained from the observed introns per EST distribution, thus simulating the partial coverage of message by ESTs. In the hypothetical example shown in Figure 5, there are 10 transcripts. Each virtual transcript is truncated to include the same number of introns as found in a randomly chosen real EST sequence for this gene. In cases where experimental EST sequence contains no introns, the virtual transcript was truncated to an empty string (represent by the ø symbol in the illustration).
The truncated patterns containing at least one ‘1' symbol represent detected alternatively spliced transcripts. For example, the full intron pattern of transcript 2 is ‘01000’, but since only two introns are covered in the corresponding EST sequence the pattern is truncated to ‘00’, thus resulting in an undetected alternatively spliced isoform.
We obtain the number of alternative splicing transcripts for a gene by counting the number of transcripts with at least one detected alternative splicing event. We calculate the number of alternative isoforms by counting number of unique splicing patterns. For example, in the hypothetical gene in Figure 5, there are a total of three detected alternative transcripts (transcripts 4, 5 and 7). The number of detected alternative isoforms for this gene is two, since transcripts 4 and 5 encode the same pattern, 011. The fraction of alternative transcripts is defined as the number of sampled alternative transcripts divided by the total number of sampled transcripts; in this case, 3 out 10.
RESULTS
Definitions
Before describing the results, it is useful to clarify some basic definitions used in this study. First, we define the major isoform of a gene as the isoform that is most commonly observed in EST libraries. Using the major isoform as a reference, we define an alternative splicing event as one that differs at a 5′ and/or 3′ splice site from the corresponding intron in the major isoform. If a transcript of a gene contains one or more alternative splicing events, we call it an alternative transcript. An alternative isoform is defined as a unique splicing pattern that is different from the splicing pattern in the major isoform. A single such isoform can be represented by multiple transcripts.
Data
We use EST libraries as a source of data on alternative isoforms. These libraries represent an incomplete sampling of the transcripts present in a collection of cells and are mostly composed of non-full- length messages. EST libraries are also frequently enriched for rare transcripts through normalization and subtraction procedures, and so the number of observed transcripts are not reflective of actual abundances (29). There are also possible problems with EST libraries constructed from pathogenic tissues, which might contain many abnormal splicing events. Before noise levels can be estimated, these issues need to be resolved. The problem of limited sampling of ESTs can be addressed by the use of simulations, as described later. The problem of normalized, subtracted and pathogenic tissue libraries can easily be addressed by removal of all such libraries from the analysis. Thus, in addition to the ‘complete set’ of all 8674 EST UNIGENE libraries (26), we created three EST library subsets: the CGAP subset of 325 nonnormalized libraries derived from normal tissue samples (30), the CGAP lung subset of 16 libraries derived from a normal lung tissue, and the single UNIGENE EST library derived from normal pancreatic islet cells (NCBI dbEST Library #8840).
Properties of alternative transcripts
There are three observations consistent with the noise hypothesis, described in the next sections.
Commonness of alternative isoforms
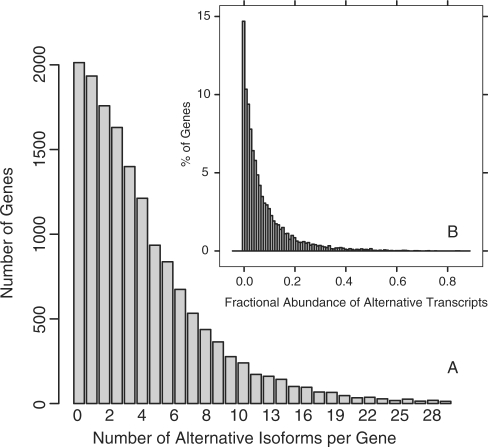
Figure 2A shows the distribution of number of alternative isoforms per gene derived from the complete set of 8674 EST libraries (see ‘Data sets’ section). Nearly 90% of all genes have alternative splicing, and the majority of genes have three to six alternative isoforms. Of course, given that present EST libraries sample only a small fraction of transcript space, only a fraction of all isoforms have so far been observed. An expected characteristic of noise transcripts is that they will have low abundance. To get the approximate fractional abundance of alternative transcripts, for each gene we calculate the fraction of all observed EST sequences that have at least one alternative intron. The resulting histogram of fractional abundance is shown in Figure 2B. Indeed we find that the majority (more than 50%) of all alternative transcripts are present at <10% fractional abundance.
Figure 2.
Isoform distribution. (A) Distribution of number of alternative isoforms per gene derived from all 8674 Human Unigene EST libraries (15 342 genes ∼5 313 000 EST sequences). The first bar contains the 2013 genes (13%) with no observed alternative isoforms. The median number of isoforms per gene is 4. (B) Fractional abundance of alternative transcripts. For each gene in the CGAP set with a least one minor isoform (1269 out of 14 397 genes). EST sequences of a gene were compared to the major isoform to identify alternative splicing events (see Methods section). We then calculate the fractional abundance of alternative transcripts as the total number of ESTs with one or more alternative introns divided by the total number of ESTs. The median fractional abundance of alternative transcripts is ∼9%.
Increase in number of isoforms with number of introns processed
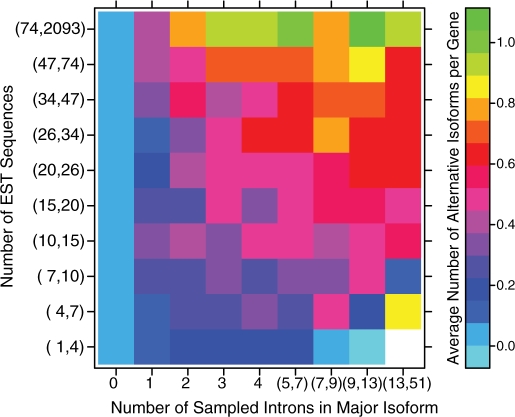
A basic expectation of any error model is that the number of mistakes is a function of the total number of opportunities to make mistakes. For spliceosomes, the number of opportunities is determined by the number of splicing reactions—the total number of introns removed from all transcripts. Two factors determine the number of splicing reactions: the number of introns removed from each transcript, and the number of transcripts produced per unit time. We use the number of observed EST as a surrogate for expression rate (See ‘Methods’ section for validation of this assumption). The increase in the number of observed unique isoforms as a function of the number of sampled introns and the number of sampled ESTs is shown in Figure 3. Consistent with the noise hypothesis, it can be seen that both quantities contribute to an increase in the number of isoforms.
Figure 3.
Increase in observed number of isoforms as a function of number of introns and EST observations. Genes from the CGAP set were divided into a 10 × 10 matrix, according to the number of sampled introns in the major isoform and the number of observed ESTs per gene (each group contains ∼140 genes). The mean number of observed isoforms was calculated for each matrix element. As can be seen in the plot, the number of isoforms increases as a function of both the number of introns per gene and the number of sampled ESTs per gene.
Factors affecting noise levels
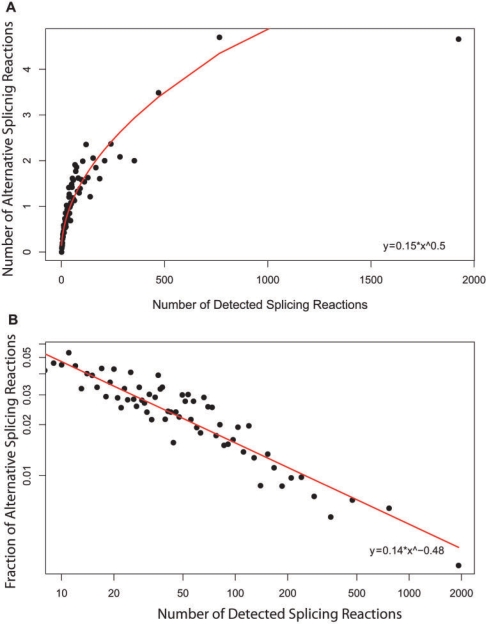
The implied splicing error rate per splicing reaction for a set of genes may be calculated directly from observed data, using the assumption that most alternative splicing events are the result of mistakes in selection of splice sites. If errors occur at a constant frequency then the number of alternative splicing events produced should grow linearly with increase in the total number of splicing events. Figure 4A shows the average number of detected alternative splicing reactions as a function of the total of observed splicing reactions (the number of detected introns in all EST sequences of a gene). As expected, the number of detected alternative reactions increases with increasing reactions, but, surprisingly, the increase is nonlinear. Figure 4B shows the average ratio of detected alternative reactions to the total number of splicing reactions, also as a function of the number of splicing reactions. It is clear that genes that undergo more splicing reactions make relatively fewer mistakes, implying lower error rates. This is by far the most surprising observation in our analysis. The decline is not due to sampling or length biases, since the number of detected alternative splicing reactions is a subset of the total number of detected splicing reactions, and thus both sets are subject to the same biases.
Figure 4.
Dependence of alternative splicing events on number of splicing reactions. The number of detected splicing reactions is the number of all introns that have been observed in all EST sequences of a gene. The number of alternative splicing reactions is a count of introns that differ in 5′ and/or 3′ splice site from the corresponding intron in the major isoform. (A) Mean number of splicing reactions versus mean number of alternative splicing reactions. The increase in number of alternative splicing reactions is nonlinear. (B) Ratio of alternative splicing events to number of splicing reactions, as a function of number of reactions plotted on log–log scale. Genes with many splicing reactions make fewer mistakes, producing a decreased fraction of alternative introns. (Genes in the CGAP subset were divided into ∼100 equal-size groups based on number of splicing reactions.).
Based on these observations we propose that selection pressures influence splicing fidelity in two primary ways. First, genes with many introns must have relatively low error rates if adequate quantities of functional protein products are produced. For example, with a 2% error rate, nearly all transcripts of a gene with 100 introns will contain at least one error (0.98100 ≈ 13%), whereas for a gene with one intron and a 2% error rate, only 2% of transcript will be in error. Second, genes with large abundance may have reduced error rates, to avoid toxic effects on the cell: production of large quantities of misfolded protein products may overwhelm the chaperone system, and cause toxic protein aggregation (31,32).
While the trends in the data supporting a noise model are clear, a quantitative test cannot be made using the EST data directly. First, only a fraction of all exons are present in a typical EST. Second, only a small fraction of all transcripts is sampled by present EST libraries. In the next sections, we address these issues by using simulations that take these biases into account.
Overview of noise models
We developed three models of error rate per splicing reaction. The first model assumes that the error rate is the same for all genes. The second model assumes that the error rate is a function of the number of introns in a gene. The third assumes that the error rate is a function of the number of transcripts and the number of introns for a given gene. The error models are used as input to a virtual transcript machine, which generates transcript contents of a cDNA library, consistent with the error assumptions. We then simulate experimental EST sampling from this cDNA library, creating virtual EST libraries, which are then directly compared to real EST libraries. Experimental cDNA libraries typically contain transcripts from several million cells, and each cell contains ∼800 000 transcripts (28). No two cells are identical in their transcript content and most (40–48%) transcripts are present at abundance levels of <1 copy per cell (28). To generate a virtual cDNA library we require three inputs: the number of introns in each gene, the absolute message abundance (transcripts per cell) for each gene, and a detailed error model. We assume that the major isoform of a gene is produced most frequently, and take the intron count directly from the corresponding Refseq full-length cDNA. We used two methods to estimate an approximate number of transcripts per gene per cell. The first method is based on the observed EST frequency for a gene in the EST library, and the second method is based on microarray signal values (see ‘Methods’ section). The results based on microarray signal values are in qualitative agreement with EST-based measures and are reported in Supplementary Figure 3.
Based on approximate copies per cell, intron count and the choice of one of the three error models, we simulate the transcript content for 1000 cells using the virtual transcript simulator. That is, for each gene, we generate N × 1000 transcripts, where N is the estimated average number of transcripts in a single cell. Errors are introduced at an appropriate rate, each error causing a different intron structure from that present in the primary transcript. Although memory limitations do not allow us to simulate a larger number of cells, we show that increasing the number of cells does not significantly affect the outcome of the simulations (see Supplementary Figure 1).
Each virtual transcript is represented as a binary intron pattern, where ‘0’ indicates that both boundaries of an intron are as in the major isoform, and ‘1’ represents an alternative splicing event where one or both boundaries are different. For each generated transcript, at each exon/intron junction, the simulator either maintains the major isoform boundary (a ‘0’), or a splicing error causing a boundary change is introduced (a ‘1’), with a probability determined by the characteristics of the particular model.
Once all transcripts in the set of cells have been generated, we mimic the cloning step and then the sequencing steps in the EST experiments. For this purpose, we randomly pick approximately the same number of virtual transcripts from the generated cDNA library as were observed in real EST experiments, and truncate each one to include the same number of introns as observed in a real EST sequence of that gene (see Figure 5 and ‘Methods’ section for further details).
We used the CGAP Library subset and the Lib8440 library as sources of real EST data. Our findings for the CGAP Library subset are summarized below. The findings for Lib8440 are in qualitative agreement with the CGAP sample and are included as Supplementary Data (Supplementary Figure 2).
Model 1: constant error rate
The simplest model of noise assumes that splicing machinery makes mistakes at a constant error rate ‘p’ per splicing reaction. In this model, all introns are equivalent—that is, the error rate is the same for all introns regardless of gene, number of introns, transcript abundance, intron length, splice site strength or any other factors. Ten values of p were tested starting at 1% and ending at 10%. As expected from Figure 4, none of the P-values produced a good fit to the observed data. The result, with p = 1% per splicing reaction, is shown in Figure 6.
As dictated by the fixed error rate, the model produces an approximately constant fraction of alternative splicing reactions as a function of total number of splicing reactions (panel A), whereas the observed data falls steadily. The model correctly predicts the distribution of the number of alternative isoforms per gene (panel B). Not surprisingly, the model predicts a raise in number of alternative isoforms with increase in number of splicing reactions (panel C). The simulation also shows an increase in the fractional abundance of alternative transcripts with an increase in the number of splicing reactions (panel D), while the observed data are approximately flat. It is quite evident that this model is a poor fit to the observed data.
Model 2: error rate dependent on the number of introns
As noted earlier, it is expected that genes with many introns will have lower per splice error rates those with few introns, in order to produce an equivalent fraction of error-free product.
Model 2 tests whether such an effect can explain the unexpected trends in the data. In this model, genes with many introns will have a lower error rate per splicing event compared to genes with few introns, with the error rate tuned such that on average, a fixed fraction α of all transcripts of each gene are alternative. Given α, the implied error rate per splicing reaction ‘p’ for a gene with N introns is given by Equation (3).
| 3 |
Figure 7 shows the result of simulations with the best-fit parameter value of α = 0.25. It is clear that inclusion of intron counts in the error rate calculation results in an improvement compared to the constant error rate model. As can be seen in panel A, at a low number of splicing reactions, there is an initial decrease in error rate as a function of number of splicing reactions consistent with the observed data. However, at high values (>100) the simulated error rate rises, while the observed values continue to decline. This model is also a better fit to the number of detected isoforms at a low number of splicing reactions (panel C) and the fractional abundance of alternative transcripts (panel D), but fails thereafter by these measures too.
Model 3: error rate determined by the number of introns and transcript abundance
In Model 3, we test the hypothesis that the error rate per splice junction is a function of both the number of introns (as in Model 2) and also the number of transcripts. As discussed earlier, the additional postulate here is that selection pressure tends to limit the total number of noise transcripts produced by all genes, since these will likely produce nonfolding protein products that will saturate the chaperone machinery and/or aggregate, and so be toxic (32,33). We implement this by assuming that selection pressure acts to both restrict the fraction of nonmajor isoforms for any gene (as in Model 2) and also to restrict the absolute number of nonmajor isoforms for any gene. We approximate these conditions by requiring that
| 4 |
for each gene, where fNM is the fraction of nonmajor isoforms, T is the total number of transcripts generated, and α and β are constants. Then the error rate per splicing reaction function assumes the same form as in Equation (3) with the addition of a contribution from the total number of nonmajor isoforms produced, with a weight specified by the constant β:
| 5 |
When β = 0, the model is equivalent to Model 2, where the error rate varies only with the number of introns. The higher the value of β, the more influence from the postulated toxic effect of many noise transcripts. A grid search of α between 0 and 0.5 and β between 0 and 0.05 was used to find the combination of parameters, which produced the best fit to the observed data.
We find that α values between 0.2 to 0.4 and β from 0.01 to 0.02 produce a good fit. Figure 8 shows the results of simulations with α = 0.3 and β = 0.015. Figure 8A shows that inclusion of abundance corrects the problem with Model 2, reproducing the observed decline in estimated error rate throughout the entire range of splicing reactions. Figure 8D shows that Model 3 also correctly reproduces the nearly constant fractional abundance of alternative transcripts, although the predicted fraction of alternatives is a few percentage points lower than observed in real EST libraries. We also observe that Model 3 slightly over-predicts the number of isoforms for genes with many (>100) splicing reactions. Overall, though, the quantitative fit to the trends in the data is excellent. Tests using Akaike's Information Criterion confirms that Model 3 provides a clearly superior fit to the data, taking into account allowing for the fact that there is one extra parameter (Supplementary Table 1).
Derived error rates
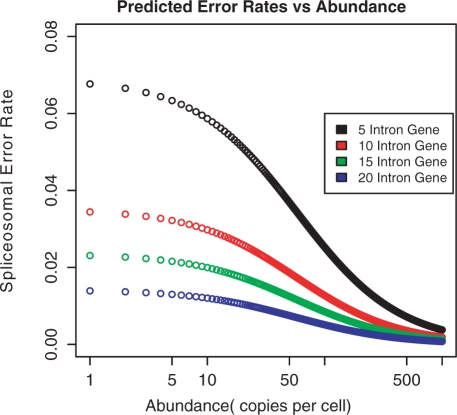
Figure 9 shows the error rates derived from Model 3 as a function of transcript abundance, and for a range of number of introns per gene. At low abundance levels, average error rates are high—ranging from 2% for genes with many introns to as much as 7% for genes with few introns. At high abundance rates, though, the error rate is always <1%, falling to 0.1% for genes with many introns.
Figure 9.
Variation in average error rate per splicing reaction as a function of transcript abundance, for genes with different numbers of introns. Data produced by Model 3, with α = 0.3 and β = 0.015. At low abundance levels, genes with few introns are predicted to have high average error rates (∼7%), while genes with many introns have low values (∼1%), reflecting the greater number of splicing reactions per transcript. At high abundance levels, all error rates are predicted to be low (<1%) because of selection against producing a large number of nonfunctional transcripts.
Factors controlling splicing fidelity
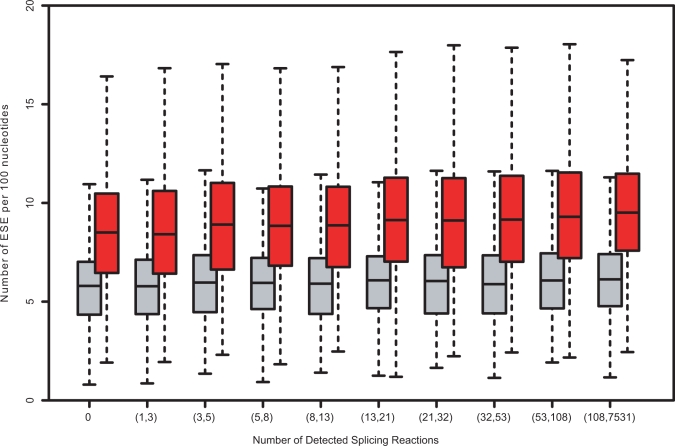
The widely varying error rates shown in Figure 9 imply that there should be some mechanism by which error rates are tuned as a function of the number of slicing reactions. There are a number of possible tuning mechanisms, such as 'stronger' splice site motifs, an increase in the number of exon/intron splicing enhancer motifs and an increase in the number of exon/intron silencer motifs. We tested two of these possibilities, computing the average splice site score using GeneSplicer HMM (34) and the average number of predicted exon splicing enhancer (ESE) motifs, using the candidate motif set from RESCUE-ESE (35), as a function of the number of splicing reactions. No difference in splice site signal strength was found, but genes with many splicing reactions are predicted to contain more predicted ESE sites compared to genes with few splicing reactions (Figure 10). A weaker trend of increased ESE sites with increased splicing reactions is also seen in the control data, generated by scrambling the sequences, and is likely due to base composition bias. The significance of the trend in Figure 10 was evaluated using the ratio of the of the number of predicted ESEs in the real sequences to the number of ESEs predicted in a scrambled sequences, binned into 10 equal- size groups based on a number of splicing reactions in each group. A two-tailed t-test was then used to compare the data in pairs of groups. The trend was found to be highly significant with a P-value 5e-10 between the first and last groups. The existence of this trend is of course not proof of the tuned error hypothesis and the contribution of each factor to the increase in splicing fidelity requires more detailed investigation. Nevertheless, the correlation of derived error rates with ESE density does provide additional support for the tuned error rate model.
Figure 10.
Predicted exon splicing enhancer (ESE) sites as a function of the number of splicing reactions. Genes from the ‘complete set’ were divided into 10 equal-size groups based on number of detected splicing reactions per gene. For each gene, we calculated the number of ESE motifs present in internal exons of the mRNA sequence of the major isoform, normalized by length of mRNA sequence (red bars). To make sure that signal is not due to compositional biases, we also calculate the number of candidate ESE motifs in shuffled mRNA sequences (gray bars). As a source of ESE data, we used 238 candidate nucleotide motifs from the RESCUE-ESE program (36). The number of putative motifs rises steadily with increase in number of splicing reactions, consistent with the reduced error rates, as expected from Models 2 and 3.
DISCUSSION
There is no doubt that some portion of alternatively spliced isoforms is functional. Alternative splicing is well established to have roles in both regulation of expression and in the generation of protein function diversity, as illustrated by many detailed studies of genes, such as CD44 (36), NOVA (37), ABCC4 (38), MID1 (39) and hUPF2 (40). Although exact estimates vary, it is also clear that that 10–30% of alternative splicing events are tissue specific (41), suggesting function. It is estimated that the fraction of all alternative splicing events that are conserved between human and other species with substantial transcriptome coverage, such as mouse and rat, is ∼10–20% (8–12). A number of bioinformatics and microarray-based studies have found that isoforms conserved across species tend to preserve coding frames (5,42), are less frequently subject to NMD (5,43), and are expressed at higher abundance, all suggesting an increased likelihood of function. Although our knowledge of conserved splicing is biased toward the more abundant genes commonly sampled in EST libraries (44), it is nevertheless clear that the majority of isoforms are neither conserved across species or tissue specific.
The hypothesis advanced in this paper is that the majority of these isoforms are products of noisy splicing. There are five primary lines of evidence supporting this hypothesis. First, the number of detected alternative isoforms increases as a function of two quantities: total expression of a gene and number of introns in a gene. Simply put, the more frequently introns are removed, the more chances there are of making mistakes, resulting in more isoforms. Second, as noted above, only a small fraction of alternative isoforms are found in two or more species and most isoforms (more than 70%) do not show clear tissue specificity (41,45,46). Third, a large fraction (34%) is expected to be subject to NMD (47). Fourth, examination of the implied protein sequences and structures of alternative isoforms shows that in most cases the structures are nonviable (48,49). Fifth, implied error rates decrease with the number of introns in a gene and the level of expression, as expected from constraints on the fraction and absolute number of correct isoforms.
The idea of splicing noise has previously been suggested by several researchers (15,50–52). However, it has been assumed that error rates of splicing machinery are constant for all genes, and that if spliceosomes make mistakes, these mistakes would represent only a small fraction of all observed isoforms (15). For example, Kan et al. (51) estimated error rates to be <0.01 per splice junction. However, development of error rate models was not a major focus of that study. More recently, Neverov et al. (52) proposed a constant error rate model with a frequency of 0.012 per splice junction. Similar to this study, the model was used to simulate isoform production, but not with the explicit purpose of estimating error rates.
The approach used in this study is novel in a number of respects. First, using a minimum number of carefully defined simple assumptions, we have developed mathematical models for error rates, providing quantitative tests of the nosiy splicing hypothesis. Second, we reduced biases associated with EST sampling by taking length and abundance of EST sequences explicitly into account in a simulation procedure. Third, to ensure reasonable accuracy of transcript abundance we tested models against both microarray data and nonnormalized EST libraries. Fourth, models were tested against four different EST collections, including a tissue-specific library and a single large EST library, to make sure that results are not a peculiarity of a particular EST sampling procedure. Fifth, in order to avoid overfitting to any particular statistical distribution, models were assessed against four different experimental distributions.
We tested a constant error rate (Model 1), an error rate dependent on the number of introns in a gene (Model 2), and an error rate dependent on the number of introns count and the transcript abundance of a gene (Model 3). We show that only the model that takes into account both the number of introns and abundance is able to account for the trends in the data. That model is built on the assumption that error rates are influenced by two selection forces: first, genes with many introns cannot tolerate high error levels because that would result in significant loss of the major product; second, the cell cannot tolerate highly expressed genes having a high error rate because the resulting large number of nonfolding protein products would be toxic, either by overwhelming the chaperone system or by forming aggregates. The latter point is analogous to the arguments advanced by Drummond et al. (53) to explain increased selection pressure against mutations in highly expressed genes. These authors assert that the explanation for this phenomenon is that there has been significant selection against the accumulation of miscoded proteins, because of their potential direct and indirect toxic effects.
At first glance, the conclusion that a large fraction alternative splicing is nonfunctional can be seen as disappointing. In fact, in this and many other biological processes, noise plays a critical role by creating a landscape of opportunities in which novel biological activity can be explored at very little cost (54). In that sense, the current state of splicing in humans, with only a fraction functional, is an intermediate state of evolution of the role of splicing.
SUPPLEMENTARY DATA
Supplementary Data are available at NAR Online.
FUNDING
The National Institutes of Health (P01 GM57890). Funding for open access charge: National Institutes of Health (P01 GM57890).
Conflict of interest statement. None declared.
Supplementary Material
ACKNOWLEDGEMENTS
We thank Steve Mount and Arlin Stoltzfus for helpful discussions.
REFERENCES
- 1.Mironov AA, Fickett JW, Gelfand MS. Frequent alternative splicing of human genes. Genome Res. 1999;9:1288. doi: 10.1101/gr.9.12.1288. [DOI] [PMC free article] [PubMed] [Google Scholar]
- 2.Modrek B, Lee C. A genomic view of alternative splicing. Nat. Genet. 2002;30:13. doi: 10.1038/ng0102-13. [DOI] [PubMed] [Google Scholar]
- 3.Pan Q, Shai O, Lee LJ, Frey BJ, Blencowe BJ. Deep surveying of alternative splicing complexity in the human transcriptome by high-throughput sequencing. Nat. Genet. 2008;40:1413. doi: 10.1038/ng.259. [DOI] [PubMed] [Google Scholar]
- 4.Kriventseva EV, Koch I, Apweiler R, Vingron M, Bork P, Gelfand MS, Sunyaev S. Increase of functional diversity by alternative splicing. Trends Genet. 2003;19:124. doi: 10.1016/S0168-9525(03)00023-4. [DOI] [PubMed] [Google Scholar]
- 5.Sorek R, Shamir R, Ast G. How prevalent is functional alternative splicing in the human genome? Trends Genet. 2004;20:68. doi: 10.1016/j.tig.2003.12.004. [DOI] [PubMed] [Google Scholar]
- 6.Magen A, Ast G. The importance of being divisible by three in alternative splicing. Nucleic Acids Res. 2005;33:5574. doi: 10.1093/nar/gki858. [DOI] [PMC free article] [PubMed] [Google Scholar]
- 7.Takeda Ji, Suzuki Y, Nakao M, Barrero RA, Koyanagi KO, Jin L, Motono C, Hata H, Isogai T, Nagai K, et al. Large-scale identification and characterization of alternative splicing variants of human gene transcripts using 56,419 completely sequenced and manually annotated full-length cDNAs. Nucleic Acids Res. 2006;34:3917. doi: 10.1093/nar/gkl507. [DOI] [PMC free article] [PubMed] [Google Scholar]
- 8.Nurtdinov RN, Artamonova I, Mironov AA, Gelfand MS. Low conservation of alternative splicing patterns in the human and mouse genomes. Hum. Mol. Genet. 2003;12:1313. doi: 10.1093/hmg/ddg137. [DOI] [PubMed] [Google Scholar]
- 9.Modrek B, Lee C. Alternative splicing in the human, mouse and rat genomes is associated with an increased frequency of exon creation and/or loss. Nat. Genet. 2003;34:177. doi: 10.1038/ng1159. [DOI] [PubMed] [Google Scholar]
- 10.Thanaraj TA, Clark F, Muilu J. Conservation of human alternative splice events in mouse. Nucleic Acids Res. 2003;31:2544. doi: 10.1093/nar/gkg355. [DOI] [PMC free article] [PubMed] [Google Scholar]
- 11.Pan Q, Bakowski MA, Morris Q, Zhang W, Frey BJ, Hughes TR, Blencowe BJ. Alternative splicing of conserved exons is frequently species-specific in human and mouse. Trends Genet. 2005;21:73. doi: 10.1016/j.tig.2004.12.004. [DOI] [PubMed] [Google Scholar]
- 12.Sorek R, Dror G, Shamir R. Assessing the number of ancestral alternatively spliced exons in the human genome. BMC Genomics. 2006;7:273. doi: 10.1186/1471-2164-7-273. [DOI] [PMC free article] [PubMed] [Google Scholar]
- 13.Xing Y, Lee C. Alternative splicing and RNA selection pressure—evolutionary consequences for eukaryotic genomes. Nat. Rev. Genet. 2006;7:499. doi: 10.1038/nrg1896. [DOI] [PubMed] [Google Scholar]
- 14.Black DL. Protein diversity from alternative splicing: a challenge for bioinformatics and post-genome biology. Cell. 2000;103:367. doi: 10.1016/s0092-8674(00)00128-8. [DOI] [PubMed] [Google Scholar]
- 15.Graveley BR. Alternative splicing: increasing diversity in the proteomic world. Trends Genet. 2001;17:100. doi: 10.1016/s0168-9525(00)02176-4. [DOI] [PubMed] [Google Scholar]
- 16.Kondrashov FA, Koonin EV. Evolution of alternative splicing: deletions, insertions and origin of functional parts of proteins from intron sequences. Trends Genet. 2003;19:115. doi: 10.1016/S0168-9525(02)00029-X. [DOI] [PubMed] [Google Scholar]
- 17.Johnson JM, Castle J, Garrett-Engele P, Kan Z, Loerch PM, Armour CD, Santos R, Schadt EE, Stoughton R, Shoemaker DD. Genome-wide survey of human alternative pre-mRNA splicing with exon junction microarrays. Science. 2003;302:2141. doi: 10.1126/science.1090100. [DOI] [PubMed] [Google Scholar]
- 18.Rehwinkel J, Letunic I, Raes J, Bork P, Izaurralde E. Nonsense-mediated mRNA decay factors act in concert to regulate common mRNA targets. RNA. 2005;11:1530. doi: 10.1261/rna.2160905. [DOI] [PMC free article] [PubMed] [Google Scholar]
- 19.Hiller M, Szafranski K, Backofen R, Platzer M. Alternative splicing at NAGNAG acceptors: simply noise or noise and more? PLoS Genet. 2006;2:e207. doi: 10.1371/journal.pgen.0020207. author reply e208. [DOI] [PMC free article] [PubMed] [Google Scholar]
- 20.Chern TM, van Nimwegen E, Kai C, Kawai J, Carninci P, Hayashizaki Y, Zavolan M. A simple physical model predicts small exon length variations. PLoS Genet. 2006;2:e45. doi: 10.1371/journal.pgen.0020045. [DOI] [PMC free article] [PubMed] [Google Scholar]
- 21.Rino J, Carvalho T, Braga J, Desterro JM, Luhrmann R, Carmo-Fonseca M. A stochastic view of spliceosome assembly and recycling in the nucleus. PLoS Comput. Biol. 2007;3:2019. doi: 10.1371/journal.pcbi.0030201. [DOI] [PMC free article] [PubMed] [Google Scholar]
- 22.Gilbert W. Why genes in pieces? Nature. 1978;271:501. doi: 10.1038/271501a0. [DOI] [PubMed] [Google Scholar]
- 23.Xing YL. Colloquium paper: evidence of functional selection pressure for alternative splicing events that accelerate evolution of protein subsequences. Proc. Natl Acad. Sci. 2005;102:13526. doi: 10.1073/pnas.0501213102. [DOI] [PMC free article] [PubMed] [Google Scholar]
- 24.Ermakova EO, Nurtdinov RN, Gelfand MS. Fast rate of evolution in alternatively spliced coding regions of mammalian genes. BMC Genomics. 2006;7:84. doi: 10.1186/1471-2164-7-84. [DOI] [PMC free article] [PubMed] [Google Scholar]
- 25.Lander ES, Linton LM, Birren B, Nusbaum C, Zody MC, Baldwin J, Devon K, Dewar K, Doyle M, FitzHugh W, et al. Initial sequencing and analysis of the human genome. Nature. 2001;409:860. doi: 10.1038/35057062. [DOI] [PubMed] [Google Scholar]
- 26.Wheeler DL, Barrett T, Benson DA, Bryant SH, Canese K, Chetvernin V, Church DM, DiCuccio M, Edgar R, Federhen S, et al. Database resources of the National Center for Biotechnology Information. Nucleic Acids Res. 2006;34:D173.27. doi: 10.1093/nar/gkj158. [DOI] [PMC free article] [PubMed] [Google Scholar]
- 27.Florea L, Hartzell G, Zhang Z, Rubin GM, Miller W. A computer program for aligning a cDNA sequence with a genomic DNA sequence. Genome Res. 1998;8:967. doi: 10.1101/gr.8.9.967. [DOI] [PMC free article] [PubMed] [Google Scholar]
- 28.Carter MG, Sharov AA, VanBuren V, Dudekula DB, Carmack CE, Nelson C, Ko MS. Transcript copy number estimation using a mouse whole-genome oligonucleotide microarray. Genome Biol. 2005;6:R61. doi: 10.1186/gb-2005-6-7-r61. [DOI] [PMC free article] [PubMed] [Google Scholar]
- 29.Bonaldo MF, Lennon G, Soares MB. Normalization and subtraction: two approaches to facilitate gene discovery. Genome Res. 1996;6:791. doi: 10.1101/gr.6.9.791. [DOI] [PubMed] [Google Scholar]
- 30.Strausberg RL. The Cancer Genome Anatomy Project: new resources for reading the molecular signatures of cancer. J. Pathol. 2001;195:31. doi: 10.1002/1096-9896(200109)195:1<31::AID-PATH920>3.0.CO;2-W. [DOI] [PubMed] [Google Scholar]
- 31.Goldberg AL. Protein degradation and protection against misfolded or damaged proteins. Nature. 2003;426:895. doi: 10.1038/nature02263. [DOI] [PubMed] [Google Scholar]
- 32.Drummond DA, Bloom JD, Adami C, Wilke CO, Arnold FH. Why highly expressed proteins evolve slowly. Proc. Natl Acad. Sci. USA. 2005;102:14338. doi: 10.1073/pnas.0504070102. [DOI] [PMC free article] [PubMed] [Google Scholar]
- 33.Ellis RJP, Teresa JT. Medicine: danger—misfolding proteins. Nature. 2002;416:483. doi: 10.1038/416483a. [DOI] [PubMed] [Google Scholar]
- 34.Pertea M, Lin X, Salzberg SL. GeneSplicer: a new computational method for splice site prediction. Nucleic Acids Res. 2001;29:1185. doi: 10.1093/nar/29.5.1185. [DOI] [PMC free article] [PubMed] [Google Scholar]
- 35.Fairbrother WG, Yeh RF, Sharp PA, Burge CB. Predictive identification of exonic splicing enhancers in human genes. Science. 2002;297:1007. doi: 10.1126/science.1073774. [DOI] [PubMed] [Google Scholar]
- 36.Zhu J, Shendure J, Mitra RD, Church GM. Single molecule profiling of alternative pre-mRNA splicing. Science. 2003;301:836. doi: 10.1126/science.1085792. [DOI] [PubMed] [Google Scholar]
- 37.Ule J, Ule A, Spencer J, Williams A, Hu J-S, Cline M, Wang H, Clark T, Fraser C, Ruggiu M, et al. Nova regulates brain-specific splicing to shape the synapse. Nat. Genet. 2005;37:844. doi: 10.1038/ng1610. [DOI] [PubMed] [Google Scholar]
- 38.Lamba JK, Adachi M, Sun D, Tammur J, Schuetz EG, Allikmets R, Schuetz JD. Nonsense mediated decay downregulates conserved alternatively spliced ABCC4 transcripts bearing nonsense codons. Hum. Mol. Genet. 2003;12:99. doi: 10.1093/hmg/ddg011. [DOI] [PubMed] [Google Scholar]
- 39.Winter J, Lehmann T, Krauss S, Trockenbacher A, Kijas Z, Foerster J, Suckow V, Yaspo M-L, Kulozik A, Kalscheuer V, et al. Regulation of the MID1 protein function is fine-tuned by a complex pattern of alternative splicing. Hum. Genet. 2004;114:541. doi: 10.1007/s00439-004-1114-x. [DOI] [PubMed] [Google Scholar]
- 40.Wittmann J, Hol EM, Jäck H.-M. hUPF2 silencing identifies physiologic substrates of mammalian nonsense-mediated mRNA decay. Mol. Cell Biol. 2006;26:1272. doi: 10.1128/MCB.26.4.1272-1287.2006. [DOI] [PMC free article] [PubMed] [Google Scholar]
- 41.Noh SJ, Lee K, Paik H, Hur CG. TISA: tissue-specific alternative splicing in human and mouse genes. DNA Res. 2006;13:229. doi: 10.1093/dnares/dsl011. [DOI] [PubMed] [Google Scholar]
- 42.Alissa R, Xing Y, Alekseyenko A, Modrek B, Lee C. Evidence for a subpopulation of conserved alternative splicing events under selection pressure for protein reading frame preservation. Nucleic Acids Res. 2004;32:1261. doi: 10.1093/nar/gkh284. [DOI] [PMC free article] [PubMed] [Google Scholar]
- 43.Pan Q, Saltzman AL, Kim YK, Misquitta C, Shai O, Maquat LE, Frey BJ, Blencowe BJ. Quantitative microarray profiling provides evidence against widespread coupling of alternative splicing with nonsense-mediated mRNA decay to control gene expression. Genes Dev. 2006;20:153. doi: 10.1101/gad.1382806. [DOI] [PMC free article] [PubMed] [Google Scholar]
- 44.Kan Z, Garrett-Engele PW, Johnson JM, Castle JC. Evolutionarily conserved and diverged alternative splicing events show different expression and functional profiles. Nucleic Acids Res. 2005;33:5659. doi: 10.1093/nar/gki834. [DOI] [PMC free article] [PubMed] [Google Scholar]
- 45.Xu Q, Modrek B, Lee C. Genome-wide detection of tissue-specific alternative splicing in the human transcriptome. Nucleic Acids Res. 2002;30:3754. doi: 10.1093/nar/gkf492. [DOI] [PMC free article] [PubMed] [Google Scholar]
- 46.Yeo G, Holste D, Kreiman G, Burge CB. Variation in alternative splicing across human tissues. Genome Biol. 2004;5:R74. doi: 10.1186/gb-2004-5-10-r74. [DOI] [PMC free article] [PubMed] [Google Scholar]
- 47.Lewis B, Green R, Brenner S. Evidence for the widespread coupling of alternative splicing and nonsense-mediated mRNA decay in humans. Proc. Natl Acad. Sci. USA. 2003;100:189. doi: 10.1073/pnas.0136770100. [DOI] [PMC free article] [PubMed] [Google Scholar]
- 48.Tress ML, Martelli PL, Frankish A, Reeves GA, Wesselink JJ, Yeats C, Olason PL, Albrecht M, Hegyi H, Giorgetti A, et al. The implications of alternative splicing in the ENCODE protein complement. Proc. Natl Acad. Sci. USA. 2007;104:5495. doi: 10.1073/pnas.0700800104. [DOI] [PMC free article] [PubMed] [Google Scholar]
- 49.Melamud E, Moult J. Stochastic noise in splicing machinery. Nucleic Acids Res. 2009 doi: 10.1093/nar/gkp471. this issue. [DOI] [PMC free article] [PubMed] [Google Scholar]
- 50.Modrek B, Resch A, Grasso C, Lee C. Genome-wide detection of alternative splicing in expressed sequences of human genes. Nucleic Acids Res. 2001;29:2850. doi: 10.1093/nar/29.13.2850. [DOI] [PMC free article] [PubMed] [Google Scholar]
- 51.Kan Z, States D, Gish W. Selecting for functional alternative splices in ESTs. Genome Res. 2002;12:1837. doi: 10.1101/gr.764102. [DOI] [PMC free article] [PubMed] [Google Scholar]
- 52.Neverov AD, Artamonova I, Nurtdinov RN, Frishman D, Gelfand MS, Mironov AA. Alternative splicing and protein function. BMC Bioinformatics. 2005;6:266. doi: 10.1186/1471-2105-6-266. [DOI] [PMC free article] [PubMed] [Google Scholar]
- 53.Drummond DA, Raval A, Wilke CO. A single determinant dominates the rate of yeast protein evolution. Mol. Biol. Evol. 2006;23:327. doi: 10.1093/molbev/msj038. [DOI] [PubMed] [Google Scholar]
- 54.Wagner A. Robustness and evolvability in living Systems. 2005;195 [Google Scholar]
Associated Data
This section collects any data citations, data availability statements, or supplementary materials included in this article.


