Abstract
We used acoustic clicks to study the impulse response of the neurophonic potential in the barn owl's nucleus laminaris. Clicks evoked a complex oscillatory neural response with a component that reflected the best frequency measured with tonal stimuli. The envelope of this component was obtained from the analytic signal created using the Hilbert transform. The time courses of the envelope and carrier waveforms were characterized by fitting them with filters. The envelope was better fitted with a Gaussian than with the envelope of a gamma-tone function. The carrier was better fitted with a frequency glide than with a constant instantaneous frequency. The change of the instantaneous frequency with time was better fitted with a linear fit than with a saturating nonlinearity. Frequency glides had not been observed in the bird's auditory system before. The glides were similar to those observed in the mammalian auditory nerve. Response amplitude, group delay, frequency, and phase depended in a systematic way on click level. In most cases, response amplitude decreased linearly as stimulus level decreased, while group delay, phase, and frequency increased linearly as level decreased. Thus the impulse response of the neurophonic potential in the nucleus laminaris of barn owls reflects many characteristics also observed in responses of the basilar membrane and auditory nerve in mammals.
INTRODUCTION
Clicks are simple but powerful stimuli to study auditory processing because the temporal occurrence of the click is precisely defined. A click is also an appropriate stimulus to measure the impulse response of the auditory system, for example at the level of the basilar membrane (Lin and Guinan 2004; Recio et al. 1998) or the eighth nerve (Carney et al. 1999; deBoer and Jongh 1978; Lin and Guinan 2004; Temchin et al. 2005). Clicks have also been used to characterize responses in the cochlear nucleus (Burkard and Palmer 1997; Koeppl 1997b), the medial superior olive (Galambos et al. 1959), and its avian analogue, the nucleus laminaris (Schwarz 1992; Wagner et al. 2005). The click-evoked response can also be studied in local field potentials, which include contributions of many brain structures in parallel (Beattie 1988; Burkard and Voigt 1989; Don et al. 1996).
Stimulation of the ear with a click typically evokes an oscillatory neuronal response (Kiang et al. 1965; Robles and Ruggero 2001; Wagner et al. 2005). The ringing frequency is close to the tuning frequency determined with tonal stimulation. In mammals, the ringing frequency is not constant in time but glides upward or downward (Carney et al. 1999). These frequency glides match descriptions of basilar membrane responses (Carney et al. 1999; deBoer and Nuttall 2000; Recio et al. 1998). Frequency glides had not been reported in the auditory system of birds before.
Moreover, because clicks constitute a brief signal, onset and offset effects also play a role in the evoked response. Recio et al. (1998) observed reverberations after acoustically stimulating the ear with a click. Furthermore, when the intensity of the click is raised, more low- than high-frequency excitation is added to the response, causing the best frequency of a neuron to shift downwards (Gleich 1994; Johnstone et al. 1986).
In birds, the eighth nerve projects to both the nucleus angularis and the nucleus magnocellularis. Only the latter nucleus preserves the phase locking present in the nerve (Carr and Boudreau 1993; Koeppl 1997a). In the barn owl (hereafter referred to as “the owl”) with an upper hearing range of ∼13 kHz (Dyson et al. 1998), phase locking is observed up to at least 9 kHz (Koeppl 1997a). Each magnocellular axon divides into two main collaterals with one branch innervating the ipsilateral nucleus laminaris and the other one the contralateral nucleus laminaris. Magnocellular spikes are synchronized and form a high-amplitude extracellular local field potential, the neurophonic potential. The neurophonic potential in nucleus laminaris is easy to record and very stable (Sullivan and Konishi 1986; Wagner et al. 2005). A neurophonic potential has been seen in many animals in areas where phase locking occurs (Bojanowski et al. 1989; Chimento and Schreiner 1990; Henry 1996; Schwarz 1992; Snyder and Schneider 1984).
The gamma-tone filter provides a good model for the impulse response of the ear or the peripheral auditory system (Aertsen and Johannesma 1980; deBoer and Jongh 1978; Patterson et al. 1992), although details are still a matter of discussion (Carney et al. 1999; Irino and Patterson 2001; Tan and Carney 2003). Another filter that has especially been used to fit spatial receptive fields in the visual system is the Gabor filter (Marcelja 1980). A frequency glide may be incorporated into each type of filter. Such filters were used to analyze the neurophonic potential in the barn owl's nucleus laminaris in response to acoustic clicks, to characterize the impulse response, and to study its dependence on click level.
METHODS
The experiments were conducted at the Department of Biology of the University of Maryland at College Park. Four barn owls (Tyto alba pratincola) were used to collect the data presented in this study. The procedures described here conform to National Institutes of Health guidelines for animal research and were approved by the animal care and use committee of the University of Maryland. Most animals were used in two or three separate experiments spaced approximately a week apart. Anesthesia was induced by 0.07 ml intramuscular injections of 100 mg/kg ketamine hydrochloride (Ketavet, Phoenix, St. Joseph, MO) and by 0.08 ml injections of 20 mg/kg xylazine (Xyla-ject, Phoenix). Supplementary doses of ketamine and xylazine (0.04 ml) were administered to maintain a suitable plane of anesthesia. Body temperature was measured by a probe inserted into the owl's cloaca and kept constant at 39°C by a feedback-controlled heating blanket wrapped around the owl's body (Harvard Instruments, Braintree, MA). An electrocardiogram was recorded to monitor the bird's plane of anesthesia. At the end of experiments after which the animal was allowed to recover, 0.12 ml of 0.3 mg/ml buprenorphine hydrochloride (Buprenex, Reckitt and Colman Products, Richmond, VA) was administered.
Surgery and stereotaxis
Initially, the owl's head was firmly held in a controlled position by a custom-designed setup using ear bars and a beak holder. Then a metal headplate and a short metal pin marking a standardized zero point were permanently glued to the skull. After this, the ear bars and the beak holder were removed, and the head was held firmly by the headplate alone. An opening was made in the skull around the desired area relative to the zero point, and the dura mater was cut open, taking care to avoid blood vessels. Each electrode was zeroed and moved in defined amounts in the rostrocaudal and mediolateral axes before being driven down into the brain. In some cases, the electrode was angled to facilitate access to extremely medial or lateral regions of the brain stem.
Electrodes and recording setup
Owls were placed on a vibration-insulated table within a sound-attenuating chamber (IAC, New York, NY) that was closed during all recordings. Lights were switched off. Commercial Epoxylite-coated tungsten electrodes (Frederick Haer) were used, preferably with impedances between 2 and 6 MΩ. A grounded silver chloride pellet, placed under the animal's skin around the incision, served as the reference electrode. Electrode signals were amplified and filtered by a custom-built headstage and amplifier. The recording was then passed in parallel to an oscilloscope, a threshold discriminator [SD1, Tucker-Davis Technologies (TDT), Gainesville, FL] and an A/D converter (DD1, TDT) connected to a personal computer via an optical interface (OI, TDT). A continuously refreshed, software-generated display of the waveforms that triggered TTL pulses aided in trigger judgment. Analogue waveforms were saved for off-line analysis.
Stimulus generation and calibration
Acoustic stimuli were digitally generated by custom-made software (Xdphys, written in Dr. M. Konishi's lab at the California Institute of Technology, Pasadena, CA) driving a signal-processing board (DSP2, TDT). After passing a D/A converter (DD1, TDT) and an anti-aliasing filter (FT6-2, corner frequency: 20 kHz, TDT), the signals were variably attenuated (PA4, TDT), impedance-matched (HB6, TDT) and attenuated by an additional fixed amount before being fed to commercial miniature earphones. Two separate signals could be generated, passing through separate channels of associated hardware and driving two separate earphones. The earphones were housed in custom-built, calibrated, and closed sound systems, inserted into the owl's left and right ear canals, respectively. Sound pressure levels were calibrated individually at the start of each experiment, using built-in miniature microphones (Knowles EM3068, Ithasca, IL). In most experiments the analogue stimulus waveforms were saved.
Stimuli
Auditory stimuli were clicks, noises and tones. All stimuli were digitally created with a sampling rate of 48,077 Hz (sampling interval: 20.8 μs).
Clicks
Clicks were digitally produced and then processed by the TDT systems. Clicks had a rectangular form. Several parameters of the click stimulus could be varied: intensity (maximally 0 dB attenuation, corresponding to 65 dB SPL spectrum level at 5 kHz), duration (1–4 samples equivalent to 20.8–83.2 μs), and polarity. A condensation click at 0 dB attenuation and two samples of duration served as a reference. The click stimulus was repeated 128 times.
Noise
The noise had a spectrum between 0.1 and 13 kHz, 5-ms rise/fall times, and duration of 100 ms. The overall level of the noise was between 20 and 60 dB SPL.
Tones
Tone bursts of different frequencies (500- to 9,500-Hz range, 50- to 500-Hz steps) were presented monaurally and binaurally. The duration was 100 ms with 5-ms rise/fall times and a constant starting phase. The spectrum level of the tones was in the range of 20–60 dB SPL.
Recording protocol
While lowering the electrode, noise bursts were presented as search stimuli. Once auditory responses were discernible, tonal stimuli of varying frequency were applied from both the ipsi- and contralateral side to judge the position of the electrode. At a given recording site, the following protocol was tested to obtain a data set.
FREQUENCY TUNING.
Average rates in response to three to five repetitions of each stimulus were calculated within the stimulus window. Frequencies typically covered a range from 500 to 9,500 Hz. This paradigm was chosen to derive iso-intensity frequency response curves.
TUNING TO INTERAURAL TIME DIFFERENCE (ITD).
ITD tuning curves (“ITD curves”) were calculated from responses to either tone bursts presented binaurally at the estimated best frequency or to stimulation with noise bursts at a level ≥20 dB above threshold. Each stimulus was again repeated three to five times. ITDs covered about two periods at the best frequency of a location. The tuning to ITD was judged by a Rayleigh test (P < 0.05).
RESPONSES TO CLICKS.
The (spontaneous) activity from 10 ms before click presentation as well as the (driven) activity for 10 ms after click presentation was stored for typically 128 repetitions. In the following, the time axis will be adjusted so that the click presentation starts at 0 ms.
SIGNAL ANALYSIS.
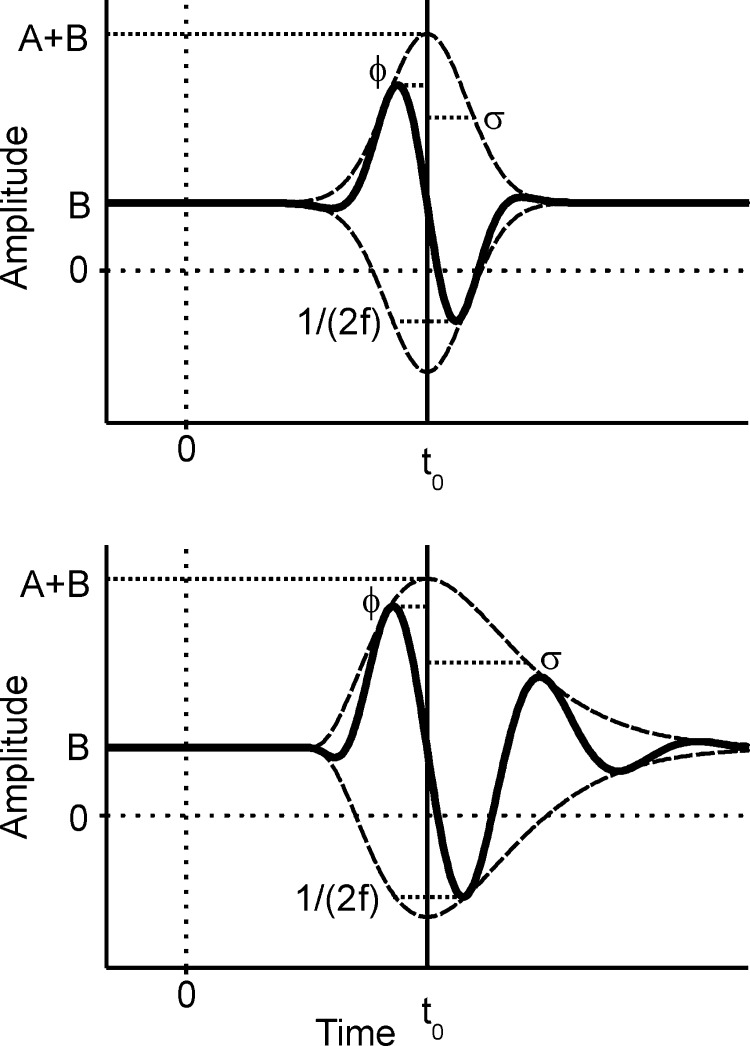
A crude signal analysis was done during the experiment to determine the frequency and ITD tuning. After the experiment, the responses were quantitatively analyzed with custom-made software using MATLAB (MathWorks, Natick, MA). The time signal from −0.16 to 9.92 ms (476 points, 0 padding to 512 points) was Fourier transformed, and the different frequency components were separated by filters. Inverse Fourier transforms resulted in both low- and high-frequency components. These components were fitted to a gamma-tone function and a Gabor function (Fig. 1) with the MATLAB function nlinfit. These two functions were chosen because they can fit an oscillatory response as seen in the click response.
FIG. 1.
The Gabor (top) and the gamma-tone (bottom) functions. These functions were used to fit the oscillatory responses obtained with click stimulation. Note that the length of the dotted line near 1/(2f) corresponds to the half of the oscillation period. The other parameters are explained in the text.
The Gabor function gab(t) is formally the product of a Gaussian (envelope) and a cosine (carrier), and it may be expressed as
 |
(1) |
The six parameters of the Gabor function may be divided in two classes. Two parameters describe the carrier (phase φ and frequency f). Four parameters belong to the enveloping function (offset B, amplitude A, width of the envelope σ, and latency t0, equivalent to the time of maximum of the envelope). Note that t0 may be regarded as equivalent to the group delay as used by Fitzgerald et al. (2001) because group delay represents the center of the envelope.
We define the gamma-tone function gam(t) as
 |
(2) |
for times t > t0 − tmax and gam(t) = 0 otherwise, where tmax = σ(γ − 1). Note that the γ is a shape parameter. The higher γ is, the more symmetric in time is the envelope of the gamma-tone function. The coefficient γ was not fitted but remained fixed. In the following analyses, mainly fits obtained by using γ = 0 will be considered. All other parameters of the gamma-tone function are equivalent in description to those of the Gabor function.
Both filters may also be implemented with a gliding frequency. Because filters with a frequency changing with time are also known as chirping filters, we will refer to the resulting filter functions as Gabor-chirp and gamma-chirp functions. We tried to fit the changes of instantaneous frequency with time with two different approaches: a linear frequency glide as observed in Carney et al. (1999) and a saturating nonlinearity as proposed by Irino and Patterson (2001). The linear frequency glide might be derived from the cosine part of (1) and (2) by changing the argument in the cosine function, the phase, to
 |
(3) |
The factor c, called gliding factor here, describes the slope of the glide. The instantaneous frequency at time t is computed from the derivative (with respect to time) of the phase in Eq. 3, divided by 2π. Therefore the time-dependent instantaneous frequency is f + c (t − t0), and the fit parameter f denotes the instantaneous frequency at time t0.
The saturating nonlinearity was implemented according to Eq. 2 in Irino and Patterson (2001)
 |
(4) |
where time t is time after click onset. Only times larger than the delay ts were considered. The delay ts was estimated from the signal-front-delay to be 1.88 ± 0.23 (SD) ms. The instantaneous frequency IF will converge to IFsat for very large values of time. The nonlinear gliding factor is cnl. To optimize the fit, ts was allowed to vary within the mean ± SD of the signal-front delay (1.6 and 2.1 ms), while the parameters IFsat, cnl were varied freely. The individual fits were judged by their mean square errors and coefficients of determination.
The Hilbert transform was used to decompose the high-frequency component of the click response into its envelope and carrier. The envelope of a click response x(t) is computed from the absolute value of the analytic signal x(t) + i y(t) where y(t) is the Hilbert transform of x(t). The instantaneous frequency (IFH) is computed from the derivative of the phase of the analytic signal by dividing the phase difference Δ(angle) between two adjacent sample points by the sampling interval Δt
 |
(5) |
A running window with a size of two sampling intervals was used to smooth the output.
Click-evoked responses were only included in the analysis if at least three successive data points were higher than the mean plus 2 SD of the spontaneous activity as measured in the 9.56-ms interval before click presentation. In addition, they were only included if the fit with the fitting function converged.
Statistical analysis
The fits were quantified by the goodness of fit with a χ2 statistics
 |
(6) |
The variance σn2 was calculated from the 128 trials at each time point n = 1,…, N. The observation On is the high-pass filtered signal (mean of 128 trials), while the expectation En reflects the fitted signal. N and M are the number of points per trial and the number of fit parameters, respectively. For example, the Gabor function has M = 6 parameters. Adding a parameter for the frequency glide leads to M = 7. A typical value for N is 70. χ2 represents the χ2 error.
Electrolytic lesions and histology
In the last or the last two experiments with each animal, electrolytic lesions (2 μA, 10 s) were made. After a survival time of several hours to 1 wk, the owl was killed by an overdose of the anesthetic and perfused transcardially with saline, followed by 4% paraformaldehyde in phosphate buffer. The brain was dissected out and cut either in the same (approximately transverse) plane as the electrode penetrations or in a plane parallel to the iso-frequency axis (approximately rostromedial to caudolateral). Sections were mounted on gelatin-coated slides and stained with cresyl violet. All sections were examined at low magnification to identify electrode tracks and lesions.
RESULTS
This report is based on neurophonic responses recorded in four barn owls. The quantitative analysis that determined the best filter was based on 161 data sets. For a subset of 82 data sets, systematic information on click level was available. All responses originated from nucleus laminaris as judged by physiological criteria. In some cases, the recording position was verified by electrolytic lesions.
Qualitative description of click responses
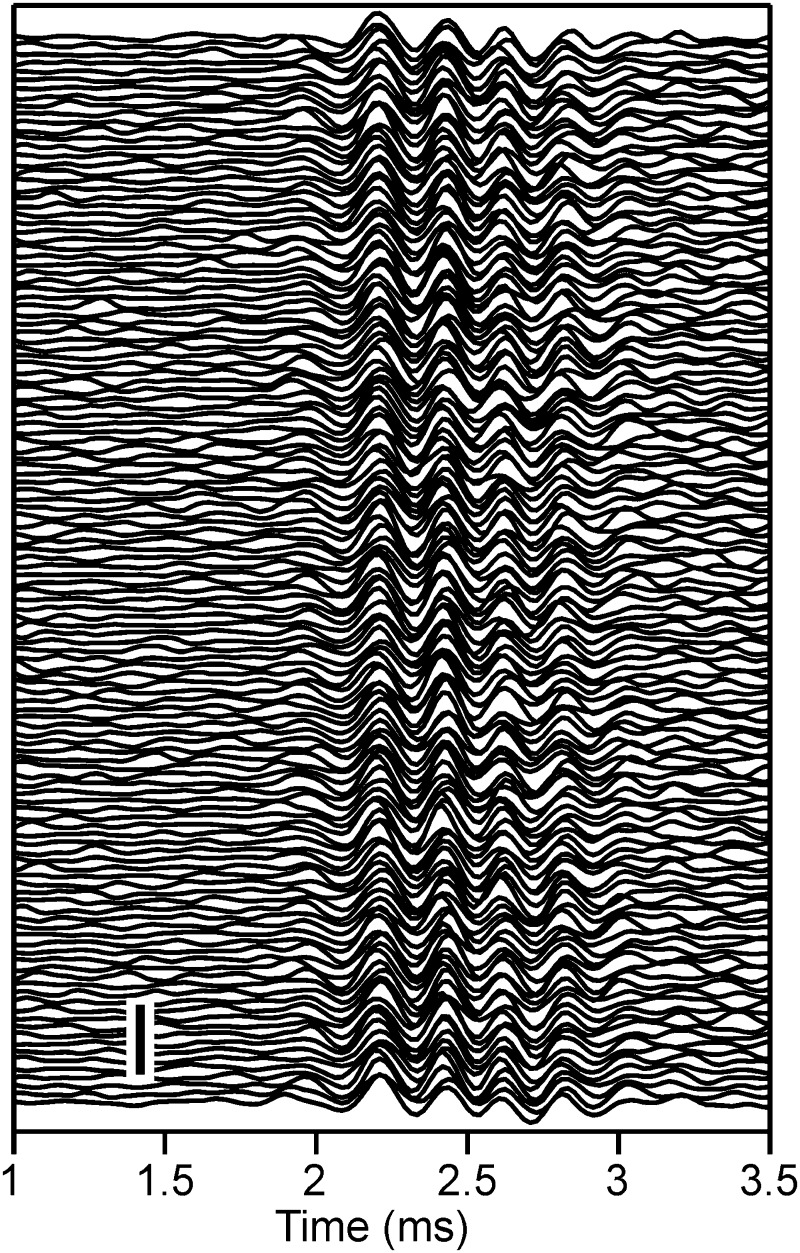
The typical response to a click was an oscillation with latency of ∼1.9 ms and several oscillation cycles (Fig. 2). At a given recording location and for a given click level, the response latency was so constant that the analogue responses to the 128 trials could be averaged without losing the oscillations. Note, for example, that the troughs and peaks of the responses in the individual repetitions coincided (Fig. 2). Quantitative analyses showed a temporal jitter of the central local extrema in the range of one or two sampling points, that is, ±20.8 to 41.6 μs (see also Wagner et al. 2005). This jitter was small compared with the oscillation periods of about 150–300 μs considered in this study. There was also some jitter in the amplitude of the responses. Nevertheless, the occurrence of the driven responses that started at ∼2 ms was clearly visible in each trial (Fig. 2). This stability of the response was typical. Therefore mainly averaged data were used in the quantitative analysis.
FIG. 2.
Trial-to-trial variability of click responses. The click stimulus (40-μs duration, 0-dB attenuation, condensation click, presented at 0 ms) was repeated 128 times. The responses obtained are plotted stacked, and they show almost no temporal jitter. Scale bar: 2.5 mV.
The averaged click-evoked responses usually had a complex form. The envelope of the oscillatory click response had a smooth onset, reached a maximum within a millisecond or less, and then decreased (Figs. 2 and 3, A, B, F, G, K, and L). Responses typically lasted some 2–3 ms (Fig. 3, A, F, and K). Sometimes the waveform did not smoothly increase and then decrease, but the first small decrease was followed by a second increase (Fig. 3, K and L). Such two-lobed responses had been observed before for the basilar membrane (Recio et al. 1998) and auditory-nerve fibers (Lin and Guinan 2004). When the response fell below some threshold between the first and second lobe, in other words, when the second lobe could be separated in time from the first lobe, we analyzed the response in the first lobe only. The exact form of the response (starting polarity, strength) depended on the position of the recording electrode within the nucleus (Wagner et al. 2005; unpublished data). We shall analyze these functional properties separately, and here we concentrated on the aspects induced by varying click parameters.
FIG. 3.
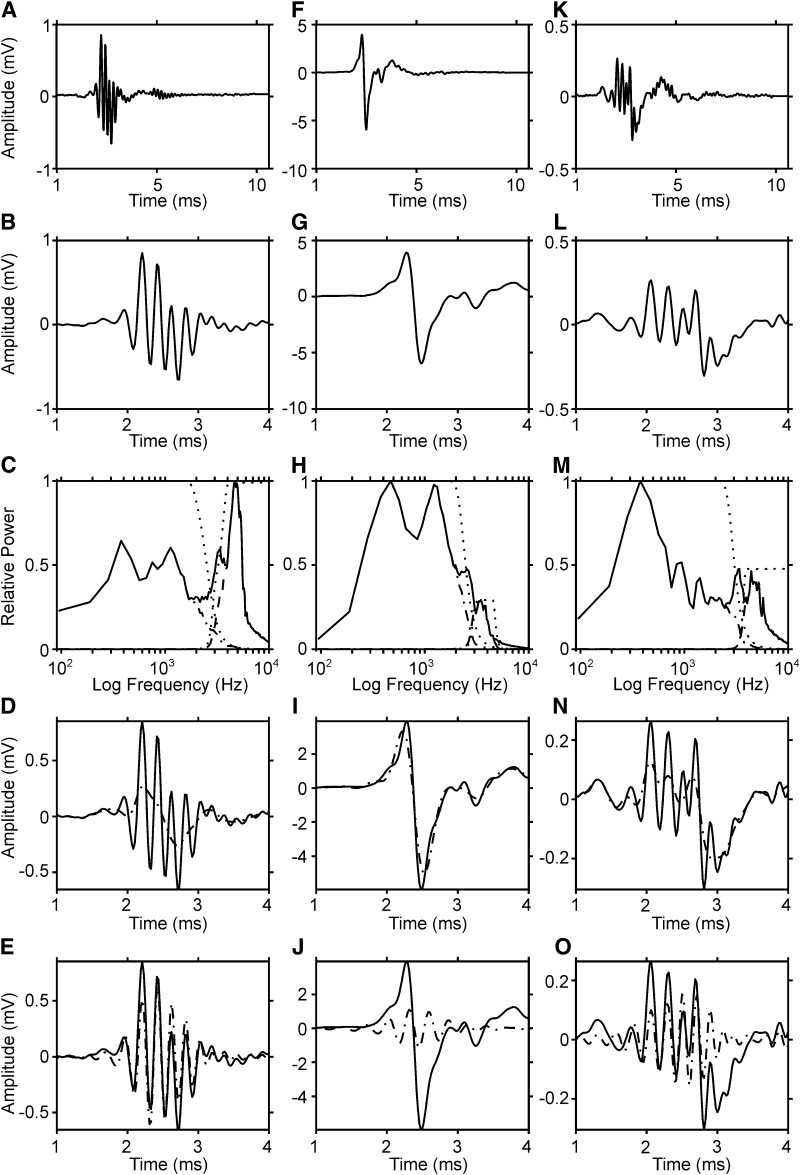
Examples of click responses. A–E: typical example from the middle of nucleus laminaris exhibiting a large high-frequency component. B: same response as in A but at higher temporal resolution. C: power spectral density (—) obtained from the Fourier transform of the response from −0.16 to 9.92 ms. The low- and high-frequency filters used for separation in D and E, respectively, are indicated by ···. · - · and - - -, the results after low- and high-pass filtering, respectively. D: low-pass filtered click response (· - ·) as compared with original response (—). E: high-pass filtered click response (· - ·) as compared with original response (—). F–J: a typical response from the border of nucleus laminaris. K–O: a 2nd example from the middle of the nucleus. The plots and the symbols in F–O resemble those of A–E. Although the waveforms are very different in these 3 examples, each click response has 1 high-frequency component and ≥1 low-frequency components. All clicks were condensation clicks.
The click response could be separated into several components: a low-frequency component characterized by a mainly biphasic inflection, going up first and then down in the examples shown in Fig. 3, D, I, and N; overlying this low-frequency component was a higher-frequency oscillation (Fig. 3, E, J, and O). The high-frequency component dominated in the waveform of the example shown in Fig. 3, A–E, while the low-frequency component masked the high-frequency component in the example shown in F–J. Note the two high-frequency maxima occurring in the spectrum of the example shown on the right (Fig. 3M). More than one high-frequency peak was observed in ∼10% of the cases, and the appearance of two or more peaks was typically correlated with a two-lobed waveform.
Quantitative analysis of click responses: Fourier transformation and high-pass filtering
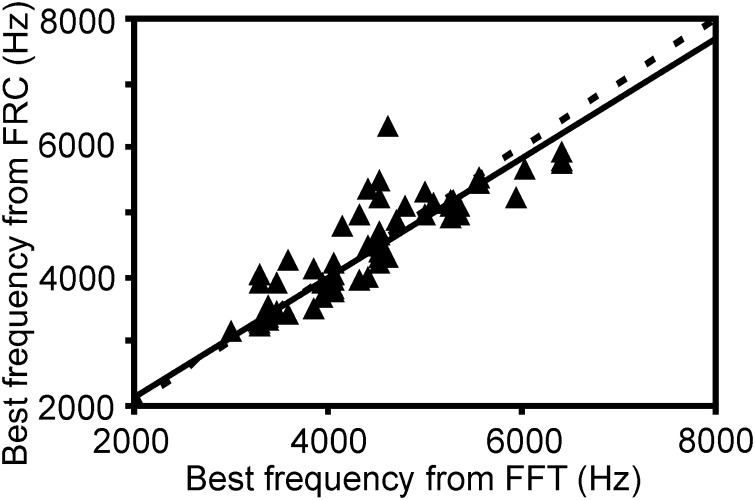
While interesting observations could be made directly from the raw data, we obtained a better insight into the dependence of the click responses on the stimulus parameters by a quantitative analysis. Fourier-analysis of the click-evoked responses confirmed the impression from visual inspection. Indeed the Fourier analysis often suggested the presence of several frequency components (Fig. 3, C, H, and M). For the present analysis, we separated a high-frequency component (local maximum at frequencies >3 kHz) from the low-frequency components (local maxima at frequencies <3 kHz), taking into account that the recordings were from the high-frequency region (3–8 kHz) in the nucleus laminaris. If the limiting frequency proved to be too low or too high, as for example in the case shown in Fig. 3, A–E, the cut-off frequency was adjusted properly. We considered only the high-frequency component further in this report because it matched the frequency tuning as measured by iso-intensity frequency response functions (Fig. 4).
FIG. 4.
Comparisons of best frequencies (BFs) obtained with clicks and tonal stimuli. BFs obtained from iso-intensity frequency response curves (FRC) matched BFs obtained from the FFT at maximum power in high-frequency component of click response (65 cases at similar stimulus levels). Note the close correspondence between the 2 independent measurements with a correlation coefficient of 0.88, a y offset of 260 Hz and a slope of 0.93 [regression line (—)]. - - -, equivalence on the 2 axes.
The amplitude spectrum of the response shown in Fig. 3A revealed a strong high-frequency component around 5 kHz, a weaker component around 3 kHz, and two low-frequency components: one around 1,000 Hz and the other one around 400 Hz (Fig. 3C). After separation with the filters, an inverse Fourier transformation was performed for the high- and low-frequency components separately (Fig. 3, D and E). This separation demonstrated that a biphasic low-frequency component rides under the high-frequency oscillation (Fig. 3D). The high-frequency component dominated the click-evoked response in this case (Fig. 3E).
There were cases in our sample in which the low-frequency component was even weaker than in the case shown in Fig. 3, A–E, but there were also cases in which the low-frequency component dominated the response and the high-frequency component was barely visible (F–J), and there were intermediate cases (K–O). In the example shown in the middle column (Fig. 3, F–J), the low-frequency, biphasic component clearly came to sight after filtering (I), but the high-frequency component became even clearer (J).
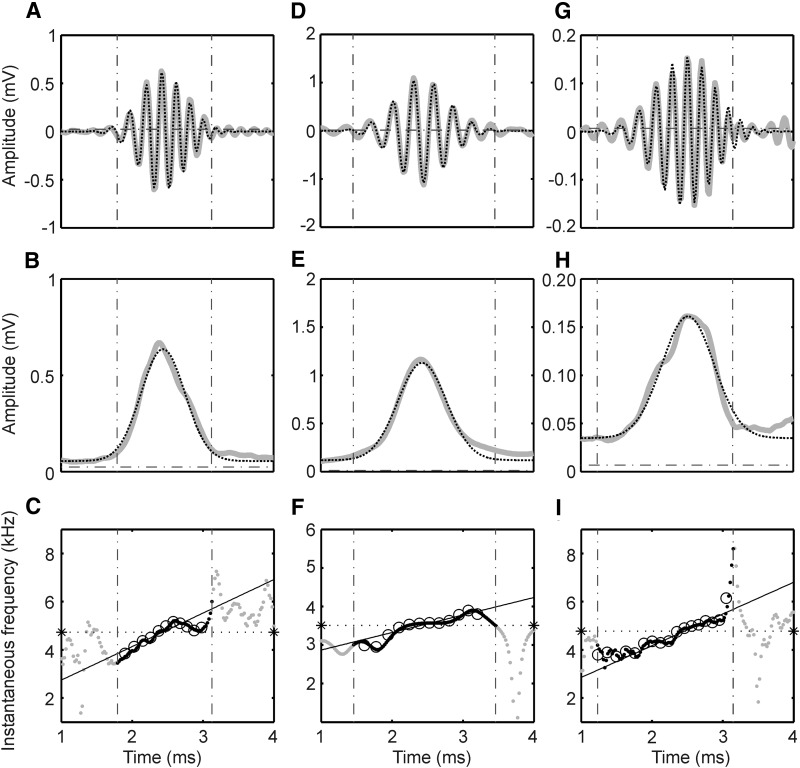
The time course of the high-frequency component was fitted to functions that approximate transient oscillatory responses. Such functions are the Gabor function, the gamma-tone function, the Gabor-chirp function and the gamma-chirp function. In this way, the impulse response and its relation to the parameters of the fitting functions as outlined in methods could be studied. The fits showed a close resemblance with the time course of the high-pass filtered response (Fig. 5, A, D, and G and Supplemental Fig. S11 ). Although the fits were similar to the data and among each other, a quantitative analysis demonstrated statistically significant differences in fitting quality between the different filter functions.
FIG. 5.
Fits of high-pass filtered click responses and instantaneous frequency. A, D, and G: fits of high-pass filtered responses (gray lines) as shown in Fig. 3, E, J, and O with Gabor-chirp functions (dotted lines). The vertical dot-dashed lines limit the time interval when the magnitude of the envelope was higher than 10% of the maximum of the envelope. The horizontal dot-dashed lines represents the mean spontaneous activity calculated during 9.56 ms before stimulus onset. B, E, and H: envelopes of the analytic signals created using the Hilbert transform (gray lines). The dotted lines are the fits with Gaussian functions as reflected in the Gabor filter. The dot-dashed lines in B, E, and H represent the mean spontaneous activity. C, F, and I: instantaneous frequencies. The black dots (within the 10% window) and the gray dots (outside) show the instantaneous frequencies from the Hilbert transformation. The open circles show the instantaneous frequencies as calculated from the 0 crossings. The solid lines denote the instantaneous frequency calculated from the Gabor-chirp fit; the stars and the horizontal dotted lines demark the instantaneous frequency at the group delay. The BFs were, A: 4,876 Hz, B: 3,450 Hz, C: 4,975 Hz.
To quantify the quality of the fits, we used the amplitude values of the responses obtained in a time interval that started when the envelope of the response exceeded 10% of the maximal amplitude of the envelope and ended when the envelope fell <10% of the maximal envelope. In this interval the goodness of fit was calculated. When the envelope fell <10% after 4 ms, the response was not considered in our analysis.
In the example shown in Figs. 5A and S1, A–C, that corresponds to the example in Fig. 3, left, the goodness of fit was best for the Gabor-chirp function as determined with the χ2 error (18), second best for the Gabor function (29), and worse for the gamma-chirp filter (60) and the gamma-tone filter (67). The goodness of fit was similar for the example shown in Figs. 5D and S1, E–G (corresponding to the example in Fig. 3, middle). Here, again the Gabor-chirp (22) function and the Gabor function (65) fitted the data better than the gamma-chirp (76) and the gamma-tone functions (93). For the example shown in Figs. 5G and S1, I–K (corresponding to the example in Fig. 3, right), the Gabor-chirp provided again the best fit (13), with the gamma-chirp next best (36) while the nonchirping filters were worse [Gabor filter (95), gamma-tone filter (110)].
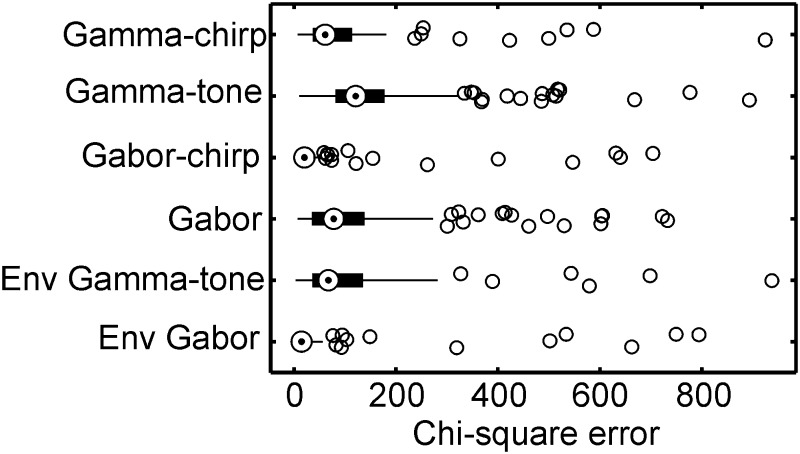
The ranges of these error values were representative for the whole sample (Fig. 6). If all recordings were taken into account, the Gabor-chirp function provided the best fit (median: 20.0), followed by gamma-chirp function (median: 61.3), the Gabor function (median: 77.9), and the gamma-tone function (median: 120.8). Because both chirping filters provided a better fit than the filters with a constant frequency, is was clear that in most cases the instantaneous frequency changed with time during the response. All the differences between the filter types were highly significant as tested by a Wilcoxon matched-pairs signed-rank test (Fig. 6; 132 cases, all P values <0.01).
FIG. 6.
Goodness-of-fit and χ2 error. Whisker plots of the fits with the 4 filter types: gamma-chirp, gamma-tone, Gabor-chirp, and Gabor. Note that the chirping filters have the same envelopes as nonchirping filters. The whisker plots show the median (circle with dot), the 25 and 75% quartiles (box), 1.5 times the value of the inter-quartile range (thin lines) and the outliers (dots). Note that the Gabor-chirp filter provided the best fit and that the envelope was better fitted by the Gabor than the gamma-tone filter. The statistics are based on 132 cases.
Quantitative analysis of click responses: Hilbert transform
The Hilbert transform (see methods) was used to decompose the high-frequency component of the click response into its envelope and carrier. The absolute value of the analytic signal created using the Hilbert transform represents the envelope (Fig. 5, B, E, and H), and the temporal derivative of the phase of the analytic signal is the instantaneous frequency (Fig. 5, C, F, and I).
Because the frequency glide does not influence the envelope, only the goodness of fits of the envelopes of Gabor and gamma-tone filters needed to be compared. For the examples shown in Fig. 3, the envelope of the Gabor filter, a Gaussian, yielded a closer fit than the envelope of the gamma-tone filter (compare Fig. 5, B, E, and H, with S1, D, H, and L). In the whole sample, the median χ2 error for the envelope of the Gabor filter was 14.5, while it was 67.0, or 362% worse, for the envelope of the gamma-tone filter (Fig. 6). This difference was highly significant (Wilcoxon matched-pairs signed-rank test, 132 cases, P < 0.0001).
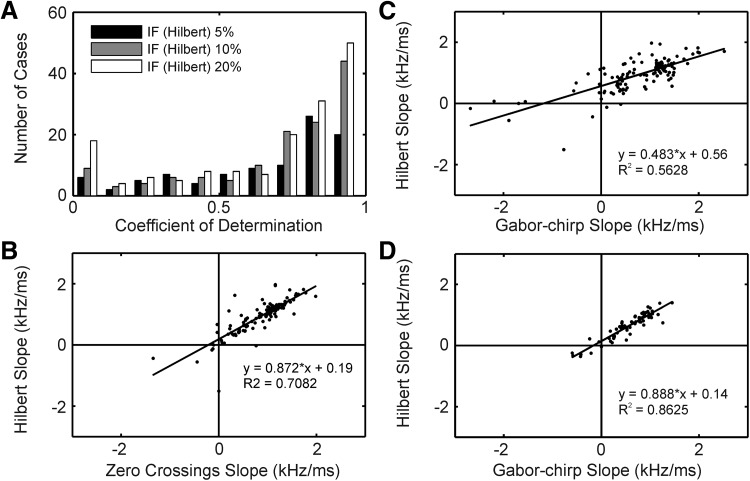
The instantaneous frequency IFH as derived from the phase of the analytic signal typically increased with time (Fig. 5, C, F, and I). In several cases, large and fast phase changes were observed at one or several instants in time (Fig. 5, C and I). These fast changes occurred mainly at low amplitudes of the envelope and at bumps or at notches in the envelope (Fig. 5, B, E, and H). Such fast changes did occur less often around the maximum of the envelope. In reference to Tan and Carney (2003), we argue that in our data sets as well as in theirs, instantaneous frequency can be estimated most reliably at high values of the amplitude, i.e., around the maximum of the envelope. Here the IFH changed approximately linearly with time. The median of the coefficient of determination in the linear fits was 0.79, and the lower quartile was 0.59 if fits were restricted to time intervals in which the magnitude of the envelope was >10% of the maximum of the amplitude (Fig. 7A). However, there were also some indications in our data that the instantaneous frequency changed faster at the beginning of the response than in the middle of the response. For example, the first point in 88 of 132 cases fell below the linear regression line (see 1st black dot in Fig. 5, C and F). This distribution was highly significantly different from chance (binomial test, P < 0.0001). Therefore the data were also fitted with the saturating function similar to that used by Irino and Patterson (2001). However, when the fit results from the saturating function were compared with those of the linear fits, the linear fits clearly produced better results than the saturating function (median coefficient of determination in linear fits: 0.79, median coefficient of determination in fits with saturating function: 0.57). Therefore we shall only consider the linear fits in the following. The slopes of the linear fits of the change of IFH as a function of time increased in 95% of the cases (Fig. 7B) with a median at 1110 Hz/ms, indicating an upward glide.
FIG. 7.
Instantaneous frequency. A: distributions of the coefficients of determination (R2) obtained from a linear regression on the instantaneous frequency (IF Hilbert) as a function of time (as in Fig. 5, C, F, and I). Distributions are shown for 3 different threshold criteria as explained in the inset. The number of cases (N) were for the 5% criterion: n = 96, for the 10% criterion: n = 132, for the 20% criterion: n = 157. B: slopes (in units of kHz/ms) of the time-dependent instantaneous frequencies. We compared slopes obtained from 0 crossings (0 crossing slope) with those obtained using the Hilbert transform (Hilbert slope). Note the close similarity of the results obtained with the 2 measures. C and D: for the 10% threshold, the Hilbert slopes were better correlated with the slopes taken from the Gabor-chirp fit (Gabor-chirp slope) if the click level was reduced by 20 dB (D, n = 65) than when maximum click level was used (C, n = 132). B–D, inset: the linear-regression equation and the coefficient of determination.
Because IFH is prone to noise, we also checked the glide as reflected in the zero crossings of the high-pass filtered click responses, and we term the resulting instantaneous frequency IFZ. A glide was also obvious in the latter analysis. Moreover, the changes in frequency with time determined from the IFH were highly correlated to the changes in frequency with time determined from the IFZ (Fig. 7B, 132 cases, correlation coefficient = 0.84). This high correlation is also reflected in the close correspondence between the data points of IFH and IFZ in Fig. 5, C, F, and I. The instantaneous frequency was also obtained from the Gabor-chirp fits (IFG). We found a high correlation between the different ways of measuring instantaneous frequency (Fig. 7C). The slope of IFG was highly correlated to the slope of IFH, with 56% of the variability explained (Fig. 7C); even 86% of the variability was explained for click levels reduced by 20 dB compared with the maximum levels used (Fig. 7D).
In addition to assessing the goodness of fit for the 10% threshold criterion, we also evaluated other threshold criteria, for example with respect to the maximum response of the envelope obtained by means of the Hilbert transform (5 or 20%) or with respect to the spontaneous activity (mean value ± 0.5 SD during the last 460 sample points before click presentation). All threshold criteria yielded similar results for fitting the signal or the envelope. In the end, the 10% criterion was chosen for deeper analysis because it turned out to be most robust when click level was varied.
With the 10% criterion, the fit of the slopes of the instantaneous frequency versus time (Fig. 5, C, F, and I) also yielded stable results when we analyzed responses with a 20-dB weaker click level (Fig. 7D), which was not the case for mean ±0.5 SD and 5% of the maximum amplitude. The 10 and 20% criteria gave similar results for this fit, but a narrower time interval was available for analysis of the 20% criterion than for the 10% criterion. Using the 10% criterion, we lost 29 of the 161 data sets of our sample. These losses included cases in which the spontaneous activity was >10% of the maximum of the envelope or the magnitude of the envelope did not fall below the threshold criterion in the relevant time window (1–4 ms) after it had exceeded the threshold.
Dependence on click level
The dependence of the properties of the click-evoked responses on click level will only be presented from the fits with the best filter, the Gabor-chirp function. The results with the other filters were similar. Our sample for the following analyses contained 82 data sets from 41 sites (41 cases with left stimulation, 41 cases with right stimulation) from both brain sides from four owls. Click amplitude was varied ≤50 dB. After applying our 10% threshold criterion and not including cases with less than four different attenuations, 75 sets remained for further analysis. Attenuation steps were 10 dB in 55 cases and 2 dB in 20 cases.
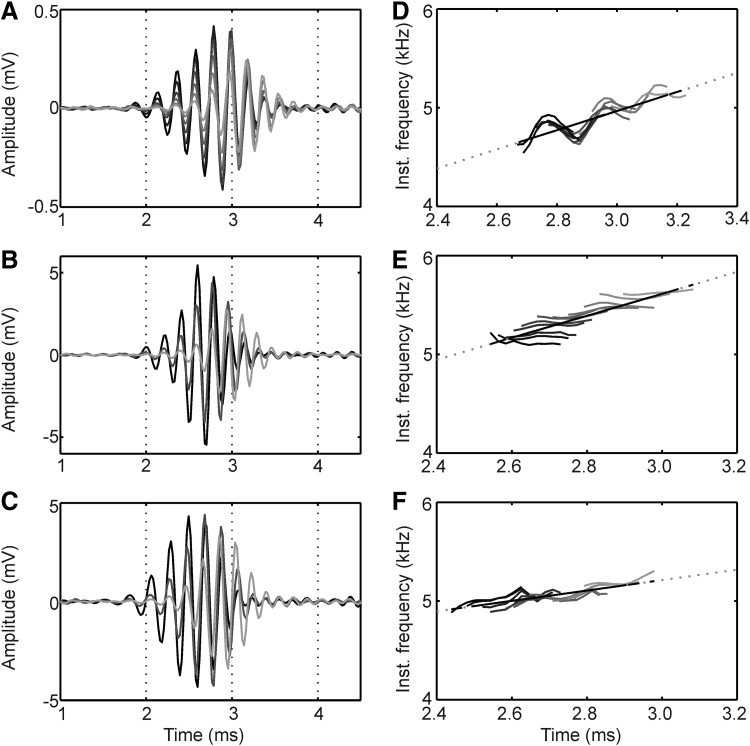
Qualitatively, click level had a clear influence on the group delay t0, the response amplitude A, and the frequency f and phase φ of the response (Figs. 8 and 10), where frequency f refers to the instantaneous frequency at time t0. The maximal response amplitude typically decreased with decreasing click level. This can be demonstrated qualitatively by superimposing the responses taken at different attenuations (Fig. 8, A–C). The time of occurrence of the response maxima was level-independent as previously reported (Wagner et al. 2005). Furthermore, as click level decreased, the number of super-threshold oscillation periods also decreased (not shown). When stimulus level decreased, the local maxima in the first half of the click response decreased (Fig. 8, A–C). The first maximum that occurred before 2-ms latency in the recording with 0-dB attenuation disappeared as the level decreased (Fig. 8, B and C). On the other hand, local maxima in the second half of the response increased. The latter observation reflected an increase in group delay.
FIG. 8.
Change of click response with stimulus level. A–C: changes in response amplitude in 3 typical examples. Response amplitude decreased and latency increased as click level decreased (decreasing gray scale with decreasing click level). The high-pass filtered response is plotted. D–F: corresponding instantaneous Hilbert frequencies. Instantaneous frequency (data from ± 5 sample points around group delay) increased as level decreased. For sake of clarity, 6 curves taken at 4 dB steps (A) and 3 curves at 10 dB steps (B and C) are shown, while 11 curves at 2 dB steps are plotted in D–F. The straight lines, plotted in solid mode within the range of analysis and as dots otherwise, in D–F denote the global slope.
The best frequency also depended on click level, with responses evoked by lower click levels being shifted to later times and thus higher frequencies (Fig. 8, D–F). For example, the responses evoked by loud clicks (black lines) occurred before responses evoked by fainter clicks (gray lines; Fig. 8, D–F). Each line slopes. The lines in the examples shown in Fig. 8, D and F, approximately follow one slope, i.e., the slope is level independent. Consequently, the slopes over all data points, the global slope, was 968 Hz/ms (Fig. 8D) or 528 Hz/ms (F), respectively, while the mean of the slopes of the individual lines was 773 and 683 Hz/ms, respectively. Such behavior was observed in ∼90% of the cases. In some cases, the single lines appeared as if they were stacked above each other as in the example in Fig. 8E. This was reflected in the global slope (1112 Hz/ms) being higher as the mean over the slopes of the individual regression lines (167 Hz/ms). The median of the global slope for all data sets was 800 Hz/ms, close to the 1110 Hz/ms measured for the median of the linear frequency glide at 0-dB attenuation.
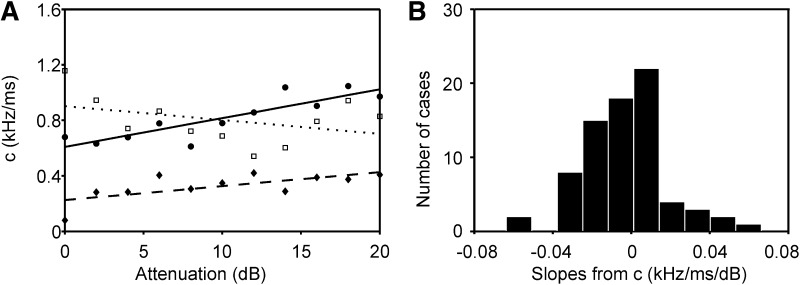
To further analyze how the glide was influenced by stimulus level, we plotted the gliding factor c in Eq. 3 as obtained from the linear fits as a function of stimulus level (Fig. 9A) for the three cases in Fig. 8. The slope of the linear regression line was used as a measure for the level dependence of c. In the three cases shown in Fig. 8, the slopes were 21, 10, and −10 Hz·ms−1·dB−1. The distribution of all slopes showed a slight negative median (Fig. 9B, −4 Hz·ms−1·dB−1). A similar distribution was observed for the zero crossings (median: −10 Hz·ms−1·dB−1; not shown). This small negative value suggested that the glide was largely level independent with a slight tendency to decrease as stimulus level decreased.
FIG. 9.
Influence of click level on the frequency glide. A: the dependence of the gliding factor c in Eq. 3 on stimulus level is shown for the data in Fig. 8. The dots are the individually measured gliding factors, while the lines correspond to the linear-regression lines. Note that 2 lines slope up, while the slope in one example (corresponding to the example shown in Fig. 8, C and F) has a negative slope. B: the distribution of the slopes of c as a function of attenuation, as shown in A, including all 75 data sets. Note that the distribution has a slight bend to the left.
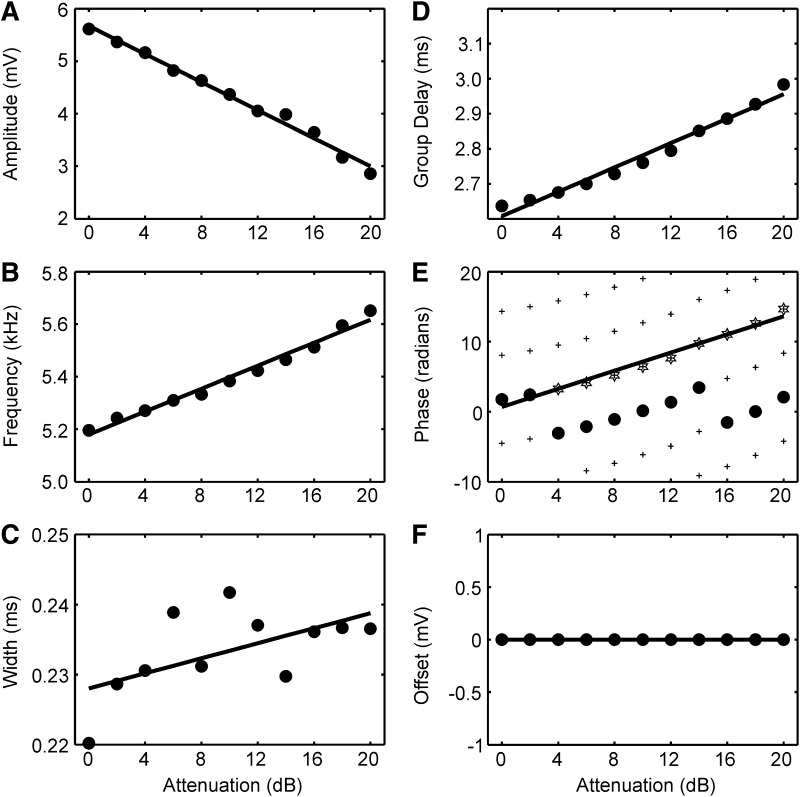
In the following, we analyze the responses evoked at the different click levels quantitatively in terms of the remaining six parameters of the fitted Gabor-chirp function. Figure 10 shows the dependence of the remaining six fitted parameters on click level in a typical example. The dependence of the frequency f measured at the group delay t0 is analyzed in some detail (Fig. 11). The data regarding the parameters group delay t0, amplitude A, and phase φ are summarized in Fig. 12. The dependence of the width σ and the offset B on click level will only be briefly mentioned.
FIG. 10.
Influence of click level on the further fit parameters. The values of 6 fit parameters of the Gabor-chirp function together with the linear regression lines are shown for a typical example. A: amplitude A decreased linearly as stimulus level decreased. B: frequency f increased linearly as stimulus level decreased. C: the change of the width σ with stimulus level showed a trend for broadening, but was irregular. D: group delay t0 increased linearly as stimulus level decreased. E: phase φ increased linearly as stimulus level decreased. The dots are the data obtained from the fit, while the stars are the data after shifting by multiples of 2π according to the algorithm of Fitzgerald et al. (2001). The crosses mark the 2π grid used for the shift. The regression analysis, applied after the correction (solid line), demonstrated a linear increase of phase φ as amplitude A decreased. F: there was almost no offset B. Attenuation was decreased in 2-dB steps over a range of 20 dB.
FIG. 11.
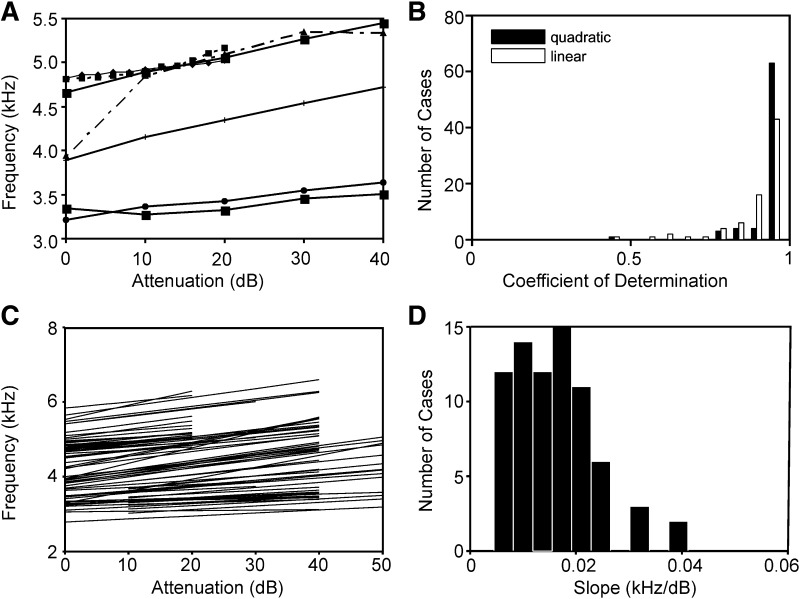
Influence of click level on frequency. A: 7 typical examples. B: coefficients of determination for linear and quadratic fits. Note that both fits produced high coefficients of determination. C: all linear fits. D: distribution of slopes of fits. The plots in B–D are based on 75 data sets.
FIG. 12.
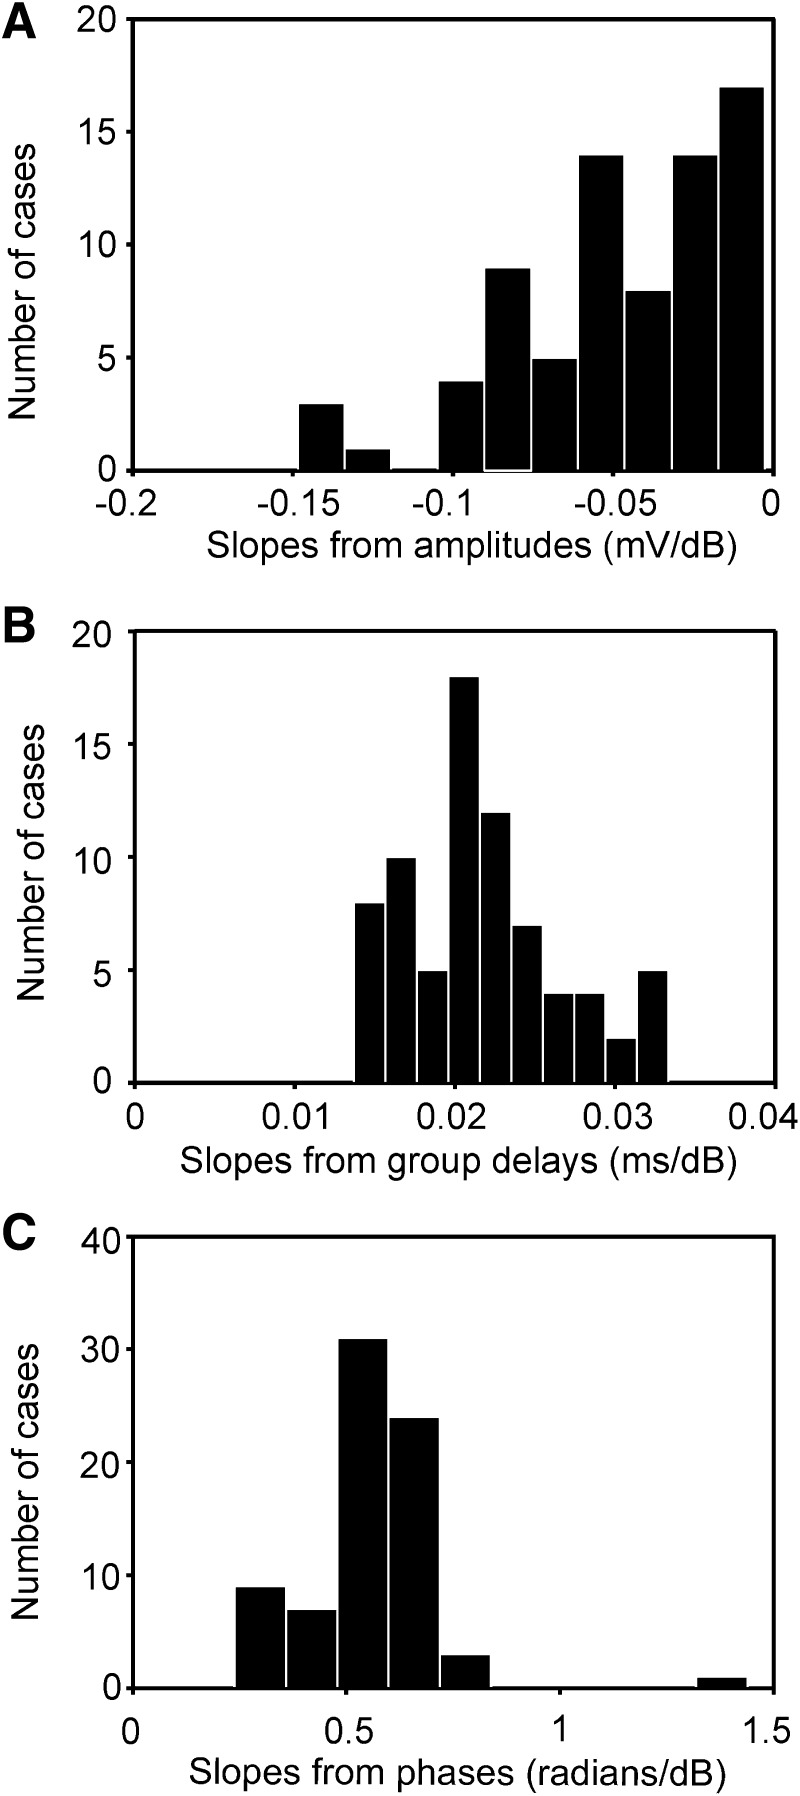
Influence of click level on response amplitude (A), group delay (B), and phase (C) derived from Gabor-chirp fit. The plots are based on 75 data sets.
Mathematically, the phase φ is related to the group delay t0, the times t* of the occurrence of the local response maxima, and frequency f as may be seen from the carrier of the Gabor-chirp function. We consider the case of a linear chirp (see Eq. 3)
 |
(7) |
For the extraction of response maxima t*, the argument of the cosine needs to be zero, resulting in a quadratic equation
 |
(8) |
The solution of this equation in terms of t* leads to
 |
(9) |
However, because c is small (compared with f2), we can neglect the second term in the sum of Eq. 8 or, equivalently, expand the square root in Eq. 9 up to first order in c, which leads to a linear approximation
 |
(10) |
We have already shown that the times t* of occurrence of the extrema is independent of attenuation (Wagner et al. 2005). Therefore
 |
(11) |
Thus t0 and φ should increase and decrease approximately proportionally. A strict linearity is only hampered by the dependence of the frequency f on attenuation.
The frequency f increased as level decreased (Figs. 10B and 11A). The increase of f with a decrease in level was usually linear, although sometimes a saturating function was observed (Fig. 11A, dot-dashed line). The coefficient of determination obtained from a linear relation showed a broad distribution and a median value of 0.94. The median of the quadratic fit was at 0.98 (Fig. 11B), only slightly higher than the median obtained from the linear fit. Because the linear model provided such a good fit, we shall only use the linear fits from now on also in respect to the other parameters. With the linear fits a data reduction was possible, and in Fig. 11C, only the regression lines are shown. The median increase of f with attenuation was 15 Hz/dB (Fig. 11D), although our sample was too small to decide whether the slope depended on best frequency. At 5,000 Hz, the observed slope amounted to a change in frequency of ∼3% with 10 dB change in level.
The decrease of the maximal response amplitude A with stimulus level was also well described by a linear fit (Fig. 10A). The median coefficient of determination in the linear fits was 0.92. The distribution of the slopes ranged from −0.15 to 0 mV/dB, but was skewed toward 0 (median −0.042 mV/dB; Fig. 12A). Generally the amplitude decreased to half of its value if the sound was attenuated by slightly more than 20 dB.
The time of occurrence of the response as measured by the group delay t0 increased with increasing attenuation (Fig. 10D). There was a highly significant linear relation in most cases (median coefficient of determination: 0.99). The histogram of the distribution of the slopes derived from the linear model is almost symmetrical (Fig. 12B). The median slope amounted to 0.021 ms/dB.
Because group delay t0 increased as level decreased and because the frequency f changed little with level, phase φ was expected to increase as the level of the stimulus decreased (Eq. 11 and Fig. 10E). The median coefficient of determination in the linear model was 0.99. The median increase of phase with attenuation was 0.57 radians/dB (Fig. 12C).
For the four parameters amplitude, group delay, phase, and frequency, the medians of the coefficients of determination were >0.9 for both the linear and the quadratic fits. For the other two parameters [the width σ and the offset B (see Eq. 1) of the Gaussian], such an approach typically led to much lower coefficients of determination. Indeed, the offset B was very small (∼1/1,000 of the evoked amplitude) as expected for high-pass filtered responses (Fig. 10F). The linear regression coefficient varied widely around 0 (not shown). The situation was more complex for the width σ of the Gaussian (Fig. 10C). Here in some cases very good linear fits resulted, but in others the correlation was weak, absent or there was anti-correlation. The median of the coefficient of determination was 0.48 the linear fits, whereas it was 0.75 in the quadratic fits. In general, the linear slopes were positive with a mean of 0.018 ± 0.026 μs/dB (not shown).
DISCUSSION
The impulse response of the neurophonic potential in the barn owl's nucleus laminaris and its dependence on stimulus level was investigated with click stimulation. A Gabor filter with a frequency glide provided the best fit. Amplitude, group delay, frequency, and phase of the click response depended in a systematic way on stimulus level. We shall first discuss our findings with respect to properties of the neurophonic potential in general. Then we turn to the properties of the impulse response measured and last to the effect of click level.
Characteristics of the neurophonic as specifically evoked by clicks
The neurophonic potential, a characteristic frequency-following multiunit response, has been observed in the auditory nerve of mammals (Chimento and Schreiner 1990; Henry 1996; Snyder and Schreiner 1984), and also in auditory structures like the nucleus laminaris of birds or the medial superior olive in mammals (Bojanowski et al. 1989; Schwartz 1992; Sullivan and Konishi 1986; Wagner et al. 2005). The auditory neurophonic reflects properties of the frequency-following response (Aiken and Picton 2008) and the brain-stem-auditory-evoked response (Burkard and Voigt 1989). However, because the neurophonic potential is recorded in a given nucleus, it is much more specific than the scalp-recorded potentials.
The click-evoked neurophonic potential in the nucleus laminaris has been described as corresponding to the impulse response of the entire system from the stimulated ear to the recording site (Schwartz 1992). The clicks we used had a broad enough spectrum to stimulate the whole basilar membrane if the upper hearing range of ∼13 kHz in the barn owl (Dyson et al. 1998) is taken into account. Nevertheless a frequency-specific response was observed with several oscillations having a frequency around the maximum response obtained in iso-intensity frequency response curves. Because the total basilar membrane was activated by the click, the selectivity of the oscillatory response cannot be generated peripherally but reflects a property of the nervous system. One of these properties is phase locking (Snyder and Schreiner 1984). Phase locking extends up to 9 kHz in barn owls (Koeppl 1997a), and the occurrence of a neurophonic potential with frequencies ≤7 kHz was therefore not surprising. However, phase locking alone cannot explain the neurophonic potential observed in nucleus laminaris. A second component seems to be the massively parallel and synchronized activity of the axons arriving from nucleus magnocellularis (Carr and Boudreau 1993; Carr and Konishi 1990; Sullivan and Konishi 1986). Snyder and Schreiner (1984) came to similar conclusions for the auditory nerve neurophonic. Modeling results predict that the synchronized activity of magnocellular axons is the result of plasticity during the development of the circuit (Gerstner et al. 1996; Kempter et al. 2001; Leibold et al. 2001, 2002). Phase locking and synchronization together can generate an oscillation of very high-amplitude and sinusoidal form. Nevertheless, it should be acknowledged that some properties of the neurophonic might also reflect the mechanical response of the basilar-membrane location projecting to the laminaris region sampled with the electrode (Kiang et al. 1965). One of these properties may be the frequency glide (Shera 2001) (see also next paragraph).
Impulse response of the neurophonic potential
The impulse response of a dynamic system is its output when presented with a brief input signal. In the mammalian auditory system, gamma-tone filters have proven to be a good model for the impulse response (deBoer and Jongh 1978; Lin and Guinan 2004; Patterson et al. 1992; Recio et al. 1998). The impulse response in mammals has a steep rising phase, is asymmetrical in time and contains a frequency glide (Carney et al. 1999; Irino and Patterson 2001; Recio et al. 1998; Shera 2001). It can be well fitted by a gamma-chirp filter. We have used gamma-tone filters before to characterize the temporal precision of the click responses in the barn owl (Wagner et al. 2005). Now we observed that the temporal Gabor filter provided a better fit than the typically used gamma-tone filters. This was mainly due to the fact that the rising phase in the high-pass filtered neurophonic potential had a smooth rising phase. The rising phase in our data was smoother than that observed in mammals (e.g., Recio et al. 1998). Because gamma-tone filters become more symmetric as γ, the shape factor, is increased, we tried several values of γ. Indeed the higher the order of the gamma-tone filter was, the better was the fit. Because a higher γ means more symmetry, there should be an order at which the gamma-tone and Gabor filters fits can no longer be distinguished. However, according to our analysis, this order must be >15. We also note that the high-pass filtering, which we used to separate the high-frequency component from the low-frequency components of the click responses, makes the analyzed signal more symmetrical, i.e., more Gabor-like.
High filter orders might indeed be found in the auditory system. Beginning with the external ear, many filters are cascaded with the progression to central auditory nuclei. Nucleus laminaris is a third-order nucleus. However, even if the auditory system would implement the causal gamma-tone filter, for all practical purposes, as in simulations, to quantify the click responses, it is simpler to use the acausal Gabor filter than a very-high-order gamma-tone filter.
The Gabor filter fitted the smooth rising phase of high-pass filtered click responses especially well. This brings up the question whether the smooth rising phase is due to the neurophonic potential being a multiunit response or whether a systematic difference exists between the mammalian and avian auditory system. Unfortunately, the impulse response of the avian system has not been measured before.
A frequency glide similar to the situation in mammals was present in our data. Analysis of the change of the instantaneous frequency as obtained either by means of the Hilbert transform or from the zero crossing yielded similar results. A linear change of frequency with time (Carney et al. 1999) provided a better fit than a fit with a saturating function. The glide observed in mammals is thought to be a consequence of the traveling wave (Shera 2001) and additionally of the interaction of several cochlear excitation drives with different latencies and frequency contents (Lin and Guinan 2000, 2004). Whether this also holds for birds is unclear. The glides have also been linked to asymmetrical psychophysical tuning curves (Irino and Patterson 2001). The more linear behavior observed in our case compared with the situation in mammals might be related to the more symmetrical frequency tuning curves of birds compared with mammals (Koeppl 1997b; Manley et al. 1985). In most cases, the glide was level independent as also observed in mammals. This level independence is consistent with the level-independent temporal precision reported earlier (Wagner et al. 2005). We observed also high-frequency jitter and irregularities in the instantaneous frequency (estimated by means of a Hilbert transform or from zero crossings) that were similar to those measured by Carney et al. (1999) and by Lin and Guinan (2004). Our analyses suggested that most of these effects were due to having second lobes of activity or several frequencies in our data. It is unclear whether these effects, which only occurred in a minority of cases, reflect the interaction of several drives, as has been discussed in the mammalian literature (Guinan and Cooper 2008; Lin and Guinan 2004) or not. Processing up to the third-order auditory station where we recorded our potentials would certainly allow for enough possibilities for additional drives. Nevertheless we were struck by the “cleanliness” of the multiunit response that allowed us to apply the type of filter analysis others have used with single-unit data.
We fitted the click-evoked neurophonic in the nucleus laminaris of the owl to simple filters such as the Gabor-chirp filter. More complex, nonlinear filters have recently been used in the mammalian literature, and they have improved the understanding of the mechanisms acting in the peripheral and central auditory system (e.g., de Boer and Nuttall 2000; Irino and Patterson 2001; Recio-Spinoso et al. 2005; Tan and Carney 2003; Temchin et al. 2005). However, such detailed phenomenological modeling was not our goal. We, instead, would like to point to the successful use of a simple filter.
Level dependence of impulse response
In many cases, the relationship between stimulus level and several of the fitting parameters of the Gabor-chirp filter was well captured by a linear fit. In other cases, saturation was seen. This finding is consistent with the behavior of the impulse response in mammals (Henry 1996; Recio et al. 1998). The large linear range of ≤50 dB observed in some cases reflects observations from the barn owl auditory nerve (Koeppl and Yates 1999) and compound action potential (Koeppl and Gleich 2007). In contrast, the dynamic ranges of single units in the nucleus magnocellularis and nucleus laminaris tended to be smaller (Koeppl 1997a,b; Pena et al. 1996; Viete et al. 1997).
Interrelated changes in group delay, frequency, and phase produce a temporal constancy in response peaks and troughs (Wagner et al. 2005). All three parameters increased as stimulus level decreased. The median increase in group delay (0.021 ms/dB) was slightly smaller than the increase calculated from compound-action potential data (0.029 ms/dB) (Fig. 5 in Koeppl and Gleich 2007) but within the range measured by Koeppl (1997b) for auditory nerve fibers and neurons of the nucleus magnocellularis. A linear increase of the group delay with decreasing level is typically observed also in other systems (e.g., Burkard and Voigt 1989; Lin and Guinan 2004; Versnel et al. 1992). Burkard and Voigt (1989) concluded that the changes reflect the time course of the transduction process from mechanical events in the cochlea to eight-nerve fiber discharge. In our case, the processes further upstream contributed as well.
The increase in best frequency with decrease in stimulus level is typically explained by the asymmetrical tuning curves observed in mammals (Johnstone et al. 1986; Rosen and Baker 1994) with the shallower low-frequency skirt appearing at high stimulus intensities. Birds, in contrast to mammals, have more symmetrical tuning curves (Gleich 1994; Koeppl 1997b; Manley et al. 1985). In addition, the sound-pressure level had no systematic effect on the symmetry or on the high- and low-frequency slopes of the flanks of the excitation patterns (Gleich 1994). Therefore the asymmetry argument cannot explain the frequency shift in birds, and another mechanism needs to be evoked. We observed that instantaneous frequency increased linearly with time and that this increase was generally independent of stimulus level. In other words, in plots of instantaneous frequency versus time, the slope was similar for different click levels. The click level determined only the time window in which we observed significant responses. With lower stimulus levels, the response started later, i.e., at higher instantaneous frequencies. In those cases where the global slope was higher than the mean of the slopes measured at different levels, a further factor must influence the global slope. The origin of this further component remains unclear.
The change in phase with stimulus level was considerable. However, such a large change is necessary to guarantee level-independence of response extrema (Wagner et al. 2005). Such independence is also seen in mammalian preparations (Carney et al. 1999; Guinan and Cooper 2008; Recio-Spinoso et al. 2005). The corresponding changes in phase observed in mammals were smaller because the frequencies were lower.
The overall impression from the data and analyses presented here is that basic properties of the auditory system of the barn owl as measured by the impulse response are very similar to equivalent properties from other birds and mammals. This similarity holds despite specialization of the barn owl's auditory system for sound localization and temporal resolution. These features make the barn owl a good model for study of both specific adaptations and general auditory properties. The similarity also holds despite the fact that analyses with many different methods and at many different locations were compared, which suggests that the phenomena reported here are robust.
GRANTS
This research was sponsored by the German Research Foundation (DFG, Wa-606/12, Ke-788/1-3, 4), the Bundesministerium für Bildung und Forschung (BMBF, Bernstein Collaboration Temporal Precision, 01GQ07101 to H. Wagner and 01GQ07102 to R. Kempter), and by National Institutes of Health Grants DC-00436 to C. E. Carr and P30-04664 to the auditory group at the University of Maryland.
Supplementary Material
Acknowledgments
This work profited from the advice of B. Christianson, C. Koeppl, and P. Kuokkanen.
Footnotes
The online version of this article contains supplemental data.
REFERENCES
- Aertsen and Johannesma 1980.Aertsen AMHJ, Johannesma PIM. Spectrotemporal receptive fields of auditory neurons in the grassfrog. I. characterization of tonal and natural stimuli. Biol Cybern 38: 223–234, 1980. [Google Scholar]
- Aiken and Picton 2008.Aiken SJ, Picton TW. Envelope and spectral frequency-following responses to vowel sounds. Hear Res 245: 35–47, 2008. [DOI] [PubMed] [Google Scholar]
- Beattie 1988.Beattie RC Interaction of click polarity, stimulus level, and repetition rate on the auditory brain stem response. Scand Audiol 17: 99–109, 1988. [DOI] [PubMed] [Google Scholar]
- Bojanowski et al. 1989.Bojanowski T, Hu K, Schwarz WF. Analogue signal representation in the medial superior olive of the cat. J Otolaryngol 18: 3–9, 1989. [PubMed] [Google Scholar]
- Burkard and Palmer 1997.Burkard R, Palmer AR. Responses of chopper units in the ventral cochlear nucleus of the anaesthetised guinea pig to clicks-in-noise and click trains. Hear Res 110: 234–250, 1997. [DOI] [PubMed] [Google Scholar]
- Burkard and Voigt 1989.Burkard R, Voigt HF. Stimulus dependencies of the gerbil brain-stem auditory-evoked response (BAER). I. Effects of click level, rate, and polarity. J Acoust Soc Am 85: 2514–2525, 1989. [DOI] [PubMed] [Google Scholar]
- Carney et al. 1999.Carney LH, McDuffy MJ, Shekter I. Frequency glides in the impulse response of auditory-nerve fibers. J Acoust Soc Am 105: 2384–2391, 1999. [DOI] [PubMed] [Google Scholar]
- Carr and Boudreau 1993.Carr CE, Boudreau RE. Organization of the nucleus magnocellularis and the nucleus laminaris in the barn owl: encoding and measuring interaural time differences. J Comp Neurol 334: 337–355, 1993. [DOI] [PubMed] [Google Scholar]
- Carr and Konishi 1990.Carr CE, Konishi M. A circuit for detection of interaural time differences in the brain stem of the barn owl. J Neurosci 10: 3227–3246, 1990. [DOI] [PMC free article] [PubMed] [Google Scholar]
- Chimento and Schreiner 1990.Chimento TC, Schreiner CE. Time course of adaptation and recovery from adaptation in the cat auditory-nerve neurophonic. J Acoust Soc Am 88: 857–864, 1990. [DOI] [PubMed] [Google Scholar]
- DeBoer and Jongh 1978.DeBoer E, Jongh HR. On cochlear encoding: potentialities and limitations of the reverse-correlation technique. J Acoust Soc Am 63: 115–135, 1978. [DOI] [PubMed] [Google Scholar]
- De Boer and Nuttall Boer 2000.De Boer E, Nuttall AL. The mechanical waveform of the basilar membrane. II. From data to models and back. J Acoust Soc Am 107: 1487–1496, 2000. [DOI] [PubMed] [Google Scholar]
- Don et al. 1996.Don M, Vermiglio AJ, Ponton CW, Eggermont JJ, Masuda A. Variable effects of click polarity on auditory brain-stem response latencies: analyses of narrow-band ABRs suggest possible explanations. J Acoust Soc Am 100: 458–472, 1996. [DOI] [PubMed] [Google Scholar]
- Dyson et al. 1998.Dyson ML, Klump GM, Gauger B. Absolute hearing thresholds and critical masking ratios in European barn owl: a comparison with other owls. J Comp Physiol [A] 182: 695–702, 1998. [Google Scholar]
- Fitzgerald et al. 2001.Fitzgerald JV, Burkitt AN, Clark GM, Paolini AG. Delay analysis in the auditory brain stem of the rat: comparison with click latency. Hear Res 159: 85–100, 2001. [DOI] [PubMed] [Google Scholar]
- Galambos et al. 1959.Galambos R, Schwarzkopf J, Rupert A. Microelectrode study of superior olivary nuclei. Am J Physiol 197: 527–536, 1959. [DOI] [PubMed] [Google Scholar]
- Gerstner et al. 1996.Gerstner W, Kempter R, van Hemmen JL, Wagner H. A neuronal learning rule for sub-millisecond temporal coding. Nature 383: 76–78, 1996. [DOI] [PubMed] [Google Scholar]
- Gleich 1994.Gleich O Excitation patterns in the starling cochlea: a population study of primary auditory afferents. J Acoust Soc Am 95: 401–409, 1994. [DOI] [PubMed] [Google Scholar]
- Guinan and Cooper 2008.Guinan JJ, Jr, Cooper NP. Medial olivocochlear efferent inhibition of basilar-membrane responses to clicks: evidence for two modes of cochlear mechanical excitation. J Acoust Soc Am 124: 1080–1092, 2008. [DOI] [PMC free article] [PubMed] [Google Scholar]
- Henry 1996.Henry KR Tuning curves of the difference tone auditory nerve neurophonic. Hear Res 99: 160–167, 1996. [DOI] [PubMed] [Google Scholar]
- Irino and Patterson 2001.Irino T, Patterson RD. A compressive gammachirp auditory filter for both physiological and psychophysical data. J Acoust Soc Am 109: 2008–2022, 2001. [DOI] [PubMed] [Google Scholar]
- Johnstone et al. 1986.Johnstone BM, Patuzzi R, Yates GK. Basilar membrane measurements and the travelling wave. Hear Res 22: 147–153, 1986. [DOI] [PubMed] [Google Scholar]
- Kempter et al. 2001.Kempter R, Leibold C, Wagner H, van Hemmen JL. Formation of temporal-feature maps by axonal propagation of synaptic learning. Proc Natl Acad Sci USA 98: 4166–4171, 2001. [DOI] [PMC free article] [PubMed] [Google Scholar]
- Kiang et al. 1965.Kiang NYS, Watanabe T, Thomas C, Clark LF. Discharge patterns of singles fibers in the cat's auditory nerve. Res Monogr 35: 1965.
- Koeppl 1997a.Koeppl C Phase locking to high frequencies in the auditory nerve and cochlear nucleus magnocellularis of the barn owl, Tyto alba. J Neurosci 17: 3312–3321, 1997a. [DOI] [PMC free article] [PubMed] [Google Scholar]
- Koeppl 1997b.Koeppl C Frequency tuning and spontaneous activity in the auditory nerve and cochlear nucleus magnocellularis of the barn owl Tyto alba. J Neurophysiol 77: 364–377, 1997b. [DOI] [PubMed] [Google Scholar]
- Koeppl and Gleich 2007.Koeppl C, Gleich O. Evoked cochlear potentials in the barn owl. J Comp Physiol [A] 193: 601–612, 2007. [DOI] [PubMed] [Google Scholar]
- Koeppl and Yates 1999.Koeppl C, Yates G. Coding of sound pressure level in the barn owl's auditory nerve. J Neurosci 19: 9674–9686, 1999. [DOI] [PMC free article] [PubMed] [Google Scholar]
- Leibold et al. 2001.Leibold C, Kempter R, van Hemmen JL. Temporal map formation in the barn owl's brain. Phys Rev Lett 87: 248101, 2001. [DOI] [PubMed] [Google Scholar]
- Leibold et al. 2002.Leibold C, Kempter R, van Hemmen JL. How spiking neurons give rise to a temporal-feature map: from synaptic plasticity to axonal selection. Phys Rev E 65: 051915, 2002. [DOI] [PubMed] [Google Scholar]
- Lin and Guinan JJ 2004.Lin T, Guinan JJ Jr. Time-frequency analysis of auditory-nerve-fiber and basilar-membrane click responses reveal glide irregularities and non-characteristic-frequency skirts. J Acoust Soc Am 116: 405–416, 2004. [DOI] [PubMed] [Google Scholar]
- Manley et al. 1985.Manley GA, Gleich O, Leppelsack HJ, Oeckinghaus H. Activity patterns of cochlear ganglion neurones in the starling. J Comp Physiol [A] 157: 161–181, 1985. [DOI] [PubMed] [Google Scholar]
- Marcelja 1980.Marcelja S Mathematical description of the responses of simple cortical cells. J Opt Soc Am 70: 1297–1300, 1980. [DOI] [PubMed] [Google Scholar]
- Patterson et al. 1992.Patterson RD, Robinson K, Holdsworth JW, McKeown D, Zhang C, Allerhand M. Complex sounds and auditory images. In: Auditory Physiology and Perception, edited by Cazals Y, Demany L, Horner K. Oxford: Pergamon, 1992, p. 429–446.
- Pena et al. 1996.Pena JL, Viete S, Albeck Y, Konishi M. Tolerance to sound intensity of binaural coincidence detection in the nucleus laminaris of the owl. J Neurosci 16: 7046–7054, 1996. [DOI] [PMC free article] [PubMed] [Google Scholar]
- Recio et al. 1998.Recio A, Rich NC, Narayan SS, Ruggero MA. Basilar-membrane responses to clicks at the base of the chinchilla cochlea. J Acoust Soc Am 103: 1972–1989, 1998. [DOI] [PMC free article] [PubMed] [Google Scholar]
- Recio-Spinoso et al. 2005.Recio-Spinoso A, Temchin AN, van Dijk P, Fank YH, Ruggero MA. Wiener-kernel analysis of responses to noise of chinchilla auditory nerve-fibres. J Neurophysiol 93: 3615–3634, 2005. [DOI] [PubMed] [Google Scholar]
- Robles and Ruggero 2001.Robles L, Ruggero MA. Mechanics of the mammalian cochlea. Physiol Rev 81: 1305–1352, 2001. [DOI] [PMC free article] [PubMed] [Google Scholar]
- Rosen and Baker 1994.Rosen S, Baker RJ. Characterising auditory filter nonlinearity. Hear Res 73: 231–243, 1994. [DOI] [PubMed] [Google Scholar]
- Schwarz 1992.Schwarz DWF Can central neurons reproduce sound waveforms? An analysis of the neurophonic potential in the laminar nucleus of the chicken. J Otolaryng 21: 30–38, 1992. [PubMed] [Google Scholar]
- Shera 2001.Shera CA Frequency glides in click responses of the basilar membrane and auditory nerve: their scaling behavior and origin in traveling-wave dispersion. J Acoust Soc Am 109: 2023–2034, 2001. [DOI] [PubMed] [Google Scholar]
- Snyder and Schreiner 1984.Snyder RL, Schreiner CE. The auditory neurophonics: basic properties. Hear Res 15: 261–280, 1984. [DOI] [PubMed] [Google Scholar]
- Sullivan and Konishi 1986.Sullivan WE, Konishi M. Neural map of interaural phase difference in the owl's brainstem. Proc Natl Acad Sci USA 83: 8400–8404, 1986. [DOI] [PMC free article] [PubMed] [Google Scholar]
- Tan and Carney 2003.Tan Q, Carney LH. A phenomenological model for the responses of auditory-nerve fibres. II. Nonlinear tuning with a frequency glide. J Acoust Soc Am 114: 2007–2020, 2003. [DOI] [PubMed] [Google Scholar]
- Temchin et al. 2005.Temchin AN, Recio-Spinoso A, van Dijk P, Ruggero MA. Wiener kernels of chinchilla auditory-nerve fibers: verification using responses to tones, clicks, and noise and comparison with basilar-membrane vibrations. J Neurophysiol 93: 3635–3648, 2005. [DOI] [PMC free article] [PubMed] [Google Scholar]
- Versnel et al. 1992.Versnel H, Schoonhoven R, Prijs VF. Single-fiber and whole-nerve responses to clicks as a function of sound intensity in the guinea pig. Hear Res 59: 138–156, 1992. [DOI] [PubMed] [Google Scholar]
- Viete et al. 1997.Viete S, Pena JL, Konishi M. Effects of interaural intensity difference on the processing of interaural time difference in the owl's nucleus laminaris. J Neurosci 17: 1815–1824, 1997. [DOI] [PMC free article] [PubMed] [Google Scholar]
- Wagner et al. 2005.Wagner H, Brill S, Kempter R, Carr CE. Microsecond precision of phase delay in the auditory system of the barn owl. J Neurophysiol 94: 1655–1658, 2005. [DOI] [PMC free article] [PubMed] [Google Scholar]
Associated Data
This section collects any data citations, data availability statements, or supplementary materials included in this article.


