

Abstract
Dopamine depletion in cortical-basal ganglia circuits in Parkinson's disease (PD) grossly disturbs movement and cognition. Classic models relate Parkinsonian dysfunction to changes in firing rates of basal ganglia neurons. However, disturbances in other dynamics of neural activity are also common. Taking both inappropriate firing rates and other dynamics into account and determining how changes in the properties of these neural circuits that occur during PD impact on information coding are thus imperative. Here, we examined in vivo network dynamics in the external globus pallidus (GPe) of rats before and after chronic dopamine depletion. Dopamine depletion led to decreases in the firing rates of GPe neurons and increases in synchronized network oscillations in the β frequency (13–30 Hz) band. Using logistic regression models, we determined the combined and separate impacts of these factors on network entropy, a measure of the upper bound of information coding capacity. Importantly, changes in these features in dopamine-depleted rats led to a significant decrease in GPe network entropy. Changes in firing rates had the largest impact on entropy, with changes in synchrony also decreasing entropy at the network level. Changes in autocorrelations tended to offset these effects because autocorrelations decreased entropy more in the control animals. Thus it is possible that reduced information coding capacity within basal ganglia networks may contribute to the behavioral deficits accompanying PD.
INTRODUCTION
How does dopamine depletion in cortico-basal ganglia circuits in Parkinson's disease (PD) induce gross dysfunction in motor control and cognition? An early and influential model, which we will refer to as the rate model, of the neural basis of the behavioral deficits seen in PD, proposed that dopamine has opposing effects on direct and indirect pathways through the basal ganglia (Albin et al. 1989; DeLong 1990). This model suggested that differential rate changes in these two pathways in PD ultimately leads to an over inhibition of basal ganglia targets, resulting in decreased cortical activity and movements.
However, there are several findings that are inconsistent with the rate model. For example, the direct/indirect distinction on which the model is based is no longer clearly defined as additional pathways linking the basal ganglia (BG) nuclei have been discovered (Kincaid et al. 1991; Parent and De Bellefeuille 1983; Parent and Hazrati 1995), and there is less segregation between D1 and D2 receptors in the pathways than was first thought (Aizman et al. 2000; Surmeier et al. 1996). Furthermore, electrophysiological recordings in cortico-basal ganglia circuits in PD and its animal models have shown that chronic dopamine depletion is commonly associated with alterations in the firing patterns of neurons, which may occur in the absence of, or in tandem with, changes in firing rates. Notably, recordings from electrodes implanted in unmedicated patients with PD have identified β-frequency oscillations (13–30 Hz) in several basal ganglia nuclei (Brown 2003; Brown et al. 2001; Levy et al. 2002; Williams et al. 2002), and similar oscillations have also been seen in primates treated with 1-methyl-4-phenyl-1,2,3,6-tetrahydropyridine (MPTP) (Bergman et al. 1998; Goldberg et al. 2004; Nini et al. 1995; Raz et al. 1996, 2000, 2001) and rats treated with 6-hydroxydopamine (6-OHDA) (Degos et al. 2009; Mallet et al. 2008a,b; Sharott et al. 2005), both of which are important models of PD. These oscillations are stronger when patients are off their dopamine replacement medication and are reduced when patients prepare movements (Brown and Williams 2005; Brown et al. 2001; Kuhn et al. 2004b; Levy et al. 2002; Williams et al. 2002, 2003, 2005). These data suggest that β-frequency oscillations may detrimentally affect information coding in the basal ganglia.
Thus disturbances in firing rates, oscillations, and synchronization may be detrimental to information processing in the basal ganglia and underlie the behavioral deficits seen in PD. To study this hypothesis further, we estimated the entropy in the GPe of control (dopamine intact) and Parkinsonian (6-OHDA–lesioned) rats. Chronic dopamine depletion in this model of PD caused changes in firing rates, auto-correlations (oscillations), and cross-correlations (synchrony). Using logistic regression models to define the network entropy of the spike trains, we determined the collective impact of these three features and the relative impact of each feature when considered separately.
METHODS
Data collection
Experimental procedures were carried out on adult, male Sprague-Dawley rats (Charles River, Margate, UK) and were conducted in accordance with the Animals (Scientific Procedures) Act 1986 (UK). The dataset described in this paper has been published previously (Mallet et al. 2008a,b). Therefore we will only briefly describe the recording methods here.
Electrophysiological recordings were made in 16 dopamine-intact control rats and 23 6-OHDA–lesioned rats. Anesthesia was induced with 4% vol/vol isoflurane (Isoflo, Schering- Plough, Welwyn Garden City, UK) in O2 and maintained with urethane (1.3 g/kg, ip; ethyl carbamate, Sigma, Poole, UK) and supplemental doses of ketamine (30 mg/kg, ip; Ketaset, Willows Francis, Crawley, UK) and xylazine (3 mg/kg, ip; Rompun, Bayer, Germany). Extracellular recordings of the spikes fired by ensembles of single neurons in the GPe were made using multicontact “silicon probes” (NeuroNexus Technologies, Ann Arbor, MI) where the distance between contacts was 100 μm.
Unit activity in GPe was recorded during episodes of spontaneous “cortical activation,” which contain patterns of activity that are more similar to those observed during the awake, behaving state (Steriade 2000). Cortical activation was defined according to electrocorticograms recorded simultaneously with GPe activity (Mallet et al. 2008a). It is important to note that the neuronal activity patterns present under this anesthetic regimen may only be qualitatively similar to those present in the unanesthetized brain. Nevertheless, the urethane-anesthetized animal still serves as a useful model for assessing ensemble dynamics within the basal ganglia (Magill et al. 2006). Indeed, in 6-OHDA–lesioned animals, exaggerated β oscillations emerge in cortico-basal ganglia circuits during activated brain states (Mallet et al. 2008a,b), thus accurately mimicking the oscillatory activity recorded in awake, unmedicated PD patients (Brown 2006).
6-OHDA lesions of dopamine neurons
Unilateral 6-OHDA lesions were carried out as described previously (Mallet et al. 2008a,b). Twenty-five minutes before the injection of 6-OHDA, all animals received a bolus of desipramine (25 mg/kg, ip; Sigma) to minimize the uptake of 6-OHDA by noradrenergic neurons (Schwarting and Huston 1996a). Anesthesia was induced and maintained with isoflurane (as above). The neurotoxin 6-OHDA (hydrochloride salt, Sigma) was dissolved immediately before use in ice-cold 0.9% wt/vol NaCl solution containing 0.02% wt/vol ascorbate to a final concentration of 4 mg/ml. Then, 3 μl of 6-OHDA solution was injected adjacent to the medial substantia nigra (4.5 mm posterior and 1.2 mm lateral of bregma and 7.9 mm ventral to the dura; Paxinos and Watson 1986). The extent of the dopamine lesion was assessed 14 or 15 days after 6-OHDA injection by challenge with apomorphine (0.05 mg/kg, sc; Sigma) (Schwarting and Huston 1996b). The lesion was considered successful in those animals that made >80 net contraversive rotations in 20 min. Note that the emergence of exaggerated β oscillations after 6-OHDA lesions is not dependent on apomorphine (Sharott et al. 2005). Electrophysiological recordings were carried out ipsilateral to 6-OHDA lesions in anesthetized rats 21–45 days after surgery, when pathophysiological changes in the basal ganglia are likely to have leveled out near their maxima (Vila et al. 2000).
Model
All analyses were carried out in Matlab. Scripts to carry out the analyses are available from the authors on request. We wanted to estimate the entropy in the network neural responses, as reflected by single-unit activity recorded across ensembles. The entropy provides an upper bound on the amount of information that can be carried by a population of neurons, and we assume that the relative amount of information in the basal ganglia is related to how well these nuclei (or a single nucleus therein) can represent movements or cognition. To estimate the entropy, we first have to estimate the probability distribution of spiking for neurons in the network. If we analyze neural responses using small time bins, the spikes can be treated as all-or-none events. In this case, we can represent them as categorical 0s and 1s and build a classification model that attempts to predict whether a neuron will (1) or will not (0) fire a spike in each time bin as a function of its past firing and the firing of other neurons. If we can effectively predict whether or not a neuron will or will not fire a spike in the next time bin, the actual response in that time provides us with relatively little information. Although there are a number of ways to approach this estimation problem, the one that makes the least assumptions is the logistic regression model (Christensen 1997). This approach is related to the direct and maximum entropy approaches that are known as multinomial or loglinear models in statistics (Averbeck and Lee 2006; Christensen 1997; Schneidman et al. 2006; Strong et al. 1998). Once this model has been estimated on the data, it can be used to directly estimate the entropy of the spike train, using the approach outlined below.
We estimated the entropy rate of the spike trains in the GPe network for both the control and the lesioned rats. The entropy rate, H, of a stationary stochastic process, S, is given by
 |
(1) |
Thus we estimated the entropy of the spike trains conditioned on their past. Additionally, we were interested in the joint entropy of the population of neurons. Thus s in Eq. 1 is a vector over an ensemble of neurons. Ignoring the temporal component, the joint entropy of an ensemble of n simultaneously recorded neurons can be factored as
 |
(2) |
Thus to estimate the entropy of our ensemble, we have to estimate the entropy of each neuron in the ensemble, conditioned on all the other neurons in the ensemble that we have not yet included. To simplify the presentation of the results, we report the entropy of each neuron conditioned on one other neuron or conditioned on each other neuron in the simultaneously recorded ensemble. This is made explicit in Eq. 3.
To begin the analysis, we discretized the spike trains at a bin width of 5 ms, which represented a trade-off between temporal resolution and computational efficiency. Each bin was a Bernoulli random variable with a value of 0 or 1, and if more than one spike occurred, it was only counted as a single spike. At this bin width, <0.4% of the bins in the control animals and <0.2% of the bins in the lesioned animals contained two spikes. We also analyzed a subset of our data (∼100 GPe neuron pairs from lesioned and control animals) with a bin width of 2 ms and found results that were consistent with what was found at 5 ms (data not shown).
After the spike trains were discretized, we fit logistic regression models to estimate the conditional probabilities of a spike in each bin. This model is given as
 |
(3) |
P(si,t|si,1:t, sj1,1:t,…, sjN-1,1:t) specifies the posterior probability of occurrence of a spike s = 1, in neuron i at time t, given the response of neuron i in previous time bins and/or other neurons j in previous time bins. The variables a and bj, j = 1,…, N − 1, are coefficients that are estimated as described below. K1 and K2,j represent the number of time lags used. For the analyses reported in Figs. 3–5, n = 1, i.e., we carried out the analyses while conditioning on only one other neuron. We refer to these as pairwise analyses. For the subsequent plots, we included all neurons simultaneously recorded and thus N equaled the number of neurons in the ensemble. The model parameters were optimized for each neuron as described below. The link function g was the logistic transform
 |
(4) |
Four versions of the model from Eq. 3 were fit, which allowed us to examine the effects of different features of the ensemble response on the network entropy. The first model (the rate model) included only the a0 term and characterized only the effect of the firing rate on the entropy. All subsequent models included the a0 term and additional terms. The second model (auto) included the lagged bins from the same neuron and estimated the effect of autocorrelations, that is, oscillations at the single-cell level, on the entropy. The third model (cross) included the lagged and zero lag bins from one or more additional neurons, but not the lagged bins from the same neuron, and estimated the effect of cross-correlations, that is, synchrony between pairs of neurons, on the entropy. The final model (full) included all of three terms (rate, autocorrelation, and cross-correlation).
Parameter estimation
Model parameters were fit by maximizing the likelihood of the data given the model parameters. The log-likelihood (ll) for our model was given by
 |
(5) |
where θ is the parameter vector, which for the full model and pairs of neurons was θ = {a0, a1, …aK, b0, …bK}. For the reduced models, only subsets of these parameters and variables were included. We use {sm} as shorthand to indicate the set of lagged variables appropriate to the corresponding model. Therefore for example, for the auto model,  for the cross model
  the full model would be the union of these, etc.
This equation can be maximized using the iteratively reweighted least squares algorithm (IRLS; Hastie et al. 2001). However, we found that this algorithm did not always converge, because of ill conditioning of the covariance matrix of lagged spikes. To alleviate this problem, we used an on-line version of the IRLS algorithm, similar to the adaptive filter or least mean squares algorithm used for fitting linear regression (Ljung 1999). The parameter updates at iteration l for this algorithm are given by
 |
(6) |
In this case, sm is the vector of spikes being used for prediction at the corresponding time step for the model, containing either auto or cross terms. We fit this model using the early stopping rule. To do this, the dataset was split in half, and Eq. 6 was iterated on one half the data and the log-likelihood (Eq. 5) was estimated on the other half of the data. Iteration was stopped when the change in the log-likelihood was below a criterion value given by
 |
(7) |
Normally the early stopping rule is used to control for overfitting and, in this case, one looks for a minima of the log likelihood. However, because we had far more data than parameters in our model, the log likelihood reached a plateau, and we used a small change in this plateau as our estimate of convergence.
Model selection
The number of lagged terms for either the auto- or cross-correlation, K1 and K2,j, had to be estimated. To do this, we estimated models with 1–30 lagged terms (i.e., K = 1, K = 2,…K = 30) and used model selection techniques to determine the optimal number of lags (Fig. 2). We found that our entropy estimates were not strongly dependent on the number of lags used, as long as we used enough lags. The number of relevant lags is an interesting quantity by itself, however, because it provides information about the time scale of the correlations in the data. Thus if correlations extend over a longer period of time, more lags will be necessary to capture them. To estimate the optimal number of lags we used the Bayesian information criteria (BIC). This is given by
 |
(8) |
where k is the number of parameters in the model, and T is the amount of data available for estimating the model. The optimal number of lags was determined by maximizing the BIC function. We also examined entropy estimates using Akaike's information criterion (AIC). Although the number of lagged terms was always larger, because AIC penalizes with −2k instead of –kln(T), the actual entropy estimates were statistically indistinguishable.
Entropy
Once the model was optimized and fit, the entropy of the spike train was estimated by calculating
 |
(9) |
Because our models had very few parameters (on average <15) compared with the quantity of data available (∼20,000 bins), and because we were using a cross-validated estimator, we did not have to correct for bias in our entropy estimate. More specifically, because our model uses cross-validation, it generates an upper bound on the entropy and therefore we would not underestimate the entropy (Efron and Tibshirani 1998). We also compared entropy estimates with and without cross-validation and found that they were highly similar.
We also estimated the change (decrease) in entropy, or ΔH, when we included additional sets of parameters in the model. For the full model, this was defined as
 |
(10) |
By including only the auto or cross terms, we can estimate the separate effects of these factors on the entropy.
Higher-order terms
To study the presence of higher-order effects on the prediction of the spikes, second-order terms were added to the model from Eq. 1
 |
(11) |
The auto, cross, and full models were recomputed using the estimated number of lags from the first-order model from Eq. 3 for the ensemble of neurons. For each ensemble of neurons, we compared the maximum BIC value (BICm) for the ensemble of neurons (BICens) and the BIC obtained with the additional higher-order terms (BIChot)
 |
(12) |
Population model
We also developed a model that estimated the impact of pairwise correlations on the entropy at the population level (see appendix for details). The effects at the population level cannot be measured directly, because hundreds of neurons would have to be recorded simultaneously. This would also require prohibitively large datasets to get accurate entropy estimates. Estimates can be made, however, by making various assumptions. The model uses bootstrap estimates of population covariance matrices in conjunction with a linear–nonlinear estimator (consistent with our logistic regression model) to estimate the entropy in an arbitrarily large population.
Mixed model analysis
Finally, we used a linear mixed model (also known as a random effects model) to assess effects of dopamine lesion on our various entropy parameters. This model was fit using the mixed function in SPSS (version 14) with a fixed effect of lesion and a random effect of subject. We also carried out a related analysis, by first calculating the average value of each entropy statistic (i.e., entropy based on rate, auto, cross, or full models) for each animal and then doing t-test between the distributions of these average statistics for lesioned and control animals. Results were similar to the random effects models. We report results only for the random effects model (referred to simply as ANOVA in the text).
RESULTS
The reported results were derived from ensembles of GPe neurons simultaneously recorded in either dopamine-intact control rats or 6-OHDA–lesioned rats. In the control rats, we recorded 27 ensembles that had a total of 143 single units and 507 pairs of neurons. In the lesioned rats, we recorded 56 ensembles that had a total of 459 single units and 2,086 pairs of neurons. Ensembles were defined as a given set of simultaneously record GPe neurons. The ensembles analyzed here contained ≤19 neurons. The average ensemble size for the control rats was 5.4 neurons and for lesioned rats it was 8.2.
Chronic dopamine depletion caused by 6-OHDA lesions of midbrain dopamine neurons was associated with substantial changes in the dynamics of neural activity within the GPe network. Specifically, the mean firing rate of GPe neurons was significantly reduced in the lesioned animals (Fig. 1A), there was a small relative increase in the single-neuron oscillations (i.e., autocorrelations) at ∼20 Hz (Fig. 1B), and a larger increase in the relative synchrony of GPe neuron pairs (i.e., cross-correlations) at ∼20 Hz (Fig. 1C). These latter changes also led to a large increase in the coherence between neuron pairs, with a peak in coherence at ∼20 Hz (Fig. 1D). Thus multiple features of the GPe neuron activity were affected in the Parkinsonian animals. While it is clear that oscillations are present, and oscillations (correlations) can only decrease entropy, it is not clear how large the effect will be, especially relative to the change in rates and the change in autocorrelations. Therefore we will compare the size of the effects.
FIG. 1.

Comparison of external globus pallidus (GPe) network dynamics in 6-hydroxydopamine (6-OHDA)-lesioned and control rats. A: mean ± SE firing rates of all neurons. Difference significant at P < 0.01. B: mean autocorrelation for all neurons. C: mean cross-correlation for all neurons. D: mean coherence for all pairs of neurons.
Because these changes in network dynamics have been reported in detail previously (Mallet et al. 2008a), our primary goal here was to examine the effect of these changes on the entropy in the GPe network. To calculate the entropy, we fit a logistic regression model. By incorporating different sets of parameters in the model, we examined the separate effects of firing rates, oscillations (autocorrelations), and synchrony (cross-correlations) on the entropy and determined which of these three features of the network response to dopamine depletion most impacted on entropy.
We began by determining the number of lagged time bins that were necessary in the model. This is an estimate of the time interval over which a spike train is correlated with itself (oscillations) or between pairs of neurons (synchrony), and time bins that were not necessary are bins that had a statistically negligible contribution. We found that the effect of the autocorrelations rarely extended beyond ∼15 bins (75 ms) for either the control or the lesioned animals (Fig. 2A). The effect of the cross-correlations, however, rarely went beyond about six bins (30 ms) for the lesioned animals, and never went beyond one bin (0 time lag, synchronous spikes) for the normal animals (Fig. 2B). In fact, for the control animals, 99.3% of the pairs did not have a significant synchronous term and for the lesioned animals >80% did not (Fig. 2B). Therefore the correlation time was much shorter between neurons than within the spike trains of a single neuron, and this effect was more dramatic for the control animals than it was for the lesioned animals. The number of parameters for the full model was then the sum of the number for the auto and cross models (Fig. 2C).
FIG. 2.

Optimal number of lags for auto- (K1) and cross-(K2) correlations. A: optimal number of lagged time bins (5 ms each), selected with Bayesian information criteria (BIC) for autocorrelations in lesioned and control ensembles. B: same for cross-correlations. C: total of auto- and cross-correlations.
Effects of rates, autocorrelations, and pairwise cross-correlations on entropy
Next, we examined the difference in entropy between control and lesioned animals generating four versions of our logistic regression model that took into account the following features of neuronal activity: 1) only the firing rates; 2) the firing rates and the autocorrelations; 3) the firing rates and the cross-correlations (note for all entropy estimates we included ≥1 bin of cross-correlation); or 4) all three features (i.e., the rates, autocorrelations, and the cross-correlations). The fourth full model gives an estimate of the entropy in the network as it accounts for all factors that can reduce the entropy in spike trains. (Note that we use the term factor here and henceforth to refer to the entire set of parameters that represent either the auto or cross effects.) Importantly, however, in the first analyses, we only estimated entropy while conditioning on one other neuron, i.e., we considered pairwise and not ensemble entropy. Below we will present results from an expanded model that takes into account all simultaneously recorded neurons (referred to as the ensemble) and ultimately an entire population of neurons.
We found that the GPe network entropy was lower in the lesioned animals compared with control animals for all four models (Fig. 3, A–D). Furthermore, in all four cases, the distributions were significantly different between control and lesioned rats (2-way ANOVA with lesion as a fixed effect and subject as a random effect, P < 0.05 on fixed effect). Firing rate differences, without considering any temporal dynamics, had a large effect on the difference in entropy (Fig. 3A). This is to be expected when using a bin size of 5 ms to analyze neurons firing at <100 Hz, as was the case here. If only firing rates are considered, a firing rate of 100 Hz results in a spike in half the bins, i.e., the probability of a spike in each bin is 0.5. When only two outcomes are possible (0 or 1 spike per bin), the entropy is maximal when the probability of the outcome is 0.5 and thus the entropy in our case is maximal at 100 Hz and falls off monotonically as the firing rate decreases below this. Therefore significantly decreasing firing rates across a population of GPe cells will necessarily decrease the network entropy, given the firing rate distribution. Adding the autocorrelations to the rate model, however, decreased the difference in entropy between the lesioned and control animals (Fig. 3B), and as such, the autocorrelations seemed to reduce the entropy more in the control animals, a point that we will return to below. Next we examined the effect of cross-correlations, that is, synchrony at the level of pairs of neurons. The cross-correlations seemed to have a minimal effect, because the entropy distributions for the model with this factor were similar to the distributions for the model with only the rate factor (Fig. 3C). Finally, the full model, which took into account all three factors, was similar to the autocorrelation model, which also showed that the synchrony factor had a minimal effect for pairs of neurons (Fig. 3D).
FIG. 3.

Comparison of GPe network entropy in lesioned and control rats under each of the 4 models. A: entropy (H) when considering only firing rates. B: entropy when autocorrelations are added to the rate model. C: entropy when cross-correlations are added to the rate model. D: entropy in the full model, which takes into account firing rates, autocorrelations, and cross-correlations.
To directly determine the effect of either the autocorrelation or cross-correlation factor on the entropy, we next examined how much the entropy was decreased (ΔH) when either of these factors was added to the rate model. These effects are implicit in the results shown in Fig. 3. Consistent with those results, ΔH was larger for the control animals than for the lesioned animals when the autocorrelation factor was considered (Fig. 4A). In contrast, when the cross-correlation factor was considered, ΔH values were small for both the control and the lesioned animals, and as such, synchrony between pairs of neurons contributed minimally to reducing the overall network entropy (Fig. 4B). Finally, the full model was similar to the auto model, because most of the change in entropy came from the auto factor in the full model (Fig. 4C).
FIG. 4.

Decreases in entropy (ΔH) when additional parameter sets (factors) are included in the models. All changes are with respect to the model that includes only rates. A: ΔH for autocorrelations. B: ΔH for cross-correlations. C: ΔH for full model with auto- and cross-correlations.
Entropy rate, i.e., entropy per second, as we calculated here, gives an estimate of the information capacity of the network and bounds how well the network can represent time-varying behaviors, for example, movements. Entropy per spike is a less direct measure of how well the network can code dynamic behaviors because it has to be multiplied by the spike rate to get an estimate of the information capacity per unit time. However, although entropy per spike is ultimately not the more relevant metric for understanding the coding capacity of the network, it is interesting from a theoretical, efficiency point of view (Rieke et al. 1995), particularly because the spike rates were lower in the lesioned animals, and the effects of the autocorrelations were larger in the control animals. We thus tested whether the entropy per spike (rather than per bin or per second) was similar in the two GPe networks. We found that the entropy per spike was actually lower in the controls compared with lesioned animals. As such, each individual spike of each GPe neuron carried more information in the lesioned animals (Fig. 5).
FIG. 5.
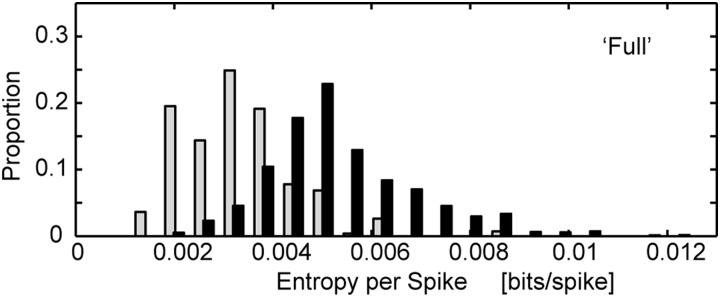
Entropy per spike of full model. Data for all GPe neurons is shown, but entropy rate (H per spike) for each neuron was divided by the average firing rate of that neuron.
Based on these analyses we can now ask: which of these changes in network dynamics contributed most to the decreased entropy observed in the GPe in lesioned animals? For this we calculated the proportional effects of each of the three factors: changes in rates, changes in autocorrelations, and changes in cross-correlations. We found that the effects were 1.84, −0.88, and 0.04 for rates, autocorrelations, and cross-correlations, respectively. In other words, the changes in firing rates had the largest effect (decreased entropy), the changes in autocorrelations actually made the entropy of the control and lesioned networks more similar (but affected entropy to a lesser degree than rate), and the changes in cross-correlations had the smallest effect (but also decreased entropy). Until now, we have only considered the effects of synchronous activity at the level of pairs of neurons. Below we extend these analyses to larger ensembles of simultaneously recorded neurons, as well as to the whole population of GPe neurons.
Ensemble entropy
The previous analyses examined the effects of cross-correlations and thus only considered the effects between pairs of neurons. It is possible that these effects on network entropy may become larger if the entire ensemble of simultaneously recorded neurons is considered. To address this, we compared the entropy when the effects of only one other neuron were being considered (pairs) to the entropy when the entire ensemble of simultaneously recorded neurons were being considered, where an ensemble is the set of simultaneously recorded neurons. We found that, in general, including all of the neurons in an ensemble had a minimal additional effect, relative to pairs, on reducing the entropy (Fig. 6, A and B). The effect was slightly larger in the lesioned animals than it was in the control animals (Fig. 6B), consistent with the fact that the (pairwise) cross-correlation effect was slightly larger in lesioned animals as well (Fig. 4B) and the fact that very few neuron pairs in controls had a significant synchronous term.
FIG. 6.

Comparison of ensemble and pairwise entropy. A: scatter plot of entropy in pairs (Hpairs) and entropy in corresponding ensemble (Hens). Each ensemble is plotted against all of the pairs into which it can be broken down. Points on the diagonal show no additional effect of additional neurons in the ensemble. B: distribution of differences between entropy in pairs and entropy in corresponding ensemble.
Higher-order effects
Another important way that our model can be extended is to consider higher-order effects. Specifically, similar to measuring cross-correlations linearly, we have only been considering the effects of a single bin of neural activity in the model. It is possible that patterns of spikes across two bins, either within the spike trains of a single neuron or between pairs of neurons, were important. To examine this, we estimated models that included pairwise interactions either from the lagged time bins of a single neuron or pairwise interactions between neurons in ensembles (see methods). We found that, in all cases, including these terms did not improve the model fit (BIC > 0). Thus there was no statistically supportable evidence in our data that quadratic terms were important.
Modeling effects at the population level
In the preceding analyses, we found only modest effects of cross-correlations between neurons on the network entropy. To some extent, this is to be expected, because theoretical studies showed that the effects of correlations tend to be small in pairs of neurons, whereas they can be large in networks of neurons (Averbeck et al. 2006; Narayanan et al. 2005). It is currently not feasible to record from or estimate the entropy in 100s or 1,000s of neurons. It is possible, however, to estimate the effects of correlations in large populations of neurons, using estimates of pairwise correlations across the population and a model of the population that makes certain assumptions. As such, we can estimate how large the effects of cross-correlations would be at the level of the entire GP neuron population.
We carried out this analysis in two steps. First, we showed that our model predicted correlation values in small ensembles of ≤12 simultaneously recorded neurons (Fig. 7A). Although we had a few larger ensembles, we were not able to subsample enough different ensembles of >12 neurons to derive reliable estimates. We randomly selected 400 recorded ensembles of various sizes and calculated the change (decrease) in entropy (ΔH) as a function of ensemble size. We used our model to predict average ΔH values using information about pairwise correlations between recorded neurons. We found a close correspondence between our model and the data (Fig. 7A). Thus for small ensembles, our model closely predicted ΔH.
FIG. 7.

Decrease in entropy (ΔH) as function of ensemble size and model prediction. A: average ΔH in 400 random ensembles of simultaneously recorded neurons of each size (thin lines; error bars are ±SE) and model predictions (thick lines). B: predicted ΔH as a function of ensemble size for large populations.
Next, we used the measured values of correlations between pairs of neurons to generate a population covariance matrix, for populations of various sizes, and examined how ΔH scaled with the size of the population. We found that, although ΔH rises steeply up to a population size of ∼100 neurons, it flattens after that and saturates at a value of ∼0.021 on average for the GPe neuron population in the lesioned animals and ∼0.011 for the control population (Fig. 7B). Thus the effects of cross-correlations at the population level remain somewhat modest compared with either autocorrelations or firing rates, but they are much larger than they are in pairs.
Similar to the analysis carried out above for pairs of neurons, we can examine the relative contribution of each factor to decreasing the entropy using our network estimates. In this case, we found that the effects were 1.838, −0.882, and 0.051 for rates, autocorrelations, and cross-correlations, respectively. Thus while there is a large increase in the effect of correlations at the population level, it is still small compared with the other effects.
DISCUSSION
We examined the effects of changes in activity dynamics brought about by chronic dopamine depletion on the entropy in the GPe network. Our analyses showed that network entropy, and thus information coding capacity, was significantly reduced in the lesioned animals compared with controls. This reduction in entropy arose chiefly because of decreases in GPe neuron firing rates, although increases in cross-correlations (synchrony) between neurons also significantly contributed. Interestingly, the autocorrelations in GPe were more structured in control animals and actually decreased the entropy more in these animals than it did in the lesioned ones. As with previous studies (Averbeck and Lee 2006; Petersen et al. 2001) and consistent with theoretical predictions (Averbeck et al. 2006; Shamir and Sompolinsky 2004), the effects of cross-correlations were limited at the level of pairs of neurons. However, the effects of synchronized activities were larger at the network level (Averbeck et al. 2006; Narayanan et al. 2005).
Classical theories of basal ganglia dysfunction in movement disorders have suggested that decreases in neural activity in the GPe, which is part of the indirect pathway, would contribute to movement deficits (Albin et al. 1989; DeLong 1990). Consistent with this idea, we did find that the spike rates of GPe neurons were decreased. We have, however, taken a different perspective on this decrease in firing rates. We examined the effect of this decrease on the entropy in the network, and therefore we assumed that the decrease in firing rates changes the ability of the population to code information. An advantage of using information theory to examine these effects is that it allows us to compare, within a single analytical framework, the effects of changes in rates to the effects brought about by changes in other activity dynamics, such as cross-correlations and autocorrelations. The classical theory has no way of accounting for how changes in activity dynamics other than firing rates influence behavior, because it assumes that the total activity of a nucleus somehow relates to whether a specific movement will be executed.
Implicit in our approach is the idea that activity patterns within the GPe code information. Thus we are assuming that neurons within the basal ganglia have tuning functions (Boussaoud and Kermadi 1997), similar to cortical and thalamic neurons (Georgopoulos et al. 1982), such that the activity of single neurons varies in a continuous way with some underlying task variable, such as force or direction (Pasquereau et al. 2007). Thus the activity of an individual neuron would not accurately code information about movements. Rather, the activity across a population of neurons would code that information. Simply increasing or decreasing firing rates in the population would not necessarily affect the movement being encoded. From this point of view, the entropy of the network constrains how well the network can code information, and it is these coding constraints that might lead to movement difficulties.
The exaggerated β-frequency synchronization seen in the cross-correlations in the GPe in our animal model is similar to that recorded in the subthalamic nucleus (STN), which is reciprocally connected with GPe in patients with PD (Brown 2003; Brown et al. 2001; Levy et al. 2002; Williams et al. 2002). These studies have shown that β activity was stronger when the patients were off dopamine replacement medication (Brown et al. 2001; Williams et al. 2002), that the oscillatory activity decreased during movements or movement preparation (Brown and Williams 2005; Kuhn et al. 2004b; Levy et al. 2002; Williams et al. 2005), and that this decrease was facilitated if patients were on dopamine medication (Doyle et al. 2005). Taken together, this work suggests that dopamine desynchronizes β activity in basal ganglia networks, and this desynchronization may be important for action initiation. From the point of view of information coding, the β-frequency synchronization might constrain the ability of the network to represent or encode movements. Thus our finding is consistent with recordings in PD patients with movement difficulties. That said, the excessive synchronization in GPe is concomitant with decreased firing rates therein and therefore, most probably, changes in both these features of activity are important.
A key consideration of our study is that we analyzed GPe activity recorded in anesthetized animals. We assume that the entropy changes occurring under anesthesia are also relevant for the GPe in the awake, behaving animal. There is good evidence to support the extrapolation of our findings to the unanesthetized state. First, the β synchronization we analyzed occurs in both anesthetized and awake 6-OHDA–lesioned rats (Degos et al. 2009; Mallet et al. 2008a,b; Sharott et al. 2005). Moroever, we restricted our analysis to the GPe activity present during a spontaneous activated brain state, which mimics that accompanying the alert behaviors in which β osciallions are most prominent in PD patients and lesioned rats (Mallet et al. 2008a; Sharott et al. 2005; Urrestarazu et al. 2009). In addition, other studies have shown that network dynamics in the undriven state are similar to those in the driven state. For example, studies of primary visual cortices in anesthetized animals have shown that V1 neurons dynamically drift through states that are similar to those seen when the system is driven (Kenet et al. 2003), and neural activity patterns are largely caused by intrinsic dynamics as opposed to sensory inputs (Fiser et al. 2004). Thus the entropy in the GPe network during behavior may be similar to the entropy during rest. Second, the network dynamics we define here are probably the result of plasticity in the network because they only appear several days after dopamine neurons are lesioned (Degos et al. 2009; Mallet et al. 2008b). Thus disturbed activities in the anesthetized state are likely caused by underlying changes in the microcircuit and therefore may still be present in the awake state, and the entropy reductions we showed will likely pertain to behaving animals. However, because synchronized β oscillations are dynamic phenomena, which fluctuate in time as a function of dopamine and behavior (Doyle et al. 2005; Kuhn et al. 2004a), it would still be of interest to test in the future whether and how network entropy changes during specific phases of a movement.
The results of functional surgical procedures for PD also have bearing on our coding hypothesis. Focal lesions of the STN or internal pallidum have positive therapeutic effects on the motor symptoms of PD. However, the information coding capacity of the lesioned nuclei must decrease because the number of available neurons is reduced. Moreover, therapeutic high-frequency stimulation (HFS) of the STN also reduces the entropy per spike of single neurons in the pallidum and thalamus in Parkinsonian monkeys (Dorval et al. 2008). However, although HFS decreased GPe bits per spike, it also increased firing rates (Dorval et al. 2008). Because of this rate change, and because extrapolating single-neuron entropy calculated in bits/spike to the network level (calculated here in bits per second) is not straightforward (see Fig. 5), it is unclear whether or not the overall GPe network entropy is decreased with HFS.
Regardless, one implication of the functional surgical procedures is that some aspects of synchronization are not captured by our single-nucleus estimation of information coding restriction, and this demands consideration of the extended cortico-basal ganglia circuit. Indeed, synchronization limits the local information coding space but is also influential over subsequent stages of processing. Moreover, downstream responses to the deleterious effects of synchronization might exhibit frequency tuning, such that not all frequencies are equivalent across the coding space (Eusebio et al. 2008). Although we can estimate the upper limit of information coding capacity, we do not know what aspects of the information coding space may be more influential or more deleterious to targets. Nevertheless, the use of information theory provides us with a starting point and an analytical framework with which to evaluate the separate and combined effects of firing rate, oscillations, and synchronization in the basal ganglia.
The single-cell and network mechanisms underlying the emergence of these changes in GPe are largely unknown, but deranged afferent activity is likely to play an important role. Excessively synchronized rhythmic “drive” from the STN in lesioned animals is a good candidate substrate for the increased synchronization observed in GPe (Mallet et al. 2008a). However, because STN neurons are hyperactive during Parkinsonian β oscillations (Mallet et al. 2008b), the most parsimonious explanation for the depressed firing rates in GPe is that the network receives an inappropriately strong inhibition from striatum after dopamine loss (Mallet et al. 2006). Lesion-induced alterations in the intrinsic “pacemaking” properties of GPe neurons (Surmeier et al. 2005) might well bring about the changes in their firing regularity (autocorrelations). An important issue for future research is thus to understand which changes in microcircuit properties give rise to the decreased firing rates and increased synchronization. Microcircuit properties have to change somewhere, to give rise to the changes in dynamics, because the dynamics are a function of the microcircuit. One powerful way to explore the changes in microcircuit properties responsible for the changes in dynamics will be to build realistic spiking-neuron network models of this system and examine the changes in the model network that could give rise to the changes seen in the network in vivo. The basal ganglia should be a fruitful place to apply such techniques, because so much is known about the microcircuitry (Smith et al. 1998).
Conclusions
Our analyses have shown that there are changes in firing rates, single-cell oscillations, and synchrony in the GPe when dopamine is chronically depleted, as in PD. We used information theory techniques to show how these changes in network dynamics lead to changes in the entropy of the system and found that there is significantly less entropy in the Parkinsonian GPe network. Thus our results are consistent with the general hypothesis that changes in network dynamics lead to changes in the entropy of the GPe network, and it is this impaired ability of the network to code information that may contribute to motor and cognitive deficits in disorders like PD.
GRANTS
A. Cruz was supported by Fundação para a Ciência e Tecnologia Grant SFRH/BD/33201/2007 and Fundação Gulbenkian and N. Mallet and P. J. Magill were supported by the Medical Research Council UK, The Dana Foundation USA, and The Parkinson's Disease Society of the United Kingdom (Grant G-0806). B. B. Averbeck was supported by the Wellcome Trust.
APPENDIX
Population model
In this appendix we present the mathematical details of our population model. We were interested in the effects of correlations at the population level. From the data, we directly estimated ΔH in ensembles of ≤19 simultaneously recorded neurons. However, the effects of correlations (synchronization) will likely be larger at the population level (Averbeck et al. 2006). Because we currently do not have techniques for either recording from or estimating information in entire populations of neurons, we have to estimate the impact of correlations at the population level using model extrapolations. To make this estimate, we developed a model that is consistent with the results of the empirical analyses. Specifically, we used only measured pairwise covariances to estimate ΔH at the population level.
Only linear terms were significant in the logistic regression model; adding the higher-order terms did not improve prediction (see results). Thus our model was developed by estimating the performance of a linear classifier. Derivation of linear classifiers is generally done by making Gaussian assumptions on the distribution of the variables used for prediction. Although our individual variables are binomial, for large neuronal populations, linear functions of binomial random variables will converge to Gaussians, via the central limit theorem (Papoulis 1991).
Least squares estimators can be used to find optimal linear classifiers (Duda et al. 2001). Thus our classifier is given by
 |
(A1) |
Here, ηi is an estimate of whether or not a spike occurred (not constrained to lie between 0 and 1 as it is in the logistic regression model), the vector s represents the spiking in the set of simultaneously recorded neurons, and the vector b is our decision boundary estimated with least squares. It can be shown that, for a particular choice of ηi values, the linear decision boundary b will be the same as the Fisher decision boundary (Duda et al. 2001). Specifically, if we set
 |
(A2) |
where ri is the firing rate of neuron i, it can be shown that b is the Fisher discriminant boundary. We can find b and the residual variance of this estimator using standard linear model results
 |
(A3) |
 |
(A4) |
If we define the matrices
 |
 |
(A5) |
We can write the residual variance as
 |
 |
(A6) |
Thus to estimate the residual variance, we have to calculate the matrices Cηs and Css. The variance of the dependent variable is given by
 |
(A7) |
Css can be measured directly in the data as this is the covariance matrix between spike trains. Individual elements of this matrix are given by
 |
(A8) |
The covariance between sj and the ηi is
 |
(A9) |
To estimate our classification performance, which can be used to estimate the residual entropy, we have to know the difference in the means for the estimates of a spike and no spike and the variance of the distributions about the means generated by our linear estimator. The means can be calculated from
 |
 |
(A10) |
The conditional probabilities are given by
 |
(A11) |
where
 |
(A12) |
is the second, noncentral moment. Correspondingly we calculate
 |
(A13) |
Finally, the total variance  can be factored into bias and variance components, which allows us to calculate the variance around the mean estimates. Specifically
 |
(A14) |
Our classification accuracy is given by
 |
(A15) |
This can be converted to fraction correct classification performance using the error function (Averbeck and Lee 2006)
 |
(A16) |
The fraction correct can be converted to ΔH.
The model was estimated by sampling covariance matrices randomly from the distribution of covariance values estimated for all pairs of neurons and estimating ΔH for the corresponding population. The average covariance values for the lesioned data were 0.0088, and the average values for the control data were 0.0068. This was done 5,000 times, and the results were averaged to give the curves shown in Fig. 7. Firing rates for all neurons were set to 0.125 spikes/bin in the lesion data and 0.325 spikes/bin in the control data. Although these rates are slightly higher than the average rates estimated in the data, they give average entropy values that match those in the data. Because entropy is a nonlinear function of rate, the average rate does not give the average entropy. Thus we could match the rates or the entropy, so we chose to match the entropy.
REFERENCES
- Aizman et al. 2000.Aizman O, Brismar H, Uhlen P, Zettergren E, Levey AI, Forssberg H, Greengard P, Aperia A. Anatomical and physiological evidence for D1 and D2 dopamine receptor colocalization in neostriatal neurons. Nat Neurosci 3: 226–230, 2000. [DOI] [PubMed] [Google Scholar]
- Albin et al. 1989.Albin RL, Young AB, Penney JB. The functional anatomy of basal ganglia disorders. Trends Neurosci 12: 366–375, 1989. [DOI] [PubMed] [Google Scholar]
- Averbeck et al. 2006.Averbeck BB, Latham PE, Pouget A. Neural correlations, population coding and computation. Nat Rev Neurosci 7: 358–366, 2006. [DOI] [PubMed] [Google Scholar]
- Averbeck and Lee 2006.Averbeck BB, Lee D. Effects of noise correlations on information encoding and decoding. J Neurophysiol 95: 3633–3644, 2006. [DOI] [PubMed] [Google Scholar]
- Bergman et al. 1998.Bergman H, Feingold A, Nini A, Raz A, Slovin H, Abeles M, Vaadia E. Physiological aspects of information processing in the basal ganglia of normal and parkinsonian primates. Trends Neurosci 21: 32–38, 1998. [DOI] [PubMed] [Google Scholar]
- Boussaoud and Kermadi 1997.Boussaoud D, Kermadi I. The primate striatum: neuronal activity in relation to spatial attention versus motor preparation.Eur J Neurosci 9: 2152–2168, 1997. [DOI] [PubMed] [Google Scholar]
- Brown 2003.Brown P Oscillatory nature of human basal ganglia activity: relationship to the pathophysiology of Parkinson's disease.Mov Disord 18: 357–363, 2003. [DOI] [PubMed] [Google Scholar]
- Brown 2006.Brown P Bad oscillations in Parkinson's disease. J Neural Transm Suppl: 27–30, 2006. [DOI] [PubMed]
- Brown et al. 2001.Brown P, Oliviero A, Mazzone P, Insola A, Tonali P, Di Lazzaro V. Dopamine dependency of oscillations between subthalamic nucleus and pallidum in Parkinson's disease. J Neurosci 21: 1033–1038, 2001. [DOI] [PMC free article] [PubMed] [Google Scholar]
- Brown and Williams 2005.Brown P, Williams D. Basal ganglia local field potential activity: character and functional significance in the human.Clin Neurophysiol 116: 2510–2519, 2005. [DOI] [PubMed] [Google Scholar]
- Christensen 1997.Christensen R Log-Linear Models and Logistic Regression. New York: Springer, 1997.
- Degos et al. 2009.Degos B, Deniau JM, Chavez M, Maurice N. Chronic but not acute dopaminergic transmission interruption promotes a progressive increase in cortical beta frequency synchronization: relationships to vigilance state and akinesia. Cereb Cortex 19: 1616–1630, 2009. [DOI] [PubMed] [Google Scholar]
- DeLong 1990.DeLong MR Primate models of movement disorders of basal ganglia origin. Trends Neurosci 13: 281–285, 1990. [DOI] [PubMed] [Google Scholar]
- Dorval et al. 2008.Dorval AD, Russo GS, Hashimoto T, Xu W, Grill WM, Vitek JL. Deep brain stimulation reduces neuronal entropy in the MPTP-primate model of Parkinson's disease. J Neurophysiol 100: 2807–2818, 2008. [DOI] [PMC free article] [PubMed] [Google Scholar]
- Doyle et al. 2005.Doyle LM, Kuhn AA, Hariz M, Kupsch A, Schneider GH, Brown P. Levodopa-induced modulation of subthalamic beta oscillations during self-paced movements in patients with Parkinson's disease. Eur J Neurosci 21: 1403–1412, 2005. [DOI] [PubMed] [Google Scholar]
- Duda et al. 2001.Duda RO, Hart PE, Stork DG. Pattern Classification. New York: John Wiley and Sons, 2001.
- Efron and Tibshirani 1998.Efron B, Tibshirani RJ. An Introduction to the Bootstrap. New York: Chapman and Hall, 1998.
- Eusebio et al. 2008.Eusebio A, Chen CC, Lu CS, Lee ST, Tsai CH, Limousin P, Hariz M, Brown P. Effects of low-frequency stimulation of the subthalamic nucleus on movement in Parkinson's disease. Exp Neurol 209: 125–130, 2008. [DOI] [PMC free article] [PubMed] [Google Scholar]
- Fiser et al. 2004.Fiser J, Chiu C, Weliky M. Small modulation of ongoing cortical dynamics by sensory input during natural vision.Nature 431: 573–578, 2004. [DOI] [PubMed] [Google Scholar]
- Georgopoulos et al. 1982.Georgopoulos AP, Kalaska JF, Caminiti R, Massey JT. On the relations between the direction of two-dimensional arm movements and cell discharge in primate motor cortex. J Neurosci 2: 1527–1537, 1982. [DOI] [PMC free article] [PubMed] [Google Scholar]
- Goldberg et al. 2004.Goldberg JA, Rokni U, Boraud T, Vaadia E, Bergman H. Spike synchronization in the cortex/basal-ganglia networks of Parkinsonian primates reflects global dynamics of the local field potentials. J Neurosci 24: 6003–6010, 2004. [DOI] [PMC free article] [PubMed] [Google Scholar]
- Hastie et al. 2001.Hastie T, Tibshirani RJ, Friedman J. The Elements of Statistical Learning. New York: Springer-Verlag, 2001.
- Kenet et al. 2003.Kenet T, Bibitchkov D, Tsodyks M, Grinvald A, Arieli A. Spontaneously emerging cortical representations of visual attributes.Nature 425: 954–956, 2003. [DOI] [PubMed] [Google Scholar]
- Kincaid et al. 1991.Kincaid AE, Penney JB Jr, Young AB, Newman SW. Evidence for a projection from the globus pallidus to the entopeduncular nucleus in the rat. Neurosci Lett 128: 121–125, 1991. [DOI] [PubMed] [Google Scholar]
- Kuhn et al. 2004a.Kuhn AA, Grosse P, Holtz K, Brown P, Meyer BU, Kupsch A. Patterns of abnormal motor cortex excitability in atypical parkinsonian syndromes. Clin Neurophysiol 115: 1786–1795, 2004a. [DOI] [PubMed] [Google Scholar]
- Kuhn et al. 2004b.Kuhn AA, Williams D, Kupsch A, Limousin P, Hariz M, Schneider GH, Yarrow K, Brown P. Event-related beta desynchronization in human subthalamic nucleus correlates with motor performance.Brain 127: 735–746, 2004b. [DOI] [PubMed] [Google Scholar]
- Levy et al. 2002.Levy R, Ashby P, Hutchison WD, Lang AE, Lozano AM, Dostrovsky JO. Dependence of subthalamic nucleus oscillations on movement and dopamine in Parkinson's disease. Brain 125: 1196–1209, 2002. [DOI] [PubMed] [Google Scholar]
- Ljung 1999.Ljung L System Identification, Theory for the User. Upper Saddle River, NJ: Prentice Hall, 1999.
- Magill et al. 2006.Magill PJ, Pogosyan A, Sharott A, Csicsvari J, Bolam JP, Brown P. Changes in functional connectivity within the rat striatopallidal axis during global brain activation in vivo. J Neurosci 26: 6318–6329, 2006. [DOI] [PMC free article] [PubMed] [Google Scholar]
- Mallet et al. 2006.Mallet N, Ballion B, Le Moine C, Gonon F. Cortical inputs and GABA interneurons imbalance projection neurons in the striatum of parkinsonian rats. J Neurosci 26: 3875–3884, 2006. [DOI] [PMC free article] [PubMed] [Google Scholar]
- Mallet et al. 2008a.Mallet N, Pogosyan A, Marton LF, Bolam JP, Brown P, Magill PJ. Parkinsonian beta oscillations in the external globus pallidus and their relationship with subthalamic nucleus activity. J Neurosci 28: 14245–14258, 2008a. [DOI] [PMC free article] [PubMed] [Google Scholar]
- Mallet et al. 2008b.Mallet N, Pogosyan A, Sharott A, Csicsvari J, Bolam JP, Brown P, Magill PJ. Disrupted dopamine transmission and the emergence of exaggerated beta oscillations in subthalamic nucleus and cerebral cortex.J Neurosci 28: 4795–4806, 2008b. [DOI] [PMC free article] [PubMed] [Google Scholar]
- Narayanan et al. 2005.Narayanan NS, Kimchi EY, Laubach M. Redundancy and synergy of neuronal ensembles in motor cortex. J Neurosci 25: 4207–4216, 2005. [DOI] [PMC free article] [PubMed] [Google Scholar]
- Nini et al. 1995.Nini A, Feingold A, Slovin H, Bergman H. Neurons in the globus pallidus do not show correlated activity in the normal monkey, but phase-locked oscillations appear in the MPTP model of parkinsonism. J Neurophysiol 74: 1800–1805, 1995. [DOI] [PubMed] [Google Scholar]
- Papoulis 1991.Papoulis A Probability, Random Variables and Stochastic Processes. New York: McGraw-Hill Higher Education, 1991.
- Parent and De Bellefeuille 1983.Parent A, De Bellefeuille L. The pallidointralaminar and pallidonigral projections in primate as studied by retrograde double-labeling method. Brain Res 278: 11–27, 1983. [DOI] [PubMed] [Google Scholar]
- Parent and Hazrati 1995.Parent A, Hazrati LN. Functional anatomy of the basal ganglia. II. The place of subthalamic nucleus and external pallidum in basal ganglia circuitry. Brain Res Brain Res Rev 20: 128–154, 1995. [DOI] [PubMed] [Google Scholar]
- Pasquereau et al. 2007.Pasquereau B, Nadjar A, Arkadir D, Bezard E, Goillandeau M, Bioulac B, Gross CE, Boraud T. Shaping of motor responses by incentive values through the basal ganglia. J Neurosci 27: 1176–1183, 2007. [DOI] [PMC free article] [PubMed] [Google Scholar]
- Paxinos and Watson 1986.Paxinos G, Watson C. The Rat Brain in Stereotaxic Coordinates. Sydney, Australia: Academic Press, 1986.
- Petersen et al. 2001.Petersen RS, Panzeri S, Diamond ME. Population coding of stimulus location in rat somatosensory cortex. Neuron 32: 503–514, 2001. [DOI] [PubMed] [Google Scholar]
- Raz et al. 1996.Raz A, Feingold A, Zelanskaya V, Vaadia E, Bergman H. Neuronal synchronization of tonically active neurons in the striatum of normal and parkinsonian primates. J Neurophysiol 76: 2083–2088, 1996. [DOI] [PubMed] [Google Scholar]
- Raz et al. 2001.Raz A, Frechter-Mazar V, Feingold A, Abeles M, Vaadia E, Bergman H. Activity of pallidal and striatal tonically active neurons is correlated in mptp-treated monkeys but not in normal monkeys. J Neurosci 21: RC128, 2001. [DOI] [PMC free article] [PubMed] [Google Scholar]
- Raz et al. 2000.Raz A, Vaadia E, Bergman H. Firing patterns and correlations of spontaneous discharge of pallidal neurons in the normal and the tremulous 1-methyl-4-phenyl-1,2,3,6-tetrahydropyridine vervet model of parkinsonism. J Neurosci 20: 8559–8571, 2000. [DOI] [PMC free article] [PubMed] [Google Scholar]
- Rieke et al. 1995.Rieke F, Bodnar DA, Bialek W. Naturalistic stimuli increase the rate and efficiency of information transmission by primary auditory afferents. Proc R Soc Lond B Biol Sci 262: 259–265, 1995. [DOI] [PubMed] [Google Scholar]
- Schneidman et al. 2006.Schneidman E, Berry MJ II, Segev R, Bialek W. Weak pairwise correlations imply strongly correlated network states in a neural population. Nature 440: 1007–1012, 2006. [DOI] [PMC free article] [PubMed] [Google Scholar]
- Schwarting and Huston 1996a.Schwarting RK, Huston JP. The unilateral 6-hydroxydopamine lesion model in behavioral brain research. Analysis of functional deficits, recovery and treatments.Prog Neurobiol 50: 275–331, 1996a. [DOI] [PubMed] [Google Scholar]
- Schwarting and Huston 1996b.Schwarting RK, Huston JP. Unilateral 6-hydroxydopamine lesions of meso-striatal dopamine neurons and their physiological sequelae.Prog Neurobiol 49: 215–266, 1996b. [DOI] [PubMed] [Google Scholar]
- Shamir and Sompolinsky 2004.Shamir M, Sompolinsky H. Nonlinear population codes. Neural Comput 16: 1105–1136, 2004. [DOI] [PubMed] [Google Scholar]
- Sharott et al. 2005.Sharott A, Magill PJ, Harnack D, Kupsch A, Meissner W, Brown P. Dopamine depletion increases the power and coherence of beta-oscillations in the cerebral cortex and subthalamic nucleus of the awake rat. Eur J Neurosci 21: 1413–1422, 2005. [DOI] [PubMed] [Google Scholar]
- Smith et al. 1998.Smith Y, Bevan MD, Shink E, Bolam JP. Microcircuitry of the direct and indirect pathways of the basal ganglia. Neuroscience 86: 353–387, 1998. [DOI] [PubMed] [Google Scholar]
- Steriade 2000.Steriade M Corticothalamic resonance, states of vigilance and mentation. Neuroscience 101: 243–276, 2000. [DOI] [PubMed] [Google Scholar]
- Strong et al. 1998.Strong SP, Koberle R, de Ruyter van Steveninck RR, Bialek W. Entropy and information in neural spike trains. Phys Rev Lett 80: 197–200, 1998. [Google Scholar]
- Surmeier et al. 2005.Surmeier DJ, Mercer JN, Chan CS. Autonomous pacemakers in the basal ganglia: who needs excitatory synapses anyway? Curr Opin Neurobiol 15: 312–318, 2005. [DOI] [PubMed] [Google Scholar]
- Surmeier et al. 1996.Surmeier DJ, Song WJ, Yan Z. Coordinated expression of dopamine receptors in neostriatal medium spiny neurons.J Neurosci 16: 6579–6591, 1996. [DOI] [PMC free article] [PubMed] [Google Scholar]
- Urrestarazu et al. 2009.Urrestarazu E, Iriarte J, Alegre M, Clavero P, Rodriguez-Oroz MC, Guridi J, Obeso JA, Artieda J. Beta activity in the subthalamic nucleus during sleep in patients with Parkinson's disease. Mov Disord 24: 254–260, 2009. [DOI] [PubMed] [Google Scholar]
- Vila et al. 2000.Vila M, Perier C, Feger J, Yelnik J, Faucheux B, Ruberg M, Raisman-Vozari R, Agid Y, Hirsch EC. Evolution of changes in neuronal activity in the subthalamic nucleus of rats with unilateral lesion of the substantia nigra assessed by metabolic and electrophysiological measurements.Eur J Neurosci 12: 337–344, 2000. [DOI] [PubMed] [Google Scholar]
- Williams et al. 2005.Williams D, Kuhn A, Kupsch A, Tijssen M, van Bruggen G, Speelman H, Hotton G, Loukas C, Brown P. The relationship between oscillatory activity and motor reaction time in the parkinsonian subthalamic nucleus. Eur J Neurosci 21: 249–258, 2005. [DOI] [PubMed] [Google Scholar]
- Williams et al. 2003.Williams D, Kuhn A, Kupsch A, Tijssen M, van Bruggen G, Speelman H, Hotton G, Yarrow K, Brown P. Behavioural cues are associated with modulations of synchronous oscillations in the human subthalamic nucleus. Brain 126: 1975–1985, 2003. [DOI] [PubMed] [Google Scholar]
- Williams et al. 2002.Williams D, Tijssen M, Van Bruggen G, Bosch A, Insola A, Di Lazzaro V, Mazzone P, Oliviero A, Quartarone A, Speelman H, Brown P. Dopamine-dependent changes in the functional connectivity between basal ganglia and cerebral cortex in humans. Brain 125: 1558–1569, 2002. [DOI] [PubMed] [Google Scholar]