

Abstract
Caenorhabditis elegans exhibits spontaneous motility in isotropic environments, characterized by periods of forward movements punctuated at random by turning movements. Here, we study the statistics of turning movements—deep Ω-shaped bends—exhibited by swimming worms. We show that the durations of intervals between successive Ω-turns are uncorrelated with one another and are effectively selected from a probability distribution resembling the sum of two exponentials. The worm initially exhibits frequent Ω-turns on being placed in liquid, and the mean rate of Ω-turns lessens over time. The statistics of Ω-turns is consistent with a phenomenological model involving two behavioral states governed by Poisson kinetics: a “slow” state generates Ω-turns with a low probability per unit time; a “fast” state generates Ω-turns with a high probability per unit time; and the worm randomly transitions between these slow and fast states. Our findings suggest that the statistics of spontaneous Ω-turns exhibited by swimming worms may be described using a small number of parameters, consistent with a two-state phenomenological model for the mechanisms that spontaneously generate Ω-turns.
INTRODUCTION
Living nervous systems exhibit spontaneous and stochastic dynamics. Except for the simplest reflex arcs, afferents to neural circuits modulate ongoing patterns of activity rather than trigger activity from prior inactivity. Animal behavior can be spontaneous, because motor systems do not always passively await input from sensory systems. Although characterizing spontaneous and stochastic dynamics in the absence of sensory input is an essential part of understanding neural circuits and behavior, it typically receives less attention than characterizing stimulus-evoked dynamics.
The nematode Caenorhabditis elegans, with its small 302-neuron nervous system and limited behavioral repertoire, facilitates quantitative and comprehensive study of the neural basis of behavior. Here, we study the spontaneous swimming behavior of worms placed in microdroplets. When worms swim, periods of forward movement are driven by bending waves that propagate from head to tail. These periods of forward movement are interrupted at random by sudden turning movements and deep bends also called Ω-turns because the worm's body briefly resembles the Greek letter. Ω-turns represent a highly stereotyped motor behavior that can be treated as a point process over time, which is straightforward to quantify using video analysis that quantifies the posture of each worm within each video frame (Chung et al. 2006; Clark et al. 2007; Luo et al. 2008).
Here, we analyze the statistics of the intervals between successive Ω-turns exhibited by individual worms over time. We find that the interval durations between successive Ω-turns are uncorrelated with one another and are effectively drawn from a probability distribution that resembles the sum of two exponential components: an exponential component with a short time constant and an exponential component with a long time constant. When worms are placed in liquid, they initially exhibit Ω-turns at a high rate that gradually lessens over time. We find that this gradual reduction in rate is caused by increase in the time constants of the exponential components in the interval distribution between Ω-turns, as opposed to change in the fractional weight of the two exponential components that comprise the overall distribution.
Mutations in well-studied neurotransmitter pathways (GABA, dopamine, glutamate, and serotonin) have been shown to affect the statistics of reorientation movements exhibited by crawling worms (Hills et al. 2004; Shingai 2000). We find that some of these mutations also affect the turning statistics exhibited by swimming worms and that mutant-to-mutant variations in turning behavior may be attributed to variations in the parameters of the two exponential components in the interval distribution between successive Ω-turns.
A phenomenological model that is consistent with our empirical observations is that the worm can generate Ω-turns when it is in one of two states: a “fast” state and a “slow” state. Each state generates Ω-turns with Poisson kinetics, each state with its own time constant, and the worm randomly transitions between the two states. Thus a minimal stochastic model can reproduce the spontaneous Ω-turns exhibited during swimming, providing a statistical framework for further characterization of the motile behavior of swimming C. elegans.
METHODS
Strains
Nematodes were cultivated at 20°C on agar plates covered with the Escherichia coli strain OP50. The wild-type N2 strain and mutant strains eat-4 (ad819), osm-6 (p811), unc-25, and unc-47 were obtained from the C. elegans Genetics Center. Mutant strains glr-1(ky176), glr-2(ak10), glr-3(ak57), glr-6(ak56), and glr3(ak57)/glr-6(ak56) were obtained from A. V. Maricq (University of Utah, Salt Lake City, UT). Mutant strains tph-1 (n4622), cat-2 (n4547), and cat-4 (n2458) were obtained from H. R. Horvitz (MIT, Cambridge, MA).
Experimental procedure
All worms were cultivated at 20°C on nematode growth media (NGM) plates with the bacterial food OP50 under standard laboratory conditions (Sulston and Hodgkin 1988). All experiments were conducted in a room maintained at 20°C. Worms were taken off food plates, rinsed for 1 min in NGM buffer (same inorganic ion concentration as NGM plates), and placed in an ∼1-μl droplet of NGM buffer suspended from a glass slide and obliquely illuminated using LEDs. An array of 12 droplets was imaged at 10 Hz with a CCD camera for 30 min, and the posture of individual worms in each video frame was analyzed by a custom-written machine vision program (as used by Luo et al. 2008 and analogous to other types of machine vision software for the analysis of worm behavior; e.g., Baek et al. 2002; Geng et al. 2003, 2004; Tsechpenakis et al. 2008).
Ω-turns were detected by measuring the extension of the worm's body (i.e., the largest distance between two points on the worm in each video frame, a value that is high during forward or reverse swimming and drops sharply during each Ω-turn). We flagged each Ω-turn as an event in which the extension dropped below ∼60% of its maximal value and rejected events that were scored <0.3 s after the previous event to ensure against double-counting single Ω-turns, a possibility that could arise from noise in the measurements of body extension. We verified that imposing the 0.3-s minimum duration did not erase actual Ω-turns by checking that reducing the minimum duration did not significantly affect any statistics.
To verify the robustness of the algorithm for flagging Ω-turns, we checked by eye that the body of the worm actually resembled the Greek letter Ω during each flagged Ω-turn and also checked that the algorithm did not flag Ω-turns during forward swimming or reverse swimming. For swimming worms, Ω-turns outnumber periods of reverse swimming by ∼20:1, so we chose not to pursue the statistics of reversals in this study.
Statistical analysis
Statistical analysis was performed using custom-written code in Matlab (Mathworks, Natick, MA). Each experiment lasted 30 min, and the statistics for the 0- to 10-, 10- to 20-, and 20- to 30-min observation periods were analyzed separately for each strain. The intervals between successive Ω-turns exhibited by each animal within each observation period were fit to the sum of two exponentials using least-squares fitting. The general form of the sum of two exponentials is
 |
The fit to the sum of two exponentials yields three independent parameters: a short time constant τ1, a long time constant τ2, and the fractional weight of the short intervals in the overall distribution B. In each case, the χ2 test was used to verify that the fit to the sum of two exponentials could not be rejected at P < 0.05.
To compare mutant and wild-type statistics, we used the bootstrapping method to estimate the variance in the three parameters of the sum of two exponentials (Davison and Hinkley 2006). In brief, n = 100 bootstrap resamples were generated using the empirically measured time series of Ω-turns for each mutant and wild-type strain in each 10-min period of each experiment. The distribution of intervals between Ω-turns for each bootstrap resample was fit to the sum of two exponentials by the least-squares method to generate the three parameters τ1, τ2, and B. The mean and SD of each parameter were computed from the set of bootstrap resamples, and Student's t-test was performed to identify any statistically significant differences between these parameters for mutant and wild-type worms.
Phenomenological model for turning behavior
We used a Hidden Markov Model Toolbox for MatLab to analyze a phenomenological model (depicted in Fig. 6A) in which worms transitioned between two states to generate Ω-turns, executing a sequence of Ω-turns whose probability of occurrence per unit time was determined by the kinetics of each state. Using an expectation maximization (EM) learning algorithm, we computed the maximum-likelihood state transition parameters for the phenomenological model that best matched the intervals between successive Ω-turns exhibited by wild-type worms. Figure 6, B–D, was generated from simulations of this model.
RESULTS
Microdroplet assay for quantifying stochastic turning of individual swimming worms
We monitored the Ω-turns exhibited by individual swimming worms immediately after being transferred to clean microdroplets of NGM buffer after being removed from cultivation with bacteria on agar plates (Fig. 1). We found that the statistics of Ω-turns exhibited by wild-type worms followed stereotyped dynamics over the course of 30 min. A cumulative plot of Ω-turns exhibited by individual worms reveals sharp vertical steps that represent one or more Ω-turns in rapid succession as well as plateaus that represent long intervals between Ω-turns (Fig. 2A). The mean rate of exhibiting Ω-turns gradually lessens over time (from ∼0.15/s at the start of observation to ∼0.05/s at the end of 30 min; Fig. 2, B and C). Worms swam incessantly for the 30 min of observation with constant speed (during forward movements in which bending waves continuously propagate from head to tail, wild-type worms exhibited an undulation frequency of ∼1.6 Hz).
FIG. 1.

Detection of Ω-turns using video microscopy. A: a series of video images of a swimming young adult worm in a microdroplet shown at 1-s intervals. During forward swimming (1st, 2nd, 4th, and 5th frames) the body of the worm is extended as sinusoidal undulations propagate from head to tail. During an Ω-turn (3rd frame), the body contracts. B: analysis of body extension over time shows the occurrence of flagged Ω-turns (dots below trace) that reduce the overall body extension to less than ∼60%.
FIG. 2.

Ω-turns of individual swimming worms over time. A: cumulative plot of Ω-turns exhibited by 3 wild-type individuals over 30 min. B: cumulative plot of Ω-turns of 69 wild-type worms (gray lines). The black line shows the mean of the 69 cumulative plots. C: the same data as shown in B, but shown as Ω-turn rate for the 69 worms (gray lines) and mean turning rate ± SE (black line). Turning rates were calculated using 150-s bins.
All of the Ω-turns exhibited by each worm were superficially similar over time. That is, only the intervals between Ω-turns varied over the 30-min course of each experiment and not the dynamics of each Ω-turn (data not shown). We did not analyze the statistics of turning behavior for >30 min because worms sometimes began to exhibit quiescence, a distinct behavioral state in which worms stop moving entirely for several seconds before they resume normal swimming behavior (Ghosh and Emmons 2008). Any worms that exhibited quiescence before 30 min (defined as a complete cessation of body undulation) were excluded from analysis.
Statistics of intervals between successive Ω-turns
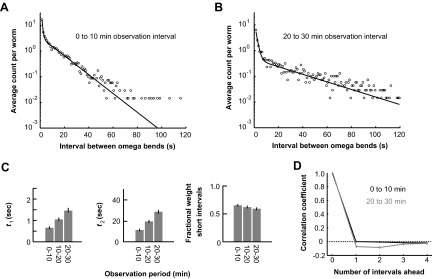
We collected all the intervals between successive Ω-turns exhibited by worms in the first 10 min of observation after being placed in the microdroplets and found that the interval distribution is consistent with a theoretical distribution comprised of the sum of two exponential functions (i.e., we could not rule out the null hypothesis that the empirically measured intervals were produced by the theoretical distribution at P = 0.05 by the χ2 test; Fig. 3A). The empirical interval distribution may thus be described using three parameters: two time constants that characterize each exponential function and the fractional weight of each exponential function in the overall distribution. The exponential component with the short time constant describes the sharp steps in the cumulative plot of Ω-turns (i.e., the time intervals between Ω-turns in rapid succession). The exponential component with the long time constant describes the plateaus.
FIG. 3.
 |
The mean rate of Ω-turns lessens over time, so we compared the statistics of Ω-turns in different observation periods following the worm's placement in the microdroplets. For both the 0- to 10-min observation period and the 20- to 30-min observation period, the interval distribution between successive Ω-turns is consistent with the sum of two exponentials (Fig. 3, A and B). Comparing the parameters for the distribution of intervals in different observation periods shows that the reduced rate of Ω-turns over 30 min is caused by increase in the time constants of the exponential components of the interval distribution (Fig. 3C). The fractional weight of the two exponential components in the overall distribution does not change (staying ∼70% for the fast exponential and ∼30% for the slow exponential throughout the experiment as shown in Fig. 3C).
We also examined the possibility of correlations between Ω-turns. We took all intervals between successive Ω-turns exhibited by each worm, paired each interval with the nth interval that followed, and computed the correlation coefficient between all pairs as a function of n. We computed correlation coefficients for all intervals exhibited in the 0- to 10-min period of observation and in the 20- to 30-min period of observation. During the first 10 min of observation, we found zero correlation between consecutive intervals (i.e., when n = 1), which suggests that each interval between successive Ω-turns represents an independent random variable (Fig. 3D). During the 20- to 30-min observation period, consecutive intervals exhibit a small negative correlation, indicating that long intervals and short intervals tended to alternate but the correlation accounts for <1% of the variance.
Mutations that affect neurotransmitter pathways and their effects on stochastic turning behavior
The statistics of crawling locomotion in C. elegans (e.g., the durations of periods of forward movement; the rate of exhibiting reversals; the rate of exhibiting Ω-turns; speed regulation) have been shown to depend on various neurotransmitter pathways including glutamate, GABA, dopamine, and serotonin (Hills et al. 2004; Sawin et al. 2000; Shingai 2000). Therefore we asked whether such mutations might also affect the statistics of Ω-turns exhibited by swimming worms.
To study the contribution of glutamatergic neurotransmission, we examined mutations that disrupt the GLR-1 and GLR-2 glutamate receptor subunits, which are expressed in the command interneurons AVA, AVB, AVD, AVE, and PVC; mutations that disrupt the GLR-3 and GLR-6 glutamate receptor subunits, which are expressed in the RIA interneuron that is postsynaptic to AIY (Brockie et al. 2001); and the mutation that disrupts the EAT-4 glutamate vesicular transporter, which is expressed in glutamatergic neurons (Lee et al. 1999).
To study the contribution of GABAergic neurotransmission, we examined mutations in UNC-25, which is required for GABA synthesis, and UNC-47, a vesicular GABA transporter (Jin et al. 1999; McIntire et al. 1997). We also examined mutations that affect TPH-1 and CAT-4, which contribute to the biosynthesis of serotonin, and a mutation that disrupts CAT-2, the tyrosine hydroxylase that is used for dopamine synthesis (Sawin et al. 2000; Sze et al. 2000).
Because worms undergo a large change in their chemical environment when moved from agar plates with bacterial food to microdroplets without food, we also examined an osm-6 mutant, which has abnormal ciliated sensory neurons and is incapable of chemosensation (Collet et al. 1998). We also examined mutations that affect TTX-3, a LIM-homeobox gene that contributes to the development of the AIY interneuron, which is downstream of the AWC olfactory neuron that responds to the removal of food (Chalasani et al. 2007; Hobert et al. 1997).
As with wild-type worms, we found that the intervals between successive Ω-turns of all mutants could be fit to the sum of two exponentials. Also, all mutants exhibited Ω-turns at a gradually declining rate over the course of 30 min (Fig. 4A). We compared the three parameters in the distribution of intervals between successive Ω-turns across mutants and over the 30 min of each experiment. In each case, the gradual reduction in Ω-turn rate corresponded to decrease in the time constants in the exponential functions that comprised each interval distribution (as opposed to modulation in the fractional weight of the two exponentials in the overall distribution; Fig. 4B).
FIG. 4.
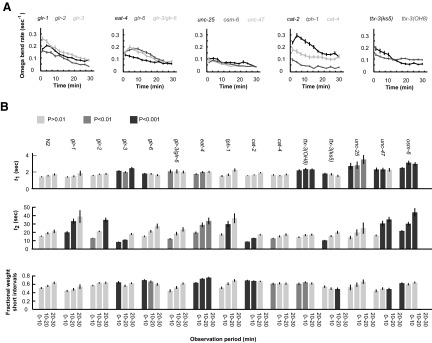
Statistics of turning behavior of mutant worms. A: the rate of Ω-turns over time exhibited by different mutant strain. Mean Ω-turn rates are calculated using 150-s bins over the course of 30 min. Error bars are ± 2 SE. Sample sizes are as follows: glr-1, n = 36; glr-2, n = 35; glr-3, n = 26; glr-6, n = 30; glr-3/glr-6, n = 32; eat-4, n = 45; tph-1, n = 34; cat-2, n = 48; cat-4, n = 31; ttx-3(OH8), n = 49; ttx-3(ks5), n = 24; unc-25, n = 44; unc-47, n = 44; osm-6, n = 48. B: the 3 parameters, τ1, τ2, and B, that describe the distribution of interval durations between successive Ω-turns, calculated for the 0- to 10-, 10- to 20-, and 20- to 30-min observation period for wild-type and each mutant. Errors bars are ± 2 SE. Cases in which a particular parameters measured for a mutant within an observation period differed from that measured for wild-type in the same observation period at P < 0.01 are indicated by dark gray bars, and those that differed at P < 0.001 are indicated by darker gray bars.
For some mutants, we found statistically significant differences (relative to wild-type worms) for one or more of the three parameters that describe the interval distribution between successive Ω-turns. Of the mutations that affected glutamatergic neurotransmission, mutations in glr-1, glr-2, and eat-4 increased the time constant of the long exponential component in the overall distribution; the mutation in glr-3 decreased the time constant of the long exponential but increased the time constant of the short exponential. Mutation in tph-1, which decreases serotonergic neurotransmission, increased the long time constant. Mutation in cat-2, which disrupts dopaminergic neurotransmission, decreased the long time constant.
A general trend across mutant and wild-type worms is that the overall change in turning rate is closely correlated with the initial turning rate. Strains that exhibited an initially high Ω-turn rate exhibited a large overall change in rate. Strains that exhibited an initially low Ω-turn rate exhibit a smaller overall change in rate (Fig. 5).
FIG. 5.

The change in Ω-turn rate is correlated with initial rate. Taking all the data from wild-type and mutant strains shown in Figs. 2–4, the overall change in Ω-turn rate (difference between the mean rate in the 0- to 10-min observation period and the 20- to 30-min observation period) is correlated strongly with initial Ω-turn rate (mean rate in the 0- to 10-min observation period). Each data point represents data from 1 strain. Error bars are 2 SE. The line shows fit to linear regression (R2 = 0.91).
Two-state model explains the random intervals between successive Ω-turns
An explanation for exponential distributions in the random intervals between successive Ω-turns is that Ω-turns are generated by mechanisms that exhibit Poisson kinetics. Two exponentials in the overall distribution might mean that at least two separate mechanisms can generate Ω-turns, each mechanism governed by Poisson kinetics but with different time constants. We explored a Markov model in which the swimming worm can be in one of two behavioral states. One behavioral state generates Ω-turns with rapid kinetics (a fast state with a high probability per unit time of executing an Ω-turn) and the other behavioral state generates Ω-turns with slow kinetics (a slow state with a low probability per unit time of executing an Ω-turn). In the Markov model, the worm transitions between the two states with Poisson kinetics (Fig. 6A). Simulations confirm that, with selection of rate constants that fit the empirical measurements, the phenomenological model can reproduce the statistics of Ω-turns exhibited by real worms: sharp vertical steps and plateaus in the cumulative plot of Ω-turns (Fig. 6B); the sum of two exponentials in the distribution of intervals between successive Ω-turns (Fig. 6C); and no correlation between intervals (Fig. 6D).
FIG. 6.
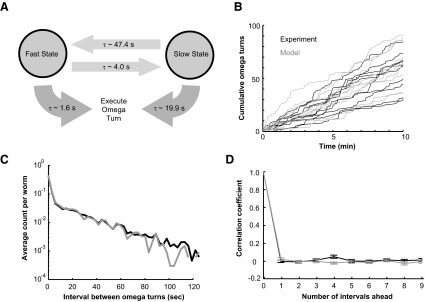
A phenomenological model for the mechanism that generates Ω-turns. A: in the absence of sensory input, the worm can either be in a fast state that generates Ω-turns with Poisson kinetics and a short time constant or in a slow state in which turns are generated with Poisson kinetics and a long time constant. The worm randomly transitions between the 2 states with Poisson kinetics. The time constants were derived by fitting the wild-type distribution of intervals between successive Ω-turns to this phenomenological model. B: cumulative Ω-turns for wild-type worms (black) and cumulative Ω-turns produced by model simulation with parameters shown in A (gray). C: the distribution of intervals between successive Ω-turns for wild-type worms (black) and the distribution produced by model simulation (gray). D: autocorrelation function of the sequence of intervals between successive Ω-turns exhibited by wild-type worms (black line) and the distribution produced by model simulation (gray line), examining whether the duration of any interval was correlated with the duration of the nth interval that followed. Errors bars are ±SE.
DISCUSSION
Worms navigate their environment using periods of forward movement that are interrupted at random by reorientation movements, producing trajectories that resemble random walks. Neural circuits for navigation have been extensively explored in C. elegans by analyzing the statistics of forward movements and reorientation movements exhibited by crawling animals (Gray et al. 2005; Tsalik and Hobert 2002; Wakabayashi et al. 2004). However, the behavior of swimming animals has received less attention, despite the fact that, using microdroplets, it is relatively straightforward to obtain detailed statistics of the locomotion of individual animals over time.
Recent studies have begun to analyze swimming as a means of locomotion and purposeful navigation in C. elegans. Clark et al. (2007) and Luo et al. (2008) showed that swimming worms respond to thermosensory and olfactory cues in much the same way as crawling worms. Crawling worms exposed to improving or declining conditions (i.e., toward preferred temperatures or odorants) will lengthen or shorten periods of forward movements, respectively, thus biasing random walks toward better environments (Chalasani et al. 2007; Pierce-Shimomura et al. 1999; Ryu and Samuel 2002; Tsalik and Hobert 2002). For swimming worms, Ω-turns terminate periods of forward movements, and Clark et al. (2007) and Luo et al. (2008) found that swimming worms exposed to improving or declining conditions lower or raise the rate of Ω-turns, respectively, in a manner consistent with the biased random walks displayed by crawling worms. In a new swimming assay for salt chemotaxis, Pierce-Shimomura et al. (2008) recently showed that swimming worms are able to aggregate near preferred salt concentrations over time, confirming that swimming worms are capable of directed navigation.
This study continues the development of the swimming worm for the study of navigation and locomotion by quantifying their spontaneous turning behavior. When worms are removed from cultivation and placed in microdroplets, they spontaneously exhibit Ω-turns in time series with strong statistical features: 1) the distribution of intervals between successive Ω-turns resembles the sum of two exponentials, one with a short time constant and one with a long time constant; 2) the rate of Ω-turns gradually lessens over time, because of increase in the time constants of the interval distribution between Ω-turns.
Both statistical features of the interval between Ω-turns exhibited by swimming worms are analogous to recent observations made using crawling worms. Pierce-Shimomura (1999) and Shingai (2000) found that the distribution of durations of forward movements exhibited by crawling worms also resembles the sum of two exponentials. Moreover, when worms are removed from cultivation with bacterial food and placed on bare agar plates, they exhibit an initial period of 5–10 min of high turning rate and short periods of forward movement. This episode is called area-restricted search, as, because of their reorientation rate, worms extensively search their immediate surroundings without wandering away (Hills et al. 2004).
By analyzing the statistics of forward movements exhibited by crawling worms, Shingai (2000) found that mutation in unc-25, a gene required for biosynthesis of the neurotransmitter GABA, eliminates the long exponential in the distribution of run durations. Shingai (2000) also found that the fractional weight of the exponential with the shorter time constant could be augmented by disrupting unc-47, which encodes a vesicular GABA transporter. We found that mutations in unc-25 and unc-47 also affected the intervals between Ω-turns exhibited by swimming worms, but in different ways. In swimming worms, mutation in unc-25 increased the short time constant in the interval distribution, and mutation in unc-47 increased both the short and long time constants.
In a genetic analysis of area-restricted search behavior, Hills et al. (2004) showed that the reduction in turning rate over time of crawling C. elegans requires specific dopaminergic and glutamatergic circuits because it can be abolished or reduced by mutations that affect dopaminergic neurotransmission-specific glutamate receptors (e.g., cat-2 that encodes a tyrosine hydroxylase for dopamine synthesis or glr-1 and glr-2 that encode glutamate receptor subunits). In this analysis of swimming worms, none of the mutations that we studied eliminated the gradual reduction in the rate of Ω-turns exhibited by swimming worms over time. We found that mutation in cat-2 decreases the long time constant in the distribution of intervals between Ω-turns and that mutations in glr-1 or glr-2 increase the long time constants.
Genetic differences in the statistics of turning behavior between swimming worms and crawling worms points to differences in the neural circuits for navigation between swimming and crawling. By systematically analyzing the effects of neuronal and genetic ablations on the statistics of forward movements and reorientation movements of crawling worms, several recent studies have begun to map the neural circuits for crawling navigation (Gray et al. 2005; Hobert 2003; Wakabayashi et al. 2004). For example, Gray et al. (2005) found that mutation in osm-6 reduced the rate of Ω-turns exhibited by crawling worms, suggesting that the lowering the activity of all ciliated sensory neurons lowers the activity of the downstream pathways that generate reorientation movements. We also found that mutation in osm-6 reduced the rate of Ω-turns, and it will be worthwhile to perform the same type of systematic analysis of mutations that affect sensory neurons to interneurons to motor neurons to map the navigational circuits used during swimming.
The turning movements of swimming worms exhibit relatively simple stochastic patterns that can be reproduced using a simple phenomenological model. We explored one minimal phenomenological model (see Fig. 6), where the worm can be in one of two states when it generates turning events. Of course, more complex models can be imagined that are consistent with our experimental observations. For example, more than two states might be used to effect each turning movement, as long as the kinetics of additional states are close enough to those of the fast and slow states of the two-state model such that they cannot be resolved.
A similar study of stochasticity in behavioral output and its neural basis in C. elegans has been carried out in egg-laying behavior. The egg-laying circuit is comprised of a small number of motor neurons (HSN and the VC motor neurons) and a small number of vulval muscle cells. The worm's reproductive system continuously manufactures and fertilizes eggs, but the worm lays each egg in an instantaneous manner, and the intervals between egg-laying events are aperiodic. Zhou et al. (1998) found that the intervals between egg-laying events are well-fit by a sum of two exponentials, a stochastic point process that may be explained by a multistate model involving nonpermissive states for egg-laying, permissive states and random transitions between the states. By quantifying the behavior of animals lacking serotonin or the serotonergic HSN neurons, Waggoner et al. (1998) showed that the serotonergic pathway in this circuit specifically facilitates the transition from nonpermissive state to permissive state.
In principle, spontaneous activation of any neuron at any time might trigger a cascade of activity through the worm nervous system that culminates in an Ω-turn. Nevertheless, our results suggest that the generation of Ω-turns in swimming worms may be described using a straightforward and minimal phenomenological model. The fact that an analogous model can describe the statistics of egg-laying behavior (Zhou et al. 1998) may point to general principles in the stochastic operation of the C. elegans nervous system.
GRANTS
This work was funded by grants from the Sloan Foundation, McKnight Foundation, National Science Foundation, and National Institutes of Health.
Acknowledgments
We thank A. V. Maricq and H. R. Horvitz for the gifts of mutant strains and D. Omura for helpful conversations.
REFERENCES
- Baek et al. 2002.Baek JH, Cosman P, Feng Z, Silver J, Schafer WR. Using machine vision to analyze and classify Caenorhabditis elegans behavioral phenotypes quantitatively. J Neurosci Methods 118: 9–21, 2002. [DOI] [PubMed] [Google Scholar]
- Brockie et al. 2001.Brockie PJ, Madsen DM, Zheng Y, Mellem J, Maricq AV. Differential expression of glutamate receptor subunits in the nervous system of Caenorhabditis elegans and their regulation by the homeodomain protein UNC-42. J Neurosci 21: 1510–1522, 2001. [DOI] [PMC free article] [PubMed] [Google Scholar]
- Chalasani et al. 2007.Chalasani SH, Chronis N, Tsunozaki M, Gray JM, Ramot D, Goodman MB, Bargmann CI. Dissecting a circuit for olfactory behaviour in Caenorhabditis elegans. Nature 450: 63–70, 2007. [DOI] [PubMed] [Google Scholar]
- Chung et al. 2006.Chung SH, Clark DA, Gabel CV, Mazur E, Samuel AD. The role of the AFD neuron in C. elegans thermotaxis analyzed using femtosecond laser ablation. BMC Neuroscience 7: 30, 2006. [DOI] [PMC free article] [PubMed] [Google Scholar]
- Clark et al. 2007.Clark DA, Gabel CV, Lee TM, Samuel AD. Short-term adaptation and temporal processing in the cryophilic response of Caenorhabditis elegans. J Neurophysiol 97: 1903–1910, 2007. [DOI] [PubMed] [Google Scholar]
- Collet et al. 1998.Collet J, Spike CA, Lundquist EA, Shaw JE, Herman RK. Analysis of osm-6, a gene that affects sensory cilium structure and sensory neuron function in Caenorhabditis elegans. Genetics 148: 187–200, 1998. [DOI] [PMC free article] [PubMed] [Google Scholar]
- Davison and Hinkley 2006.Davison AC, Hinkley D. Bootstrap Methods and Their Applications. Cambridge, MA: Cambridge Series in Statistical and Probabilistic Mathematics, 2006.
- Geng et al. 2003.Geng W, Cosman P, Baek JH, Berry CC, Schafer WR. Quantitative classification and natural clustering of C. elegans behavioral phenotypes. Genetics 165: 1117–1126, 2003. [DOI] [PMC free article] [PubMed] [Google Scholar]
- Geng et al. 2004.Geng W, Cosman P, Berry CC, Feng Z, Schafer WR. Automatic tracking, feature extraction and classification of C. elegans phenotypes. IEEE Trans Biomed Eng 51: 10, 2004. [DOI] [PubMed] [Google Scholar]
- Ghosh and Emmons 2008.Ghosh R, Emmons SW. Episodic swimming behavior in the nematode C. elegans. J Exp Biol 211: 3703–3711, 2008. [DOI] [PubMed] [Google Scholar]
- Gray et al. 2005.Gray JM, Hill JJ, Bargmann CI. A circuit for navigation in Caenorhabditis elegans. Proc Natl Acad Sci USA 102: 3184–3191, 2005. [DOI] [PMC free article] [PubMed] [Google Scholar]
- Hills et al. 2004.Hills T, Brockie PJ, Maricq AV. Dopamine and glutamate control area-restricted search behavior in Caenorhabditis elegans. J Neurosci 24: 1217–1225, 2004. [DOI] [PMC free article] [PubMed] [Google Scholar]
- Hobert 2003.Hobert O Behavioral plasticity in C. elegans: paradigms, circuits, genes. J Neurobiol 54: 203–223, 2003. [DOI] [PubMed] [Google Scholar]
- Hobert et al. 1997.Hobert O, Mori I, Yamashita Y, Honda H, Ohshima Y, Liu Y, Ruvkun G. Regulation of interneuron function in the C. elegans thermoregulatory pathway by the ttx-3 LIM homeobox gene. Neuron 19: 345–357, 1997. [DOI] [PubMed] [Google Scholar]
- Jin et al. 1999.Jin Y, Jorgensen E, Hartwieg E, Horvitz HR. The Caenorhabditis elegans gene unc-25 encodes glutamic acid decarboxylase and is required for synaptic transmission but not synaptic development. J Neurosci 19: 539–548, 1999. [DOI] [PMC free article] [PubMed] [Google Scholar]
- Lee et al. 1999.Lee RY, Sawin ER, Chalfie M, Horvitz HR, Avery L. EAT-4, a homolog of a mammalian sodium-dependent inorganic phosphate cotransporter, is necessary for glutamatergic neurotransmission in caenorhabditis elegans. J Neurosci 19: 159–167, 1999. [DOI] [PMC free article] [PubMed] [Google Scholar]
- Luo et al. 2008.Luo L, Gabel CV, Ha HI, Zhang Y, Samuel AD. Olfactory behavior of swimming C. elegans analyzed by measuring motile responses to temporal variations of odorants. J Neurophysiol 99: 2617–2625, 2008. [DOI] [PubMed] [Google Scholar]
- McIntire et al. 1997.McIntire SL, Reimer RJ, Schuske K, Edwards RH, Jorgensen EM. Identification and characterization of the vesicular GABA transporter. Nature 389: 870–876, 1997. [DOI] [PubMed] [Google Scholar]
- Mellem et al. 2002.Mellem JE, Brockie PJ, Zheng Y, Madsen DM, Maricq AV. Decoding of polymodal sensory stimuli by postsynaptic glutamate receptors in C. elegans. Neuron 36: 933–944, 2002. [DOI] [PubMed] [Google Scholar]
- Pierce-Shimomura et al. 2008.Pierce-Shimomura JT, Chen BL, Mun JJ, Ho R, Sarkis R, McIntire SL. Genetic analysis of crawling and swimming locomotory patterns in C. elegans. Proc Natl Acad Sci USA 105: 20982–20987, 2008. [DOI] [PMC free article] [PubMed] [Google Scholar]
- Pierce-Shimomura et al. 1999.Pierce-Shimomura JT, Morse TM, Lockery SR. The fundamental role of pirouettes in Caenorhabditis elegans chemotaxis. J Neurosci 19: 9557–9569, 1999. [DOI] [PMC free article] [PubMed] [Google Scholar]
- Ryu and Samuel 2002.Ryu WS, Samuel AD. Thermotaxis in Caenorhabditis elegans analyzed by measuring responses to defined thermal stimuli. J Neurosci 22: 5727–5733, 2002. [DOI] [PMC free article] [PubMed] [Google Scholar]
- Sawin et al. 2000.Sawin ER, Ranganathan R, Horvitz HR. C. elegans locomotory rate is modulated by the environment through a dopaminergic pathway and by experience through a serotonergic pathway. Neuron 26: 619–631, 2000. [DOI] [PubMed] [Google Scholar]
- Shingai 2000.Shingai R Durations and frequencies of free locomotion in wild type and GABAergic mutants of Caenorhabditis elegans. Neurosci Res 38: 71–83, 2000. [DOI] [PubMed] [Google Scholar]
- Sulston and Hodgkin 1988.Sulston JE, Hodgkin J. Methods. In: The Nematode Caenorhabditis elegans, edited by Wood WB. Cold Spring Harbor, NY: Cold Spring Harbor Press, 1988, p. 587–606.
- Sze et al. 2000.Sze JY, Victor M, Loer C, Shi Y, Ruvkun G. Food and metabolic signaling defects in a Caenorhabditis elegans serotonin-synthesis mutant. Nature 403: 560–564, 2000. [DOI] [PubMed] [Google Scholar]
- Tsalik and Hobert 2002.Tsalik EL, Hobert O. Functional mapping of neurons that control locomotory behavior in Caenorhabditis elegans. J Neurobiol 56: 178–197, 2002. [DOI] [PubMed] [Google Scholar]
- Tsechpenakis et al. 2008.Tsechpenakis G, Bianchi L, Metaxas D, Driscoll M. A novel computational approach for simultaneous tracking and feature extraction of C. elegans populations in fluid environments. IEEE Trans Biomed Eng 55: 1539–1549, 2008. [DOI] [PubMed] [Google Scholar]
- Waggoner et al. 1998.Waggoner LE, Zhou GT, Schafer RW, Schafer WR. Control of alternative behavioral states by serotonin in Caenorhabditis elegans. Neuron 21: 203–214, 1998. [DOI] [PubMed] [Google Scholar]
- Wakabayashi et al. 2004.Wakabayashi T, Kitagawa I, Shingai R. Neurons regulating the duration of forward locomotion in Caenorhabditis elegans. Neurosci Res 50: 103–111, 2004. [DOI] [PubMed] [Google Scholar]
- Zhou et al. 1998.Zhou GT, Schafer RW, Schafer WR. A three-state biological point process model and its parameter estimation. IEEE Trans Signal Processing 46: 2698–2707, 1998. [Google Scholar]