Abstract
We investigated the synaptic interactions between neighboring motor cortex cells in monkeys generating isometric ramp-and-hold torques about the wrist. For pairs of cortical cells the response patterns were determined in response-aligned averages and their synaptic interactions were identified by cross-correlation histograms. Cross-correlograms were compiled for 215 cell pairs and 84 (39%) showed significant features. The most frequently found feature (65/84 = 77%) was a central peak, straddling the origin and representing a source of common synaptic input to both cells. One third of these also had superimposed lagged peaks, indicative of a serial excitatory connection. Pure lagged peaks and lagged troughs, indicative of serial excitatory or inhibitory linkages, respectively, both occurred in 5% of the correlograms with features. A central trough appeared in 13% of the correlograms. The magnitude of the synaptic linkage was measured as the normalized area of the correlogram feature. Plotting the strength of synaptic interaction against response similarity during alternating wrist torques revealed a positive relationship for the correlated cell pairs. A linear fit yielded a positive slope: the pairs with excitatory interactions tended to covary more often than countervary. This linear fit had a positive offset, reflecting a tendency for both covarying and countervarying cells to have excitatory common input. Plotting the cortical location of the cell pairs showed that the strongest interactions occurred between cells separated by <400 microns. The correlational linkages between cells of different cortical layers showed a large proportion of common input to cells in layer V.
INTRODUCTION
The operations of cortical circuits are mediated by the synaptic interactions between cortical neurons, which depend on the strength and distribution of the functional connections between cells. Our understanding of intrinsic cortical circuitry has been significantly advanced by in vitro studies of synaptic interactions between morphologically characterized cells (Douglas and Martin 2004; Markram 1997; Markram et al. 1997; Thomson and Lamy 2007; Thomson et al. 2002). Yet, surprisingly little is known about normal interactions between functionally identified cortical neurons in vivo. Such interactions are sometimes inferred indirectly from response properties (Merchant et al. 2008). Synaptic interactions can be documented directly by cross-correlating the extracellular spike activity of the cells (Moore et al. 1970; Perkel et al. 1967) and by spike-triggered averaging of intracellularly recorded membrane potentials (Matsumura et al. 1996). Since intracellular recordings of synaptic potentials are difficult to obtain in behaving animals, cross-correlation is the more practical measure in the behavioral context required to define the cells' normal functional properties. By measuring the synaptic interactions between cells as well as their task-related activity we can determine the extent to which the connections are functionally consistent with their response properties and to infer the mode of operations of cortical circuits. As reviewed elsewhere (Fetz et al. 1991) this strategy has been successfully applied in various cortical regions, including motor cortex.
Previous studies of precentral cells using correlation analysis have revealed evidence of positive synchronization between cells with similar response characteristics and negative correlation between cells that respond reciprocally (Allum et al. 1982; Georgopoulos et al. 1993; Jackson et al. 2003; Murphy et al. 1985), supporting the hypothesis that synaptic connections between precentral neurons shape the neurons' discharge. Anatomical connections producing synchrony, such as recurrent synapses of pyramidal cells and radial afferent fibers, have also been suggested or identified (Ghosh and Porter 1988a,b; Kang et al. 1988; Stefanis and Jasper 1964), although the cell population they innervate has not been characterized.
This study documents the synaptic relationship between functionally identified precentral cell pairs and their response patterns during voluntary isometric wrist torques. In contrast to previous work, this study determined whether the interacting cells had axonal projections to spinal cord or correlational linkages with muscles. The study also provides the histological reconstruction of recording sites, elucidating the anatomical basis of synaptic interactions between cortical layers. The companion paper examines synaptic relations between identified corticomotoneuronal (CM) cells, which have correlational linkages with identified target muscles.
METHODS
Experiments were performed with two Macaca mulatta monkeys. The animals were housed, fed, and medically supervised at the Washington National Primate Research Center in conformity with U.S. Department of Health and Human Services guidelines for the care and use of laboratory animals. Monkeys were trained to perform isometric ramp-and-hold wrist torques in a task that has been used to characterize cells in cerebral cortex, red nucleus, and spinal cord (Cheney et al. 1991; Fetz et al. 2002). A 22-mm-diameter recording chamber was placed over the contralateral arm/hand precentral cortex and a chronically indwelling, concentric stimulating electrode placed in the ipsilateral medullary pyramid for antidromic activation of pyramidal tract (PT) neurons.
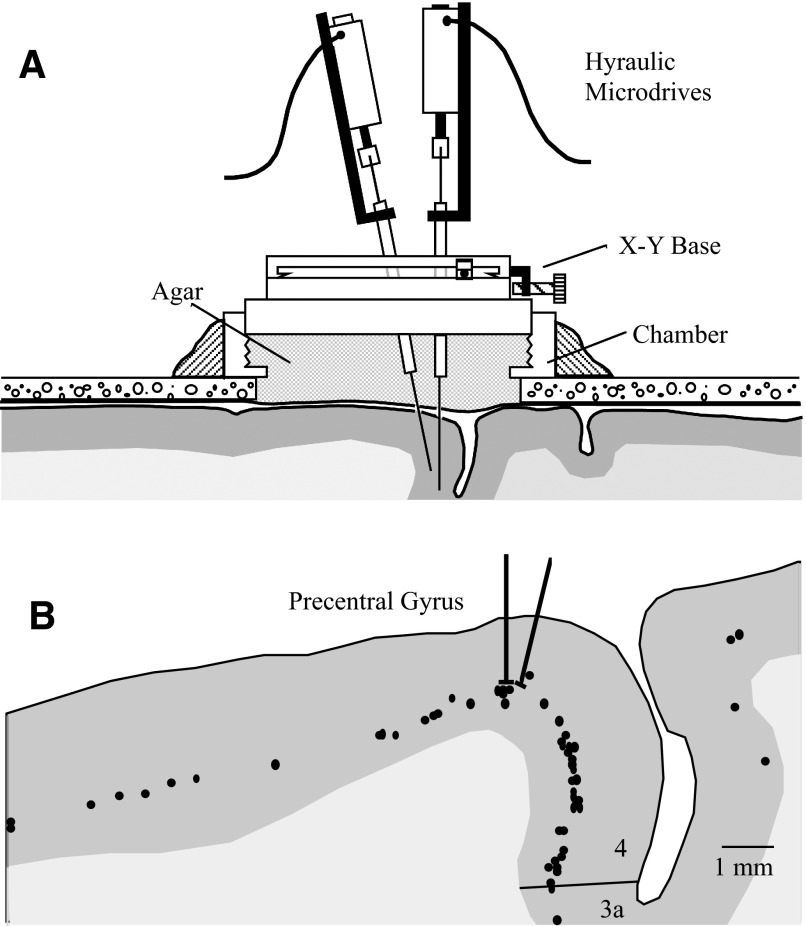
To facilitate the recording of cells within close proximity, we used a dual-electrode drive holder (Fig. 1). One electrode was advanced perpendicular to the chamber, whereas the other could be positioned at a 0–45° angle to the vertical electrode. The plane defined by the two electrodes could be translated mediolaterally and anteroposteriorly and the separation between both electrodes could be adjusted. The plane of the electrodes was maintained at a 30° angle to the anatomic sagittal plane, approximately perpendicular to the central sulcus. (This plane was chosen to maximize the possibility of observing serial inhibition produced by basket cells that send axons perpendicular to the long axis of the precentral gyrus.) Each glass-coated tungsten electrode was attached to a manually controlled hydraulic microdrive (Narashigi model 95A) and could be moved with 1-μm precision. After the electrodes penetrated the dura the chamber was filled with 10% sterile agar, which solidified and prevented displacement of the cortex by changes in intracranial pressure.
FIG. 1.
A: schematic of the dual-electrode drive. Independent cell recordings were made from glass-coated tungsten electrodes mounted on 2 independent microdrives. One electrode was constrained to the vertical plane and the oblique electrode could be positioned to record cells in close proximity. The chamber was flooded with agar during recording to dampen relative cortical movement. B: example of reconstruction of electrode tracks and cortical histology. Electrode tracks 103 and 104 are shown superimposed over the digitized histologic section. Dots indicate corticofugal neurons labeled with horseradish peroxidase (HRP) and shaded region represents gray matter.
Each electrode signal was amplified by a band-pass amplifier (300 Hz to 5 kHz) and monitored by stereo headphones, with one channel for each signal. Once isolated, all cells were tested for an antidromic response to PT stimulation. The cell was classified as a PT neuron if it could be activated antidromically by a single stimulus through the medullary electrode and if this response could be collided with spontaneous, orthodromic spikes. Cells that did not meet both of these criteria were classified as non-PT (NPT) cells. As described in the companion paper (Smith and Fetz 2009), cells were identified as “CM cells” if spike-triggered averages (STAs) of rectified electromyographic (EMG) activity indicated a postspike facilitation of EMG.
At the end of each recording session, the electrodes were withdrawn to their initial extracranial position and the adaptor was removed from the monkey. The relative locations of the recording sites were reconstructed by repositioning the electrodes to the depths at which specific cells had been recorded in vivo and measuring the tip locations in reference to a 100-μm-resolution grid. Reconstruction accuracy was based on histological reconstruction of tracks in which electrolytic lesions were placed and further based on the measured electrode tip separation in cases when both electrodes recorded from the same cortical unit (10 instances). The accuracy of the electrode coordinates was estimated to be 135 ± 170 μm.
Signals from both electrodes, wrist torque, and EMG activity of forearm muscles were recorded on a frequency-modulated tape recorder for off-line analysis. Action potentials of cortical units were used to generate digital pulses using time–amplitude window discriminators (Model DIS-1; Bak Electronics); waveform separation was sometimes enhanced with an audio equalizer (Model 31–2009; Radio Shack). These discriminated spike trains were digitized with 250-μs resolution along with the analog wrist torque signal at 20-ms resolution. A unit was excluded from further analysis if the autocorrelogram of its spike train revealed counts within the refractory period (typically within 3 ms of the origin), indicating contamination from other cortical cells.
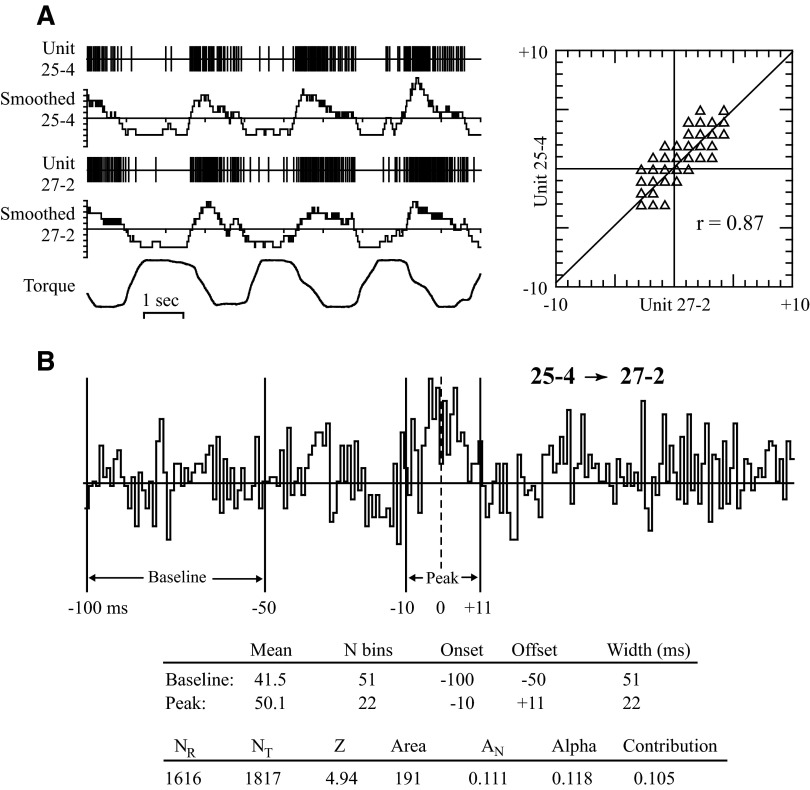
“Response average” histograms of unit activity aligned with the ramp portion of wrist torque were generated for all cells. To quantify the degree to which the firing rates of two units covaried during the task, we calculated a measure called “response similarity,” as illustrated in Fig. 2A. Each unit's spike train was converted to a continuous waveform by summing all spikes that occurred within a moving 200-ms window, advanced every 20 ms. This sum was placed into a bin at the center of the 200-ms window. To remove offset, the mean of the entire trace was subtracted from each bin. A scatterplot of the two smoothed firing rates in corresponding bins was generated (top right). Response similarity was defined as the regression coefficient “r” for these points. In this example the points fell along a line with a positive slope, producing a positive r value (0.87). Units whose firing varied reciprocally had a negative linear regression and a negative r value. Scatterplots of units with uncorrelated firing generated a circular pattern and produced a “response similarity” near zero.
FIG. 2.
A: calculation of response similarity (r), measuring the strength of covariation in firing rates of 2 precentral cells during active wrist torque generation. The digitized spike trains of 2 neurons (units 25-4 and 27-2) and wrist torque are shown for 10 s of data. The units' firing rate is smoothed by summing the number of spikes within a moving 200-ms window as shown in the “smoothed” traces. Response similarity is calculated as the correlation coefficient between the 2 smoothed signals, shown in the scatterplot on the right (r = 0.87). Torque signal: flexion upward, extension downward. B: determination of onset, offset, and size of correlogram feature. Baseline was defined as the first 50 bins of the correlogram, onset, and offset as the middle bin of a 3-bin average that exceeded this baseline (for peaks) or fell below (for troughs). Area is the sum of counts above or below baseline between onset and offset; AN is the feature area divided by (NR + NT)/2, where NR is the number of reference cell triggers and NT is the number of target cell triggers. Features with |Z| >2.8 were accepted as significant (Cope et al. 1987). Numerical measures for this example are tabulated. α = AN/NT; contribution = AN/NR.
Correlograms between spike trains of cell pairs were constructed by the method of Perkel et al. (1967). Correlograms of 1-ms and 250-μs bin resolution were constructed from all recorded spikes from cell pairs during performance of alternating wrist torques. Periods of inactivity, sleep, and restlessness were excluded from analysis.
The resulting correlograms were inspected by eye to identify sustained deviations from baseline. Baseline was defined as the first 50 bins of the 200-bin correlogram (Fig. 2B). Onset and offset of a feature were defined as the central bin of a three-bin average that exceeded the baseline mean (in the case of peaks) or that fell below this mean (in the case of troughs). All bins in the feature satisfied the three-bin average criterion. Single bins with deviant counts, which usually represented cross talk between electrodes, were excluded if the counts failed to distribute across adjacent bins when the bin resolution was quadrupled to 250 μs. The time between the onset and offset bins defined the feature duration. Area of the feature was defined as the total number of counts above baseline in bins between onset and offset, inclusively. The absolute area was tested for statistical significance using the Z statistic (Cope et al. 1987). Correlograms with |Z| ≥2.8 (P < 0.005) were accepted as significant.
For all correlograms the feature area was divided by the algebraic mean of the number of target and reference cell spikes that occurred during construction of the cross-correlogram. This measure is referred to as normalized area or AN. Thus AN is the feature area divided by (NR + NT)/2, where NR is the number of reference cell triggers and NT is the number of target cell triggers. AN represents the probability that any one spike, from either cell, is correlated above chance with the other cell. We also calculated the parameters α = AN/NT and contribution = AN/NR.
The relative locations of recorded units within cortical laminae and their separation distance were determined from histological reconstructions for every cell pair. The cortex of the first animal was reconstructed from cresyl-stained 60-μm sections. In the second animal the corticospinal neurons were retrogradely labeled. Two days before sacrifice, 2 mg of wheat-germ agglutinin conjugated horseradish peroxidase (WGA-HRP) was injected into the lateral lamniscus, intermediate horn, and lateral-ventral horn of the contralateral spinal segments C4–T1. Brain sections were processed using an ammonium heptahydrate molybdate tetramethyl benzidine procedure to stain retrogradely transported HRP (Olucha et al. 1985). Features of each cortical section were digitized using a microscope-optical imaging program, which included the cortical surface, location of layer V, gray–white junction, and the locations of HRP-stained neurons (shown as dots in Fig. 1). These digitized sections were then translated into coordinates of the chronic recording chamber, allowing the superposition of recording positions over the appropriate histologic area.
Since thalamocortical and corticocortical afferents arborize radially, irrespective of gyrus morphology, a useful measure of cell separation is the horizontal separation between the columns in which each cell resides. To measure this distance, the histologic section was optically projected over the computer-reconstructed electrode tracks in register with the digitized histologic section. Each cell of the pair was projected to layer V along radial fibers and a line integral along layer V between these projected points was calculated using 50-μm calipers. This distance is called “horizontal separation.”
The presumptive laminar locations of all cells were identified by superimposing electrode tracks over the appropriate histologic section. Recording sites of each cell were classified as being located within either laminae II–III, V, or VI. Laminae II and III were grouped together because discrimination of the cytoarchitectonic boundary between them was difficult with the stains used. The Nissl stain used in the histology of animal 1 allowed clear delineation of layer VI (below layer V and absence of Betz cells), layer V (presence of Betz cells), and layer II–III (above layer V). In animal 2, the neutral red counterstain made delineation of the superficial border of layer V difficult; when a cell was judged to be on the border of layer III–V, the cell was categorized as a layer V cell. Layer VI cells were easily identified in this monkey since the deep border of layer V was well defined by the population of labeled corticospinal cells.
RESULTS
Database and classification of correlogram features
While the monkeys performed alternating ramp-and-hold wrist torques, a total of 221 precentral cells were isolated in a total of 110 electrode tracks. Cross-correlograms were compiled for 215 cell pairs. Thirty-nine percent of these correlograms (n = 84) exhibited significant features. A feature was defined as a significant positive or negative deviation of the correlogram from baseline that was sustained for successive bins. Five types of correlogram features were observed. 1) Central peaks straddled the origin (the time of the trigger cell spike) and dropped off more or less symmetrically; i.e., the time of peak was usually within 1 ms of the origin and the rate of decay was similar in the positive and negative directions. In contrast, 2) lagged central peaks had peaks displaced from the origin and demonstrated appreciable asymmetry in decay for positive and negative lag times. 3) Central troughs were sustained deviations below baseline that straddled the origin. 4) Lagged peaks were positive deviations above baseline with onsets after the correlogram origin. Finally, 5) lagged troughs were sustained negative deviations with onset after the reference spike trigger that subsequently returned to baseline.
All 215 correlograms were first analyzed by eye to detect the potential presence of any of these five features. Onset and offset of the feature and the area above (or below) baseline comprising the feature were subjected to statistical tests (Z statistic; see methods). In correlograms without overt features, a standard ±10-ms range was adopted for statistical testing. Features with |Z| ≥2.8 (P < 0.005) were considered significant; this correlated well with those judged to be significant by eye.
Examples of cross-correlogram features
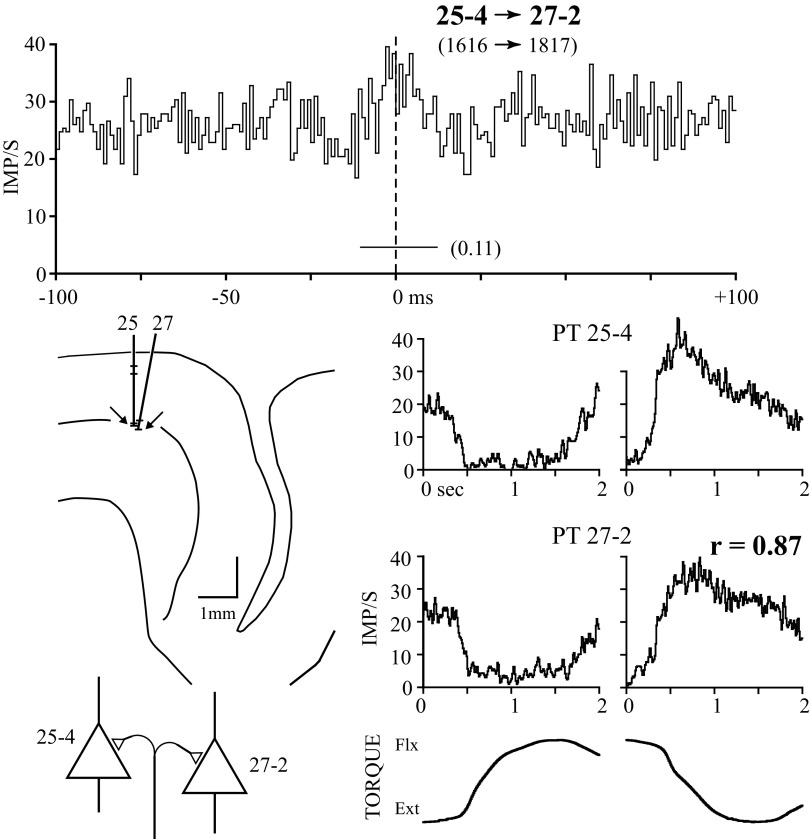
Figures 3–7 show examples of each of the five types of correlogram feature with the response averages of each cell comprising the pair and the cortical location of the cells. Central peaks represented the most frequent correlogram feature type, found in 44/84 significant correlograms. The example in Fig. 3 shows a correlogram with a central peak of 21-ms duration (horizontal bar below peak). These two PT cells were recorded in electrode tracks 25 and 27 (arrows, bottom left diagram) separated by 118 μm within layer V on the convexity of the gyrus. The presence of a central peak in the cross-correlogram can be interpreted as evidence for common synaptic input (Dickson and Gerstein 1974; Perkel et al. 1967), so a common afferent is shown connecting the two cortical cells (see discussion). The response averages (bottom right) indicate that the activity of both cells increased during extension torques and declined during flexion, in a parallel manner, yielding a response similarity of 0.89.
FIG. 3.
Cross-correlogram, response averages, histological location, and inferred synaptic connectivity between 2 pyramidal tract (PT) cells recorded on independent electrodes. Figures 5 through 8 follow the same format. The correlogram (top) is between cells 25-4 and 27-2 (1-ms bin width). Cell 25-4 is reference and the number of reference and target cell spikes is given in parentheses. The horizontal line below the peak indicates the time span of significant correlation and feature area (AN) is given to the right. The ordinate is scaled in frequency (bin count divided by the product of bin width and number of sweeps). Bottom right traces are response averages of unit activity and wrist torques aligned to the onset of flexion and extension ramp-and-hold torques. Zero wrist torque is approximately midway between flexion and extension torques. The reference cell's response average is on the top and the target cell's is on the bottom. Response similarity (r) is shown above the reference cell's extension average. Histological locations of recorded cells are shown in the middle left panel. The precentral gyrus is to the left of the central sulcus, the pial surface is represented by the solid line, the center of layer V by the middle line, and the gray–white junction by the lowest line. Individual cells recorded on electrode tracks 25 and 27 are indicated by horizontal lines with arrows indicating cells 25-4 and 27-2. Scale bar = 1 mm. The schematic at the bottom left represent 2 PT cells (open triangles) with common synaptic drive. In subsequent figures, non-PT (NPT) cells are represented as circles and corticomotoneuronal (CM) cells as filled triangles.
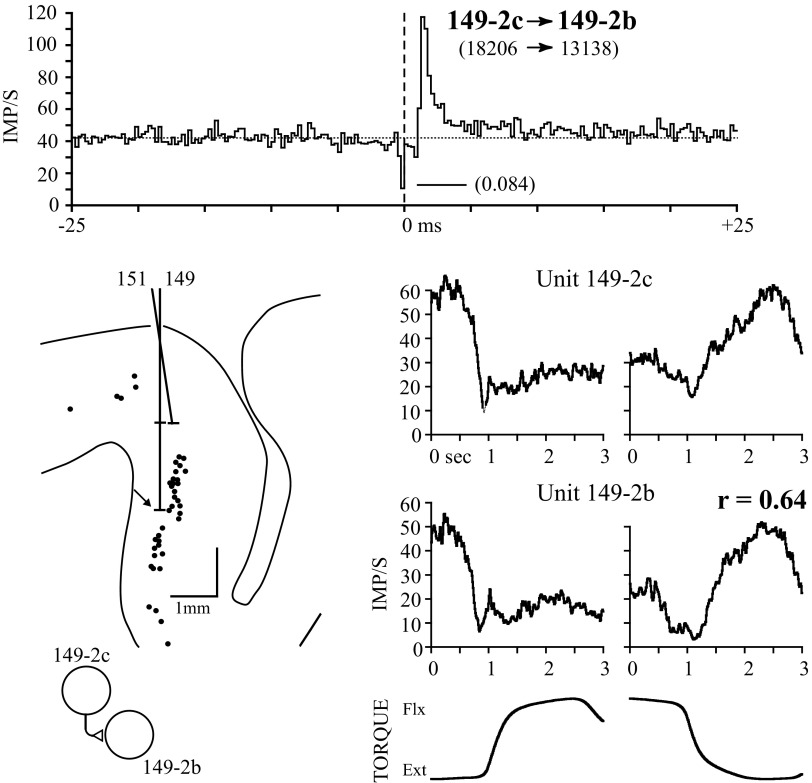
Lagged peaks were seen in isolation in 4/84 significant correlograms. Figure 4 illustrates a cell pair recorded simultaneously on the same electrode with a lagged correlogram peak. Both of these NPT cells were recorded deep in the bank of the precentral gyrus, below the HRP-labeled corticospinal population of layer V neurons (shown as dots). As in Fig. 3, the response profiles of the two units are very similar, differing mainly in absolute firing rate. The presence of a lagged peak with onset within 1.25 ms of the origin is most consistent with serial excitation from reference to target cell, schematized by an excitatory synapse between unit 149-2c and 149-2b.
FIG. 4.
Two NPT cells recorded on the same electrode with high response similarity and a lagged peak in the correlogram. The single, low count in the correlogram bin near the trigger is an artifact of time–amplitude separation of superimposed waveforms recorded on a single electrode. Peak onset is 1.25 ms; correlogram bin width is 0.25 ms. Corticospinal cells labeled after wheat-germ agglutinin conjugated horseradish peroxidase (WGA-HRP) injection into the contralateral cervical cord are shown as dots in the cross section. Cells 149-2c and 149-2b were recorded 250 μm below the labeled population of cells.
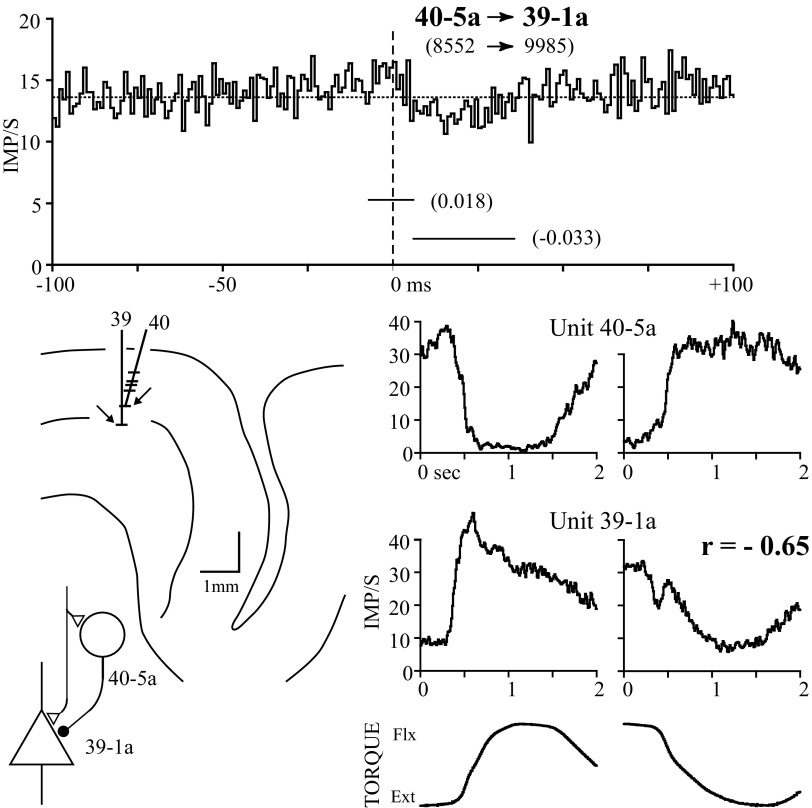
Lagged troughs were observed as infrequently (4/84) as lagged peaks. Figure 5 illustrates a pair of cells that fired reciprocally and exhibited a lagged correlogram trough. The response averages document the reciprocal firing patterns of these cells during the ramp-and-hold torques. The cross-correlogram is composed of two components: a lagged trough beginning at +6 ms and a small central peak. The lagged trough could not be explained by the refractory period in the target unit's autocorrelogram and provides evidence for serial synaptic inhibition. The central peak is small but statistically significant. The simplest synaptic circuit explaining these correlogram features is a combination of common synaptic input and serial inhibition. The reference unit (40-5a) was an NPT cell situated 300 μm superficial to unit 39-1a and 10 μm horizontally (tangent to layer V, as judged by radial fiber orientation). Three additional cell pairs demonstrated pure lagged troughs in their correlograms but were poorly modulated with the task.
FIG. 5.
NPT and PT cells recorded on independent electrodes with a combined central peak and lagged trough in the correlogram (horizontal line indicates baseline). The combination of a central peak and lagged trough is consistent with combined serial inhibition and common synaptic drive. Response averages show that the 2 units fire reciprocally during the task. Unit 40-5a was located 300 μm above unit 39-1a within the path of radial fibers on the precentral convexity.
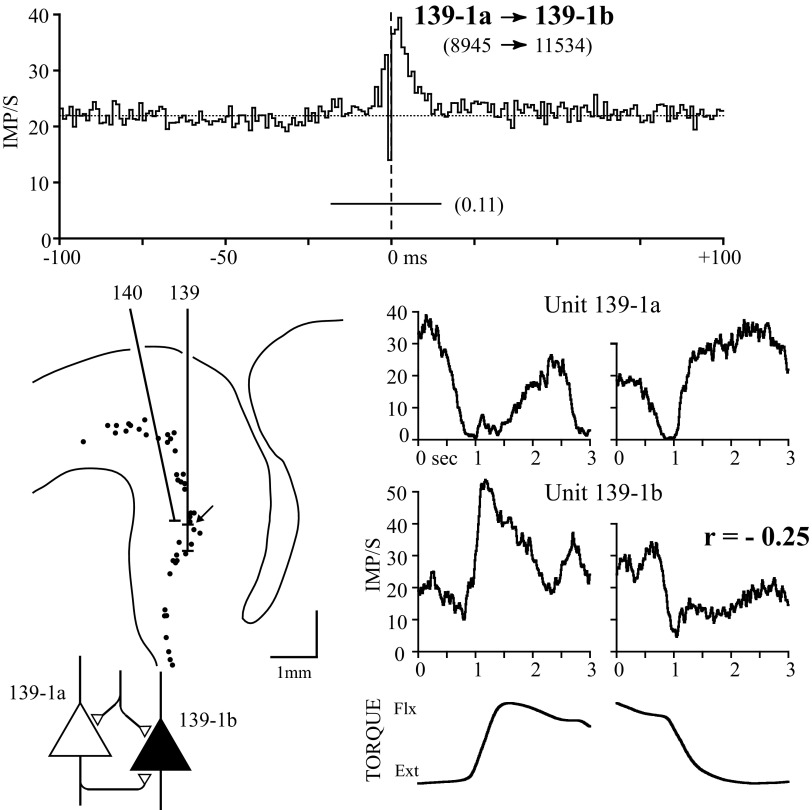
The presence of common synaptic input to, or serial excitation between, precentral cells with similar firing characteristics makes functional sense, as does a lagged correlogram trough between precentral cells with reciprocal responses. However, several counterintuitive relationships were also observed, as illustrated by the examples in Figs. 6 and 7. Figure 6 shows a pair of cells recorded midway down the bank of the precentral gyrus; their correlogram had a lagged central peak and yet the response averages reveal reciprocal firing patterns. The presence of a lagged central peak (seen in 21/84 significant correlograms) was interpreted as evidence for both common synaptic input and serial excitation (Dickson and Gerstein 1974), shown as a recurrent collateral from reference PT cell 139-1a. This interpretation is supported by further evidence analyzing the time course of these components during movement (Smith 1989). Although the response similarity is negative, the discharge patterns of these cells are not entirely reciprocal. The output target muscles of unit 139-1b were documented by spike-triggered averaging of EMG (Smith and Fetz 2009), which revealed postspike facilitation (PSF) in flexor muscles; unit 139-1a was a PT cell but produced no PSF in any recorded muscles.
FIG. 6.
A PT and CM cell recorded on the same electrode with correlogram exhibiting a lagged central peak and response averages showing largely reciprocal activity. The cells were recorded in the anterior bank of the precentral gyrus. The lagged component of the central peak was interpreted as evidence for serial excitation from unit 139-1a to unit 139-1b, represented as a recurrent collateral from the PT cell.
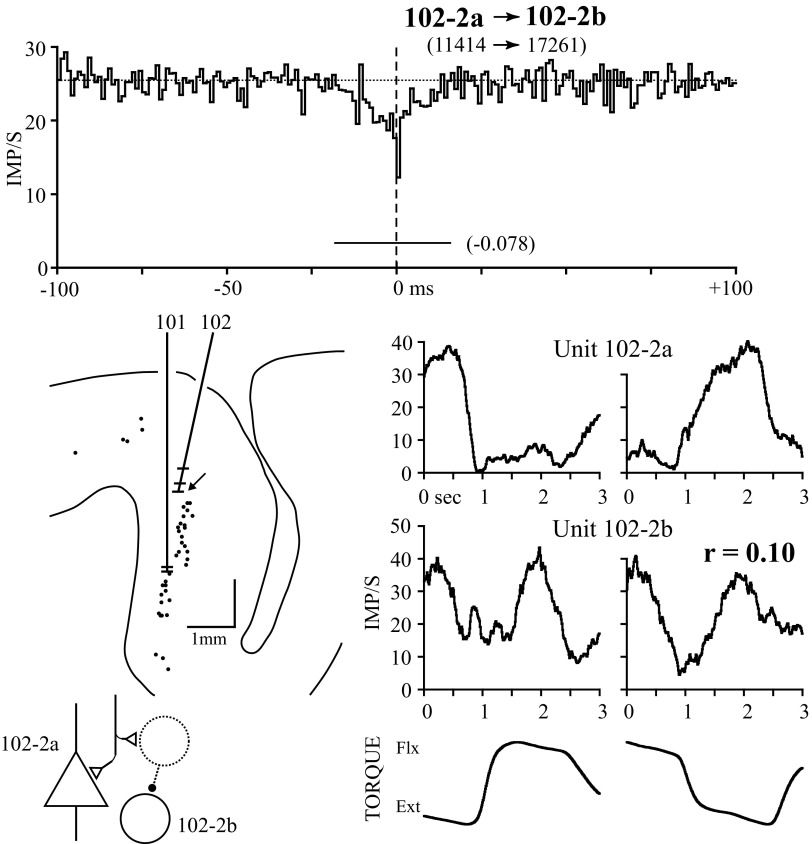
FIG. 7.
A PT and NPT cell recorded on the same electrode with a central trough in the correlogram. Although the cell's response properties are reciprocal in flexion, they are similar in extension, producing a small positive response similarity. The putative synaptic relationship accounting for this correlogram is shown in the bottom left. The dotted interneuron (not recorded) receives common input with cell 102-2a and, in turn, serially inhibits cell 102-2b.
Figure 7 illustrates the last correlogram feature type, a central trough (seen in 11/84 significant correlograms), and another example of a “paradoxical” response relationship. Moore et al. (1970) interpreted such correlogram troughs as evidence for internuncial cells that inhibit one cell of the pair while receiving input in common with the other cell, as illustrated. Under these circumstances the target cell will have a lower probability of firing when the reference cell is activated by the common afferents and, conversely, the reference unit will fire less when the target unit is disinhibited. One cell pair had an exceptionally wide central trough (102 ms) that was considered secondary to response coordination (i.e., the trough could be explained by rapid, reciprocal changes in activity evident in the response averages) and this pair was excluded from further analysis. For the pair in Fig. 7 the correlogram trough lasted 34 ms, much briefer than any variation in the response averages. The units fired reciprocally in the flexion direction, but covaried during extension. Compiling correlograms selectively during the flexion and extension phases of torque resulted in too few triggers for meaningful comparison. The target unit was a PT cell that did not produce PSF in any of the recorded forearm muscles; unit 102-2b is an NPT cell.
Table 1 summarizes the frequency of correlogram feature types found within this sample of 215 cell pairs. Of 84 significant correlograms, 65 (77%) had peaks straddling the origin, consistent with common synaptic input. Of these, 21 had superimposed lagged peaks. Only 8 (10%) had predominantly serial features.
TABLE 1.
Number of significant correlograms by pair and feature type
| CM–CM | CM–PT | CM–N | PT–PT | PT–N | N–N | Total | |
|---|---|---|---|---|---|---|---|
| Number of pairs | 12 | 22 | 40 | 15 | 75 | 51 | 215 |
| Significant correlograms, % | 6 (50) | 8 (36) | 12 (30) | 9 (60) | 28 (37) | 21 (41) | 84 (39) |
| Central peaks | 2 | 5 | 7 | 6 | 12 | 12 | 44 |
| Lagged central peaks | 3 | 1 | 2 | 2 | 9 | 4 | 21 |
| Lagged peaks | 0 | 0 | 2 | 0 | 0 | 2 | 4 |
| Lagged troughs | 0 | 0 | 0 | 0 | 1 | 3 | 4 |
| Central troughs | 1 | 2 | 1 | 1 | 6 | 0 | 11 |
Entries are number of cell pairs; values in parentheses indicate the percentage of cell pairs that were correlated for each column.
Response similarity and correlogram features
Although 39% of cell pairs had significant cross-correlogram features, 61% of pairs did not. It seems plausible that cells with similar or reciprocal firing properties could be coordinated by synaptic connections, whereas cells firing in an unrelated fashion would be less likely to have synaptic interactions. This hypothesis predicts that pairs with strong covariation in firing properties would have significant correlogram features and cells that fire independently would have flat correlograms.
To test this hypothesis we measured the similarity in response properties of both neurons by the “response similarity,” defined as the correlation coefficient between the smoothed firing rates of the two cells during active wrist torques (see methods, Fig. 2): it ranges from −1 to +1 and represents how similarly (positive) or dissimilarly (negative) the two cells fire during the isometric tasks (see methods). Numbers near zero represent cells that fire in an unrelated manner. Examples of response similarity values are given in Figs. 4–7 as the “r” numbers between the respective response averages.
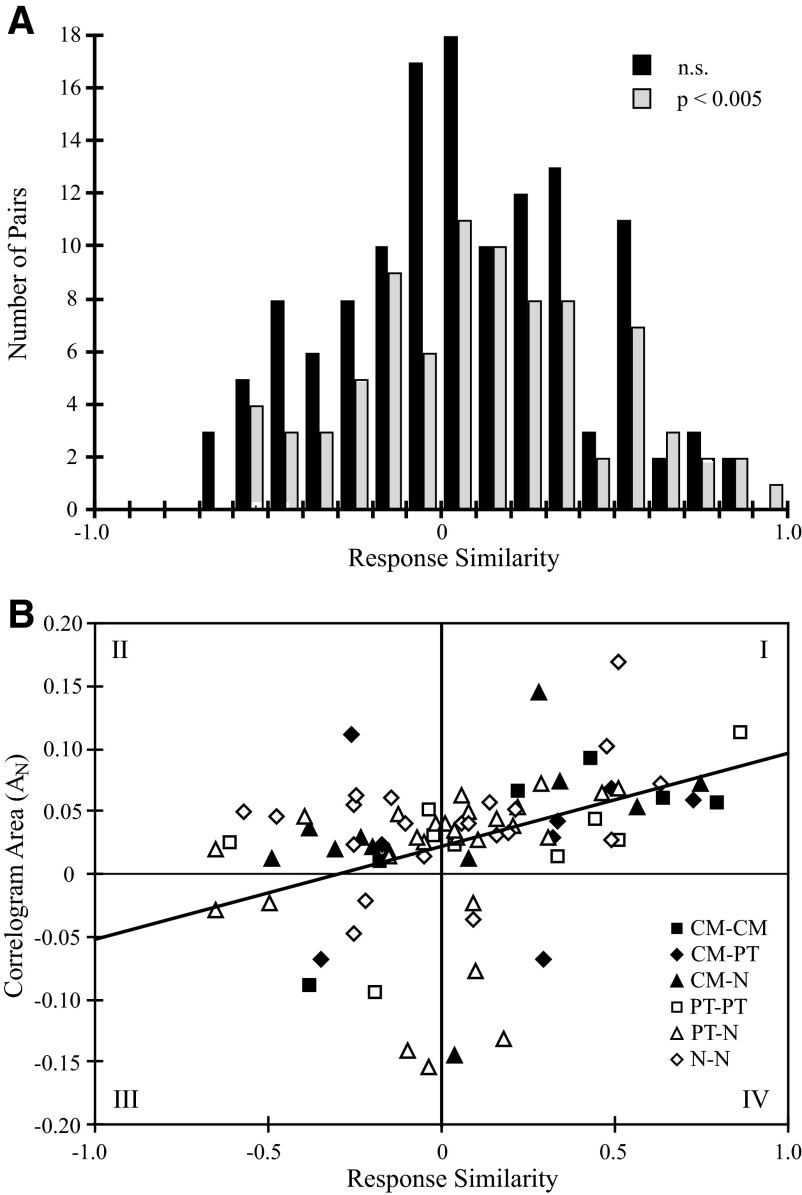
The distribution of response similarity values for cell pairs with significant and nonsignificant correlograms is shown in Fig. 8A. The distributions are nearly symmetric around zero, with a mean for all pairs of 0.035 and median of 0.039. Although correlated pairs were out-numbered by uncorrelated pairs, the two distributions are not significantly different. The occurrence of a significant, positive correlogram feature (central peak, lagged central peak, or lagged peak) was no more frequent between cell pairs with positive response similarity than negative (P = 0.25). Similarly, significant, negative correlogram features (central trough or lagged trough) were no more frequent among cell pairs with negative response similarity than positive (P = 0.43). Thus the observation that two cortical cells respond similarly during an active task does not imply that evidence for consistent synaptic interaction will be found in the correlogram.
FIG. 8.
A: distribution of response similarity values for all cell pairs (n = 215). Similarity values for cell pairs with significant correlogram features (P < 0.005; stipple) do not differ in distribution from cell pairs with no significant correlogram features (black). B: relationship between correlogram area (AN) and response similarity for all significant correlograms (n = 84). Data points are divided into 6 categories depending on cell types. The graph is divided into 4 quadrants indicated by roman numerals (I–IV). Quadrants I and III represent regions where cells with similar response properties had peaks in the correlogram and cells with reciprocal response properties that had troughs in the correlograms, respectively. Cell pairs with peaks in the correlogram but reciprocal response properties fell in quadrant II and cell pairs with correlogram troughs and similar response properties fell into quadrant IV. Correlation coefficient of regression line is 0.410 (P < 0.001, df = 82).
However, within the population of correlated cell pairs a relationship between the correlogram feature magnitude—which can be taken to represent the strength of synaptic interaction—and response similarity was observed. Figure 8B plots AN (the area of the correlogram feature normalized to the algebraic mean of the number of target and reference cell spikes) against response similarity for all significant correlograms. The graph was divided into four quadrants (I–IV). Cell pairs appearing in quadrant I had positive correlogram peaks and similar response properties, whereas quadrant III represents correlograms with troughs from cells with reciprocal response properties. For these quadrants the correlogram features are functionally consistent with response similarity. In contrast, the cells in quadrants II and IV represent a counterintuitive situation. The regression line is significant (r = 0.410, P < 0.001, n = 84) and the positive slope indicates that stronger response similarity is correlated with larger correlogram features. Quadrant I contains 41 points (49%) and quadrant III contains 9 (11%), representing 60% of significantly correlated cell pairs. The majority of the remaining pairs fell in quadrant II (n = 28, 33%); only 6 (7%) occurred in quadrant IV. Each symbol is coded for the six possible combinations of cell types in the pair (see legend); there was no systematic dependence of synaptic interaction or response similarity on cell type.
When analyzed separately by correlogram feature type, no clear relationship between feature type and response similarity was found. Lagged peaks (n = 4) were evenly distributed between quadrants I and II (e.g., Fig. 4); i.e., only half of serial, excitatory connections were between cell pairs with similar firing characteristics. The lagged troughs (n = 4) all fell within quadrant III; however, in three of the four cell pairs, one cell in each was weakly modulated with the motor task. Central troughs (n = 11) were evenly distributed between quadrants III (n = 5) and IV (n = 6). Finally, although more central peaks and lagged central peaks fell within quadrant I (n = 39) than within quadrant II (n = 26), the difference was not statistically significant, alone or in combination (P > 0.10).
Duration and strength of synaptic interactions
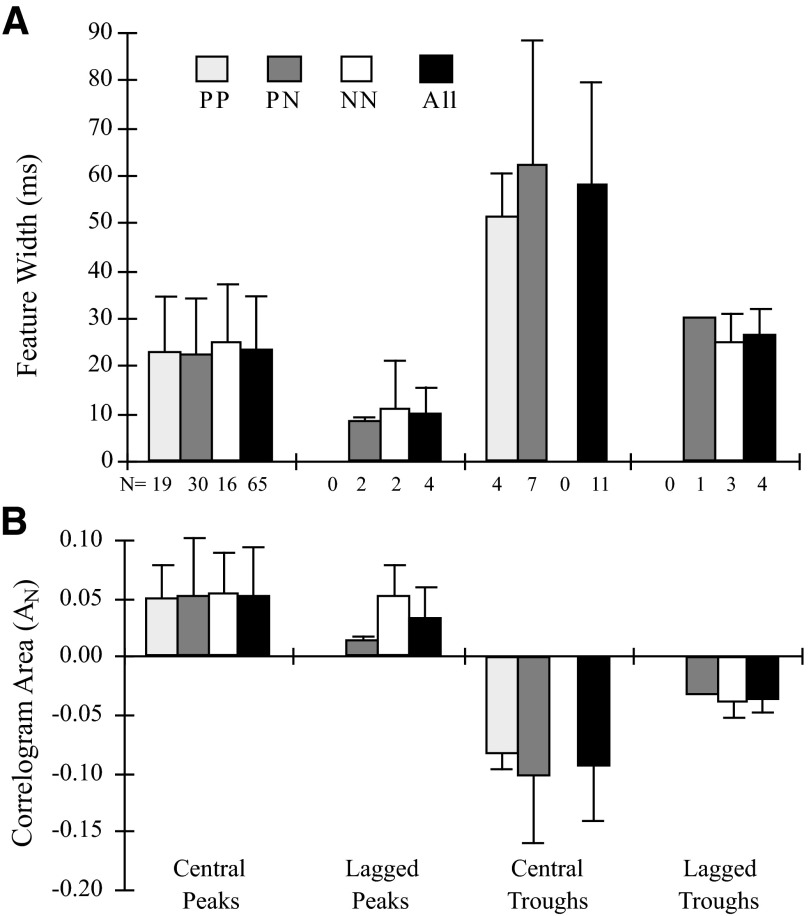
The duration and strength of the synaptic interactions were quantified as the width and normalized area of the correlogram feature. The average measures are given in Fig. 9 for each type of feature. The bars further distinguish these values for each of the three possible pairings of PT and NPT cell types (CM was combined with PT). Contrary to the expectation that the morphological differences between pyramidal and nonpyramidal cells might lead to different interaction measures, the parameters were not significantly different for pair types (within each feature type). However, the overall averages (rightmost bars of each category) show significant differences across features. The widths of central peaks and lagged troughs were similar, whereas central troughs were significantly wider and lagged peaks were significantly narrower. The area of central peaks was not significantly different from that for lagged peaks, although central troughs had a larger negative area than that of lagged troughs.
FIG. 9.
Feature width (A) and normalized area (B) for different features in cross-correlograms, for different types of cell pairs (P = PT or CM cell; N = nonidentified cell). Lines give SD and numbers give number of cell pairs. Within each feature group there was no significant difference in the area or the width of specific cell-type pairs. Overall, central peaks and lagged peaks did not differ significantly in area (P > 0.35), but central troughs had larger negative area than that of lagged troughs. Overall, the width of each feature type was significantly different from all other types (P < 0.05) except for central peaks and lagged troughs (P > 0.50).
Our cross-correlograms were constructed for all activity, throughout the behavioral task. To document variation in synaptic interactions during the ramp-and-hold task, we also compiled cross-correlograms during separate phases of the task, as well as “joint poststimulus time histograms” (JPSTHs) (Aertsen et al. 1989) aligned at response onset. Of 73 cell pairs analyzed with JPSTH, 39 showed no obvious modulation in the JPSTH during the ramp-and-hold torque trajectories. A third of the pairs (n = 25) showed a decline in the JPSTH during times of phasic increases of firing of one or both neurons. This counterintuitive drop in interactions during an increase in firing rate was confirmed by selective cross-correlograms. As described elsewhere (Smith 1989), changes in components of the JPSTH and correlograms suggest that serial and common input mechanisms may be modulated independently.
Strength of synaptic interaction and cell separation
If the cortex were isotropic with respect to synaptic connections, the prevalence of synaptic interconnection and the strength of synchrony between any two cells would decline inversely with distance to the third power. However, anatomical evidence (Jones and Wise 1977) suggests that corticocortical and thalamocortical connections may be distributed to motor cortex in mediolateral strips. The width of these strips is about 0.5 mm and their spatial periodicity is about 0.5–1.0 mm. Within our study, all cell pairs were recorded within a plane perpendicular to the central sulcus and thus perpendicular to the periodic bands of afferent fiber terminations. To determine whether correlation occurred at a preferred cell separation, the separation for each cell pair was derived from histological reconstructions. We projected each cell to layer V along the orientation of radial fibers and calculated the line integral of distance between the cells along layer V, termed horizontal separation (see methods).
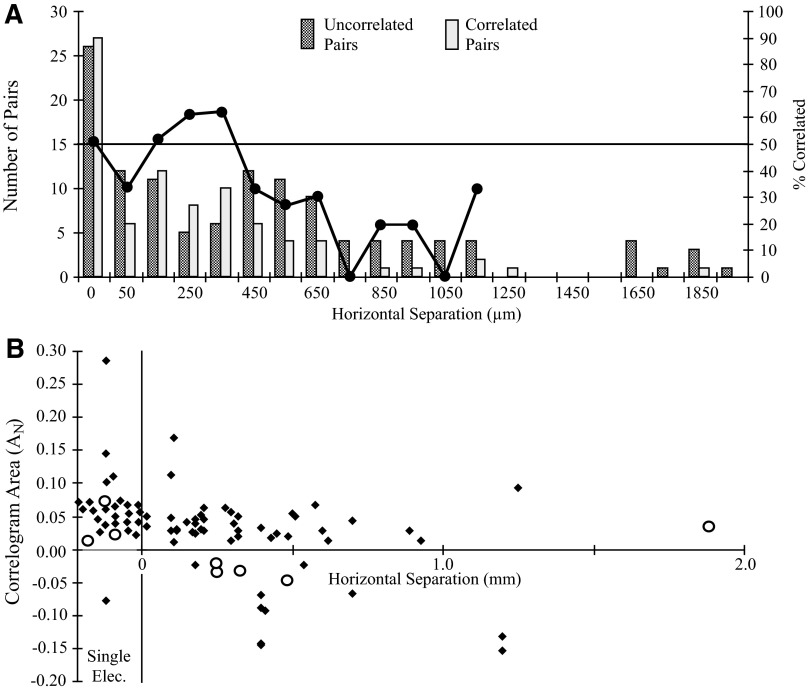
Figure 10A plots a histogram of correlated and uncorrelated pairs as a function of horizontal separation. The pair of bars at 0 separation represents pairs recorded on the same electrode, 51% of which were correlated. The combined prevalence of correlation was higher in the range from 100 to 400 μm than that between pairs on a single electrode. Beyond 400-μm separation this prevalence declines to <25% on average. Separating the data into two ranges at 400 μm, 51% of pairs less than this distance and 25% greater than this were correlated. This suggests that synaptic interactions, most of which are common synaptic input, are concentrated within 400-μm columns in cortex.
FIG. 10.
A: distribution of correlated (light stipple) and uncorrelated (heavy stipple) cell pairs by horizontal separation along layer V. The superimposed line plots the percentage of correlated pairs within each 100-μm division (right ordinate). Fifty-one percent of pairs recorded on the same electrode (0 mm) were correlated and >50% of cell pairs separated by 100–400 μm were correlated. No correlated pairs were found beyond 1,890 μm (6 uncorrelated cell pairs were separated by distances between 2.0 and 3.8 mm; data not shown). B: relation between normalized correlogram area (AN) and horizontal separation between paired cells. Cells recorded on the same electrode are shown below abscissa values of 0. Central features (peaks, lagged peaks and troughs) are plotted as solid diamonds. Lagged peaks and lagged troughs are plotted as open circles.
The strength of correlation, measured by AN, was not related to horizontal separation (Fig. 10B). Although the largest correlogram features were found for pairs recorded on a single electrode, AN assumed a constant value for larger distances. Normalized area remains essentially constant if the two points at 100 μm are excluded. The open circles in this figure represent lagged peaks (positive areas) and lagged troughs (negative areas). The separation of serial inhibitory pairs ranged from 250 to 490 μm; no serial inhibition was observed between pairs recorded on the same electrode.
Laminar location of recorded cells
The synaptic interactions between precentral cells depended in part on the cortical lamina of each cell. To estimate the laminar location of a recorded cell, electrode tracks were superimposed over the appropriate histologic section. Cells were classified as belonging to layers II–III, V, or VI. Of 215 cells, 17 were in layers II–III, 180 were in layer V, and 18 were in layer VI. The preponderance of layer V cells reflects a methodological bias to record as many PT and CM neurons as possible. Larger neurons tended to be sampled preferentially due to the electrodes' recording bias and the need for long-term stable isolation.
Table 2 shows the number of correlated pairs listed by the locations of reference and target cell and by the type of correlogram feature. Central peaks were found between 42% of correlated cells within layer V; 91% of these were separated by <600 μm horizontally. Only one of the layer II–III cells shared common inputs with a layer V cell. All correlograms with central troughs were found for neurons within layer V. No significant differences existed between the mean normalized areas of correlogram features for pairs of cells located in the same or different laminae.
TABLE 2.
Number of correlogram features seen in correlations between cells of different cortical layers
| Location of Cells | CP | CT | LP | LT | Total | %COR |
|---|---|---|---|---|---|---|
| II–III ↔ II–III | 1 | 0 | 0 | 0 | 2 | 50 |
| II–III ↔ V | 1 | 0 | 0 | 2 | 17 | 18 |
| II–III ↔ VI | 0 | 0 | 0 | 1 | 4 | 25 |
| V ↔ V | 56 | 11 | 3 | 1 | 171 | 42 |
| V ↔ VI | 4 | 0 | 1 | 0 | 15 | 33 |
| V ↔ V | 2 | 0 | 0 | 0 | 3 | 67 |
CP, central peak; CT, central trough; LP, lagged peak; LT, lagged trough. Totals include all cell pairs in each layer group analyzed. %COR, proportion of pairs in each row with correlogram features.
DISCUSSION
These results elucidate the degree to which synaptic interactions between motor cortex neurons are correlated with their modulation during isometric hand torques. The results augment the body of data on neuronal responses in different regions during this ramp-and-hold torque task (summarized in Fetz et al. 2002). The major types of interactions provide interesting comparisons with results from other studies of motor cortex and from other cortical regions.
Common synaptic input
Most of the cell pairs with significant correlogram features (90%) had features that straddled the origin; three fourths had central peaks, consistent with common synaptic input (Moore et al. 1970) or correlated input (Brody 1999a,b). Central peaks are the most prevalent feature found for cell pairs in various cortical regions, including visual cortex (Michalski et al. 1983; Toyama et al. 1981a; T'so et al. 1986) auditory cortex (Dickson and Gerstein 1974; Eggermont 1994; Frostig et al. 1983; Nelson et al. 1992), association area (Noda and Adey 1973), and motor cortex (Allum et al. 1982; Jackson et al. 2003; Kwan et al. 1987). Our results also agree well with a study of synaptic interactions between pairs of precentral cortex neurons determined by STAs of intracellularly recorded membrane potentials (Matsumura et al. 1996). In that study 82% of STAs with features had average synchronous excitatory potentials (ASEPs), which began before the trigger spike. These ASEPs produce central correlogram peaks whose duration typically coincides with the rising edge of the ASEP (Matsumura et al. 1996). The rise time of the ASEPs (18 ± 7 ms) agrees well with the mean width of our central peaks (22 ms).
Two types of mechanisms could produce central peaks: last-order “common input” neurons that send divergent synaptic connections to both of the correlated cells or synchronized input from separate but correlated sources. Direct common input most likely explains the narrower (≤20 ms) central peaks (Nelson et al. 1992). In this case, the number of synchronous inputs from such common cells can be estimated by comparing the size (i.e., area) of the central peak to that of lagged peaks produced by serial connections. The probability that an afferent fiber that bifurcates to two cortical neurons will fire both cells together is the product of the probabilities that an afferent impulse will produce a spike in each cell. If the mean synaptic efficacy of a serial connection is α, the expected contribution of a common input cell to a central correlogram peak of area AN would be α2. The average value of α for the serial, excitatory correlograms in this study was 0.032. A common afferent fiber with this efficacy would be expected to produce a central peak with AN = 0.0010. The average AN for all central peaks was 0.051, roughly 50-fold higher than that expected from a single fiber. This would suggest that about 50 synchronous inputs from common afferents would be expected to mediate the average central peak.
The central peaks could also be produced in part by separate but synchronized inputs (Brody 1999a,b; Lampl et al. 1999). These would be tightly timed, aperiodic synchronous inputs. In monkeys making free reaching movements oscillatory activity in sensorimotor cortex can transiently synchronize large populations of neurons (Baker et al. 1999, 2001; Donoghue et al. 1998; Murthy and Fetz 1992, 1996). Such oscillatory activity does not seem a likely explanation of our central correlogram peaks because careful analysis of the cross- and autocorrelograms of the cells in this study revealed no evidence of periodicity. Moreover, the cortical oscillations entrained cells over wide regions, whereas the central peaks were seen for cells separated by only several millimeters. This suggests that the synchrony described here is not due to periodic oscillations, but rather involves relatively direct common input neurons or aperiodic synchronized inputs.
Serial excitation
In this study 5% of the correlograms with significant features showed lagged peaks, indicative of serial excitation. This compares with 8% of STAs that showed pure excitatory postsynaptic potentials (EPSPs) in vivo (Matsumura et al. 1996). The mean width of our lagged correlogram peaks (10 ms) is slightly longer than the mean rise time of the serial EPSPs (6 ± 3 ms). This is consistent with the fact that in cortical neurons, transient depolarizing potentials trigger action potentials not only on their rising edge by direct threshold crossings, but also later, due to delayed crossings produced by a regenerative inward current (cf. Fig. 2 in Fetz et al. 1991; Reyes and Fetz 1993). Later spikes can also be initiated by the superposition of the decaying EPSP and synaptic noise (Fetz and Gustafsson 1983).
The peak area (α) of our four lagged peaks, normalized to the number of triggers, represented 0.041 above-baseline counts per trigger. Using the transform between EPSPs and the correlogram peaks they produced in vivo (Matsumura et al. 1996), this value would predict that the underlying EPSPs had mean amplitudes of 133 μV. This prediction is smaller than the mean EPSP amplitudes observed in STAs in vivo (226 ± 130 μV) and in vitro (Reyes and Sakmann 1999; Reyes et al. 1998; Thomson et al. 1993a,b), but compatible with the range of values.
Many correlograms (n = 21) in this sample showed lagged central peaks, which may represent a combination of recurrent excitation superimposed on common synaptic input (Dickson and Gerstein 1974). Lagged central peaks between PT and NPT cells (n = 11) nearly always showed lagged peaks in the direction of PT to NPT cell (n = 10). Asymmetric peaks were also observed between PT pairs, including CM cells, but were not seen between NPT pairs. There is anatomical (Ghosh and Porter 1988a) and physiological (Kang et al. 1988; Stefanis and Jasper 1964) evidence for recurrent collaterals from PT cells onto other PT cells in motor cortex.
Serial inhibition
Of the correlograms with significant features, 5% showed lagged troughs, indicative of serial inhibition. This compares with 4% of STAs that showed pure serial inhibitory postsynaptic potentials (IPSPs) in vivo (Matsumura et al. 1996). The duration of the four lagged troughs observed in this study averaged 26 ms, which is comparable to the mean duration of the serial IPSPs (25 ± 4 ms). Lagged correlogram troughs with long durations were also found in cat visual cortex neurons (>80 ms) by Toyama et al. (1981b) and in pericruciate cortex (36–60 ms) by Renaud and Kelly (1974). Direct comparison of PSPs and correlograms in motoneurons showed that the duration of the correlogram trough exceeded the rise time of the IPSP but was shorter than the duration of the IPSP (Fetz and Gustafsson 1983).
The relative paucity of evidence for serial inhibition from correlograms seems discrepant with electrophysiological and anatomical studies indicating a predominance of intracortical inhibition within motor cortex. Intracortical inhibition is presumably responsible in part for sculpting the response properties of motor cortex cells. Its importance was demonstrated by the fact that iontophoresis of bicuculline in motor cortex converted responses of precentral neurons from unidirectional responses during limb movements to bidirectional responses (Matsumura et al. 1991). Of the eight morphological types of intracortical neurons (Jones 1975b) only one type—the spiny stellate cell of layer IV—is believed to be excitatory. Thus inhibition should be the predominant serial connection to be found. The lack of correlograms with lagged troughs may be explained by several factors. First is the likely sampling bias against recording such small internuncial cells. Most presumed inhibitory neurons have a relatively symmetric dendritic arborization (closed-field neurons) and a small soma that would make them difficult to record and would bias extracellular recordings to large, open-field pyramidal cells. Second, cross-correlation techniques are less sensitive for detecting inhibition, as suggested by simulation studies (Aertsen and Gerstein 1985). Third, inhibitory troughs may be masked by central peaks produced by concomitant common inputs.
Synaptic interactions between cells in cortical layers
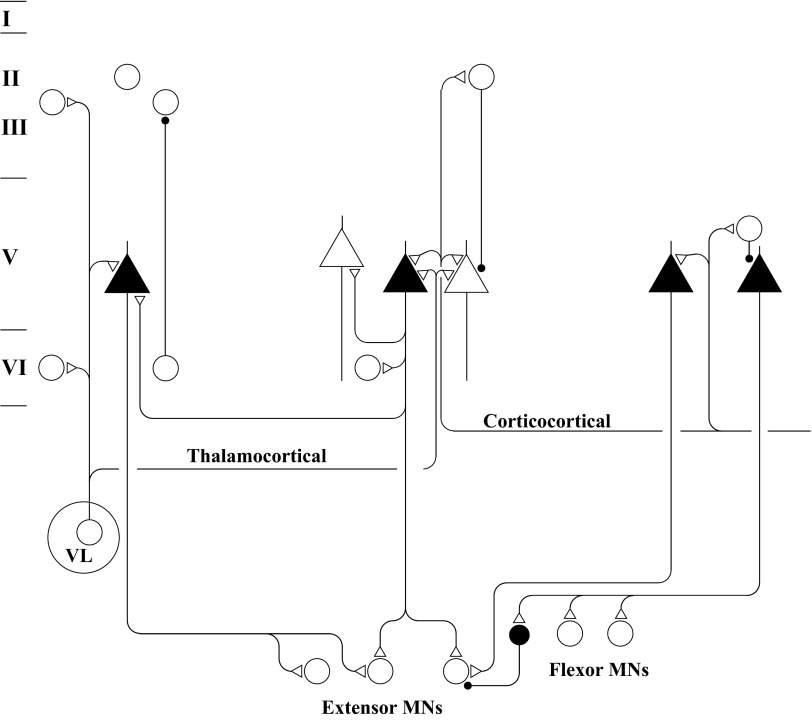
The connections revealed by cross-correlation features documented in this and the companion study (Smith and Fetz 2009) are summarized schematically in Fig. 11. The three major types of precentral cells are shown at their laminar locations. Each of the illustrated connections between cells corresponds to an observed correlation. Extracortical inputs, although not specifically identified, are shown to arise from specific thalamic afferent fibers (from nucleus ventralis lateralis) and corticocortical fibers arising from cortex outside area 4.
FIG. 11.
Schematic representation of synaptic interactions among identified motor cortex neurons and the distribution of input fibers, based on observed correlations. Icons in the top half of the drawing indicate precentral cells within cytoarchitectonic layers (left). CM cells are represented as filled triangles, PT cells as unfilled triangles, and all other cells as circles. Unfilled and filled terminals signify excitatory and inhibitory synapses, respectively. Inputs from thalamic nucleus VL is shown projecting to 3 columns of precentral cells. Cortical inputs to motor cortex are represented by the fiber emerging from the right. Motoneurons of different extensor and flexor muscles are shown below, each receiving excitatory inputs from precentral CM cells. A spinal internuncial inhibitory neuron is shown to mediate disynaptic inhibition from a CM cell to an extensor motoneuron.
The cortical cells are grouped into three “columns” of about 500-μm width, in accordance with the range over which neurons were found to receive common inputs. Common inputs were observed to synchronize cells within and across cortical layers, including cells in layers II–III, V, and VI (left column). Pairs of layer V neurons received common inputs (middle column) or were connected in a reciprocal fashion (right column). A similar broad distribution of common inputs has been observed in visual cortex (Douglas and Martin 2004; Toyama et al. 1981a).
Recurrent collaterals from layer V cells were found to project to other layer V cells and to layer VI cells (middle column). No intracortical excitation was observed to originate from cells outside layer V, suggesting that a major source of intracortical excitation derives from recurrent collaterals of pyramidal cells. In contrast, in visual cortex excitatory connections have been observed from layer III–IV border cells to supragranular cells and from supragranular cells to layer V cells (Komatsu et al. 1988; Thomson and Lamy 2007; Toyama et al. 1981a). Such differences may reflect differences in cortical organization between primary sensory and motor cortices or sampling bias.
Serial inhibitory connections were found between layer VI and layer II–III cells (left column) and between layer II–III and layer V cells (middle column). In visual cortex, layer III–IV border cells have been shown to provide inhibitory connections to supragranular neurons (Komatsu et al. 1988; Thomson and Lamy 2007; Toyama et al. 1981a). Again, such differences may be accounted for by the different methodologies used (intracellular vs. extracellular) or by different synaptic organization of these two cortical regions.
Relation between synaptic interaction and firing properties of precentral cells
This study was designed to address the degree to which the firing properties of motor cortex cells are correlated with their synaptic interactions. As shown in Fig. 8A, the presence or absence of a correlational linkage did not depend on how similarly two cortical units fired during the operant task. In other words one cannot infer functional interactions between two cortical neurons by comparing their response patterns. Obvious as this point may seem, there is a natural and historical tendency to infer such interactions. For example, the correlations between the smoothed firing probability of cells and muscles have been used to infer functional interactions (Houk et al. 1987), although such measures of covariation are task dependent and do not establish causal interactions. At the cortical level we found that even neighboring cells with highly similar response patterns are not necessarily coupled by monosynaptic or common input connections. This suggests a sparse connectivity, in which cells are driven in parallel by separate inputs with similar response patterns. Likewise, two cortical cells with reciprocal response patterns are not necessarily coupled by inhibitory linkages. A relevant caveat is that the prevalence of reciprocal inhibition may have been underestimated because significant correlograms are more difficult to compile for reciprocally activated pairs and for relatively inactive cells.
In contrast, when pairs of precentral cells did have a correlogram feature, its size was significantly related with the similarity in their firing patterns during volitional wrist torques (Fig. 8B). Nevertheless, the relationship is weak because the effect of unitary EPSPs is a brief statistical increase in the firing probability of the postsynaptic cell (Cope et al. 1987; Moore et al. 1970; Reyes and Fetz 1993). Previous studies have noted qualitative agreement between measures of correlation and response patterns (Allum et al. 1982; Fetz et al. 1991; Georgopoulos et al. 1993). A potential confound in this relationship is the possibility that covariation can influence correlation measures. For example, a measure based on the first recurrence times of spikes in one cell relative to spikes of the second was correlated with the similarity in directional tuning (Georgopoulos et al. 1993), but was also influenced by covariation (Fetz and Shupe 1994; Georgopoulos et al. 1994).
In the present study, the sign and magnitude of correlation features (AN) were significantly related to response similarity (Fig. 8B). Pairs with positive response similarity tended to have larger positive correlogram peaks than those of cells with dissimilar firing patterns. Likewise, pairs with negative similarity had a larger proportion of correlogram troughs than that of pairs with positive similarity. Thus it appears that synaptic interactions do help to shape the response pattern of precentral neurons. However, the magnitudes of individual correlational linkages are relative small, indicating that many neurons must be involved in determining activity during a motor task.
The linear regression in Fig. 8B does not go through the origin, but is shifted upward. This represents the contribution of positive correlation features, which in most cases were central peaks. These correlation peaks appear across the range of response similarity and may be viewed as subserving another functional role: a form of sensorimotor binding or coordination of cells involved in the same behavior. Thus the task-related modulations are separable and appear superimposed on a broader cofacilitation of cells involved in the task.
Conclusions
The present results indicate that the synaptic interactions between motor cortex neurons during voluntary wrist torques are largely consistent with their firing properties. However, the relationship is weak and the scatter is large. This indicates a considerable degree of independence between connections and coactivations. To determine whether this is a consequence of including diverse cell types, the companion paper reexamines the issue for corticomotoneuronal cells, which have correlational linkages with identified target muscles (Smith and Fetz 2009).
GRANTS
This work was supported by National Institutes of Health Grants NS-12542 and RR-0166 and the Poncin Foundation.
Acknowledgments
We thank Dr. Keisuke Toyama for helpful suggestions and L. Shupe for technical support.
Present address of W. Smith: Department of Neurology, University of California San Francisco, San Francisco, CA 94143.
REFERENCES
- Aertsen and Gerstein 1985.Aertsen AM, Gerstein GL. Evaluation of neuronal connectivity: sensitivity of cross-correlation. Brain Res 340: 341–354, 1985. [DOI] [PubMed] [Google Scholar]
- Aertsen et al. 1989.Aertsen AM, Gerstein GL, Habib MK, Palm G. Dynamics of neuronal firing correlation: modulation of “effective connectivity.” J Neurophysiol 61: 900–917, 1989. [DOI] [PubMed] [Google Scholar]
- Allum et al. 1982.Allum JH, Hepp-Reymond MC, Gysin R. Cross-correlation analysis of interneuronal connectivity in the motor cortex of the monkey. Brain Res 231: 325–334, 1982. [DOI] [PubMed] [Google Scholar]
- Baker et al. 1999.Baker SN, Kilner JM, Pinches EM, Lemon RN. The role of synchrony and oscillations in the motor output. Exp Brain Res 128: 109–117, 1999. [DOI] [PubMed] [Google Scholar]
- Baker et al. 2001.Baker SN, Spinks R, Jackson A, Lemon RN. Synchronization in monkey motor cortex during a precision grip task. I. Task-dependent modulation in single-unit synchrony. J Neurophysiol 85: 869–885, 2001. [DOI] [PubMed] [Google Scholar]
- Brody 1999a.Brody CD Correlations without synchrony. Neural Comput 11: 1537–1551, 1999a. [DOI] [PubMed] [Google Scholar]
- Brody 1999b.Brody CD Disambiguating different covariation types. Neural Comput 11: 1527–1535, 1999b. [DOI] [PubMed] [Google Scholar]
- Cheney et al. 1991.Cheney PD, Fetz EE, Mewes K. Neural mechanisms underlying corticospinal and rubrospinal control of limb movements. Prog Brain Res 87: 213–252, 1991. [DOI] [PubMed] [Google Scholar]
- Cope et al. 1987.Cope TC, Fetz EE, Matsumura M. Cross-correlation assessment of synaptic strength of single Ia fibre connections with triceps surae motoneurones in cats. J Physiol 390: 161–188, 1987. [DOI] [PMC free article] [PubMed] [Google Scholar]
- Dickson and Gerstein 1974.Dickson JW, Gerstein GL. Interactions between neurons in auditory cortex of the cat. J Neurophysiol 37: 1239–1261, 1974. [DOI] [PubMed] [Google Scholar]
- Donoghue et al. 1998.Donoghue JP, Sanes JN, Hatsopoulos NG, Gaal G. Neural discharge and local field potential oscillations in primate motor cortex during voluntary movements. J Neurophysiol 79: 159–173, 1998. [DOI] [PubMed] [Google Scholar]
- Douglas and Martin 2004.Douglas RJ, Martin KA. Neuronal circuits of the neocortex. Annu Rev Neurosci 27: 419–451, 2004. [DOI] [PubMed] [Google Scholar]
- Eggermont 1994.Eggermont JJ Neural interaction in cat primary auditory cortex. Dependence on recording depth, electrode separation, and age. J Neurophysiol 68: 1216–1228, 1994. [DOI] [PubMed] [Google Scholar]
- Fetz and Gustafsson 1983.Fetz EE, Gustafsson B. Relation between shapes of post-synaptic potentials and changes in firing probability of cat motoneurones. J Physiol 341: 387–410, 1983. [DOI] [PMC free article] [PubMed] [Google Scholar]
- Fetz et al. 2002.Fetz EE, Perlmutter SI, Prut Y, Seki K, Votaw S. Roles of primate spinal interneurons in preparation and execution of voluntary hand movement. Brain Res Rev 40: 53–65, 2002. [DOI] [PubMed] [Google Scholar]
- Fetz and Shupe 1994.Fetz EE, Shupe LE. Measuring synaptic interactions (Letter; comment). Science 263: 1295–1297, 1994. [DOI] [PubMed] [Google Scholar]
- Fetz et al. 1991.Fetz EE, Toyama K, Smith W. Synaptic interactions between cortical neurons. In: Cerebral Cortex: Altered Cortical States, edited by Peters A, Jones EG. New York: Plenum Press, 1991, vol. IX, p. 1–47.
- Frostig et al. 1983.Frostig RD, Gottlieb Y, Vaadia E, Abeles M. The effects of stimuli on the activity and functional connectivity of local neuronal groups in the cat auditory cortex. Brain Res 272: 211–221, 1983. [DOI] [PubMed] [Google Scholar]
- Georgopoulos et al. 1993.Georgopoulos AP, Taira M, Lukashin A. Cognitive neurophysiology of the motor cortex. Science 260: 47–52, 1993. [DOI] [PubMed] [Google Scholar]
- Georgopoulos et al. 1994.Georgopoulos AP, Taira M, Lukashin A. Measuring synaptic interactions (Letter; Comment). Science 263: 1295–1296, 1994.8122116 [Google Scholar]
- Ghosh and Porter 1988a.Ghosh S, Porter R. Morphology of pyramidal neurons in monkey motor cortex and the synaptic actions of their intracortical axon collaterals. J Physiol 400: 593–615, 1988a. [DOI] [PMC free article] [PubMed] [Google Scholar]
- Ghosh and Porter 1988b.Ghosh S, Porter R. Corticocortical synaptic influences on morphologically identified pyramidal neurons in the motor cortex of the monkey. J Physiol 400: 617–629, 1988b. [DOI] [PMC free article] [PubMed] [Google Scholar]
- Houk et al. 1987.Houk JC, Dessem DA, Miller LE, Sybirska EH. Correlation and spectral analysis of relations between single unit discharge and muscle activities. J Neurosci Methods 21: 201–224, 1987. [DOI] [PubMed] [Google Scholar]
- Jackson et al. 2003.Jackson A, Gee VJ, Baker SN, Lemon RN. Synchrony between neurons with similar muscle fields in monkey motor cortex. Neuron 38: 115–125, 2003. [DOI] [PubMed] [Google Scholar]
- Jones 1975b.Jones EG Lamination and differential distribution of thalamic afferents within the sensory-motor cortex of the squirrel monkey. J Comp Neurol 160: 167–203, 1975b. [DOI] [PubMed] [Google Scholar]
- Jones and Wise 1977.Jones EG, Wise SP. Size, laminar and columnar distribution of efferent cells in the sensory-motor cortex of monkeys. J Comp Neurol 175: 391–438, 1977. [DOI] [PubMed] [Google Scholar]
- Kang et al. 1988.Kang Y, Endo K, Araki T. Excitatory synaptic actions between pairs of neighboring pyramidal tract cells in the motor cortex. J Neurophysiol 59: 636–647, 1988. [DOI] [PubMed] [Google Scholar]
- Komatsu et al. 1988.Komatsu Y, Nakajima S, Toyama K, Fetz EE. Intracortical connectivity revealed by spike-triggered averaging in slice preparations of cat visual cortex. Brain Res 442: 359–362, 1988. [DOI] [PubMed] [Google Scholar]
- Kwan et al. 1987.Kwan HC, Murphy JT, Wong YC. Interaction between neurons in precentral cortical zones controlling different joints. Brain Res 400: 259–269, 1987. [DOI] [PubMed] [Google Scholar]
- Lampl et al. 1999.Lampl I, Reichova I, Ferster D. Synchronous membrane potential fluctuations in neurons of the cat visual cortex. Neuron 22: 361–374, 1999. [DOI] [PubMed] [Google Scholar]
- Markram 1997.Markram H A network of tufted layer 5 pyramidal neurons. Cereb Cortex 7: 523–533, 1997. [DOI] [PubMed] [Google Scholar]
- Markram et al. 1997.Markram H, Lubke J, Frotscher M, Roth A, Sakmann B. Physiology and anatomy of synaptic connections between thick tufted pyramidal neurones in the developing rat neocortex. J Physiol 500: 409–440, 1997. [DOI] [PMC free article] [PubMed] [Google Scholar]
- Matsumura et al. 1996.Matsumura M, Chen D, Sawaguchi T, Kubota K, Fetz EE. Synaptic interactions between primate precentral cortex neurons revealed by spike-triggered averaging of intracellular membrane potentials in vivo. J Neurosci 16: 7757–7767, 1996. [DOI] [PMC free article] [PubMed] [Google Scholar]
- Matsumura et al. 1991.Matsumura M, Sawaguchi T, Oishi T, Ueki K, Kubota K. Behavioral deficits induced by local injection of bicuculline and muscimol into the primate motor and premotor cortex. J Neurophysiol 65: 1542–1553, 1991. [DOI] [PubMed] [Google Scholar]
- Merchant et al. 2008.Merchant H, Naseralis T, Georgopoulos AP. Dynamic sculpting of directional tuning in the primate motor cortex during three-dimensional reaching. J Neurosci 28: 9164–9172, 2008. [DOI] [PMC free article] [PubMed] [Google Scholar]
- Michalski et al. 1983.Michalski A, Gerstein GL, Czarkowska J, Tarnecki R. Interactions between cat striate cortex neurons. Exp Brain Res 51: 97–107, 1983. [DOI] [PubMed] [Google Scholar]
- Moore et al. 1970.Moore GP, Segundo JP, Perkel DH, Levitan H. Statistical signs of synaptic interactions in neurons. Biophysiol J 10: 876–900, 1970. [DOI] [PMC free article] [PubMed] [Google Scholar]
- Murphy et al. 1985.Murphy JT, Kwan HC, Wong YC. Cross correlation studies in primate motor cortex: synaptic interaction and shared input. Can J Neurol Sci 12: 11–23, 1985. [DOI] [PubMed] [Google Scholar]
- Murthy and Fetz 1992.Murthy VN, Fetz EE. Coherent 25- to 35-Hz oscillations in the sensorimotor cortex of awake behaving monkeys. Proc Natl Acad Sci USA 89: 5670–5674, 1992. [DOI] [PMC free article] [PubMed] [Google Scholar]
- Murthy and Fetz 1996.Murthy VN, Fetz EE. Synchronization of neurons during local field potential oscillations in sensorimotor cortex of awake monkeys. J Neurophysiol 76: 3968–3982, 1996. [DOI] [PubMed] [Google Scholar]
- Nelson et al. 1992.Nelson JI, Salin PA, Munk MH, Arzi M, Bullier J. Spatial and temporal coherence in cortico-cortical connections: a cross-correlation study in areas 17 and 18 in the cat. Vis Neurosci 9: 21–37, 1992. [DOI] [PubMed] [Google Scholar]
- Noda and Adey 1973.Noda H, Adey WR. Neuronal activity in the association cortex of the cat during sleep, wakefulness and anesthesia. Brain Res 54: 243–259, 1973. [DOI] [PubMed] [Google Scholar]
- Olucha et al. 1985.Olucha F, Martinez-Garcia F, Lopez-Garcia C. A new stabilizing agent for the tetramethyl benzidine (TMB) reaction product in the histochemical detection of horseradish peroxidase (HRP). J Neurosci Methods 13: 131–138, 1985. [DOI] [PubMed] [Google Scholar]
- Perkel et al. 1967.Perkel DH, Gerstein GL, Moore GP. Neuronal spike trains and stochastic point processes. II. Simultaneous spike trains. Biophysiol J 7: 419–440, 1967. [DOI] [PMC free article] [PubMed] [Google Scholar]
- Renaud and Kelly 1974.Renaud LP, Kelly JS. Identification of possible inhibitory neurons in the pericruciate cortex of the cat. Brain Res 79: 9–28, 1974. [DOI] [PubMed] [Google Scholar]
- Reyes et al. 1998.Reyes A, Lujan R, Rozov A, Burnashev N, Somogyi P, Sakmann B. Target-cell-specific facilitation and depression in neocortical circuits. Nat Neurosci 1: 279–285, 1998. [DOI] [PubMed] [Google Scholar]
- Reyes and Sakmann 1999.Reyes A, Sakmann B. Developmental switch in the short-term modification of unitary EPSPs evoked in layer 2/3 and layer 5 pyramidal neurons of rat neocortex. J Neurosci 19: 3827–3835, 1999. [DOI] [PMC free article] [PubMed] [Google Scholar]
- Reyes and Fetz 1993.Reyes AD, Fetz EE. Two modes of interspike interval shortening by brief transient depolarizations in cat neocortical neurons. J Neurophysiol 69: 1661–1672, 1993. [DOI] [PubMed] [Google Scholar]
- Smith 1989.Smith WS Synaptic Interactions Between Identified Motor Cortex Neurons in the Active Primate (PhD dissertation). Seattle, WA: Univ. of Washington, 1989.
- Smith and Fetz 2009.Smith WS, Fetz EE. Synaptic linkages between corticomotoneuronal cells affecting forelimb muscles in behaving primates. J Neurophysiol 102: 1066–1074, 2009. [DOI] [PMC free article] [PubMed] [Google Scholar]
- Stefanis and Jasper 1964.Stefanis C, Jasper H. Recurrent collateral inhibition in pyramidal tract neurons. J Neurophysiol 27: 855–877, 1964. [DOI] [PubMed] [Google Scholar]
- Thomson et al. 1993b.Thomson AM, Deuchars J, West DC. Large, deep layer pyramid-pyramid single axon EPSPs in slices of rat motor cortex display paired pulse and frequency-dependent depression, mediated presynaptically and self-facilitation, mediated postsynaptically. J Neurophysiol 70: 2354–2369, 1993b. [DOI] [PubMed] [Google Scholar]
- Thomson et al. 1993a.Thomson AM, Deuchars J, West DC. Single axon excitatory postsynaptic potentials in neocortical interneurons exhibit pronounced paired pulse facilitation. Neuroscience 54: 347–360, 1993a. [DOI] [PubMed] [Google Scholar]
- Thomson and Lamy 2007.Thomson AM, Lamy C. Functional maps of neocortical local circuitry. Front Neurosci 1: 19–42, 2007. [DOI] [PMC free article] [PubMed] [Google Scholar]
- Thomson et al. 2002.Thomson AM, West DC, Wang Y, Bannister AP. Synaptic connections and small circuits involving excitatory and inhibitory neurons in layers 2–5 of adult rat and cat neocortex: triple intracellular recordings and biocytin labelling in vitro. Cereb Cortex 12: 936–953, 2002. [DOI] [PubMed] [Google Scholar]
- Toyama et al. 1981a.Toyama K, Kimura M, Tanaka K. Cross-correlation analysis of interneuronal connectivivty in cat visual cortex. J Neurophysiol 46: 191–201, 1981a. [DOI] [PubMed] [Google Scholar]
- Toyama et al. 1981b.Toyama K, Kimura M, Tanaka K. Organization of cat visual cortex as investigated by cross-correlation technique. J Neurophysiol 46: 202–214, 1981b. [DOI] [PubMed] [Google Scholar]
- T'so et al. 1986.T'so DY, Gilbert CD, Wiesel TN. Relationship between horizontal interactions and functional architecture in cat striate cortex as revealed by cross-correlation analysis. J Neurosci 6: 1160–1170, 1986. [DOI] [PMC free article] [PubMed] [Google Scholar]


