Abstract
Diffusion tensor imaging (DTI) is an exciting new MRI modality that can reveal detailed anatomy of the white matter. DTI also allows us to approximate the 3D trajectories of major white matter bundles. By combining the identified tract coordinates with various types of MR parameter maps, such as T2 and diffusion properties, we can perform tract-specific analysis of these parameters. Unfortunately, 3D tract reconstruction is marred by noise, partial volume effects, and complicated axonal structures. Furthermore, changes in diffusion anisotropy under pathological conditions could alter the results of 3D tract reconstruction. In this study, we created a white matter parcellation atlas based on probabilistic maps of 11 major white matter tracts derived from the DTI data from 28 normal subjects. Using these probabilistic maps, automated tract-specific quantification of fractional anisotropy and mean diffusivity were performed. Excellent correlation was found between the automated and the individual tractography-based results. This tool allows efficient initial screening of the status of multiple white matter tracts.
Introduction
White matter diseases are often characterized by various types of MR abnormalities, including T2-weighted hyperintensity, T1-weighted hypointensity, reduced magnetization transfer ratio (MTR), and, more recently, by decreased diffusion anisotropy or increased diffusivity. For accurate correlation of anatomic abnormalities with neurologic dysfunction, precise characterization of lesion location is of great importance. However, localization of the lesion and quantification of its severity are challenging tasks. This is especially the case for the white matter, which often appears homogeneous in conventional MRI.
Diffusion tensor imaging (DTI) has the potential to improve the localization information of white matter lesions because it can reveal detailed anatomy of the white matter (Douek et al., 1991; Basser et al., 1994; Nakada and Matsuzawa, 1995; Pierpaoli et al., 1996; Makris et al., 1997; Pajevic and Pierpaoli, 1999; Stieltjes et al., 2001; Catani et al., 2002; Mori et al., 2002; Jellison et al., 2004; Wakana et al., 2004; Mori et al., 2005). Based on fiber orientation information obtained from DTI, we can identify the locations of various axonal bundles. By comparing this information with conventional MR parameter maps, we can identify specific white matter tracts that are affected by the lesions. We can extend this approach in a more systematic way by identifying the 3D trajectories of individual white matter tracts using 3D tract reconstruction, or tractography (Conturo et al., 1999; Mori et al., 1999; Basser et al., 2000; Poupon et al., 2000; Parker et al., 2002). Once a tract of interest is defined in three dimensions, we can superimpose its coordinates on MR parameter maps to perform quantitative tract-specific monitoring of pathological conditions (Virta et al., 1999; Xue et al., 1999; Stieltjes et al., 2001; Glenn et al., 2003; Wilson et al., 2003; Partridge et al., 2004; Pagani et al., 2005).
It has been shown that tractography can faithfully reconstruct the cores of prominent white matter tracts by using existing anatomical knowledge as an anatomical constraint (Stieltjes et al., 2001; Catani et al., 2002; Mori et al., 2002; Huang et al., 2004; Jellison et al., 2004). However, the results are sensitive to noise, partial volume effects, and convolution of axonal structures with different orientations within a voxel. Furthermore, diseased brains often have altered DTI parameters that could affect the tractography results. For instance, even if a tract of interest has a normal size and 3D trajectory, tractography may fail to reveal its entire course in the presence of decreased diffusion anisotropy (Fig. 1).
Fig. 1.
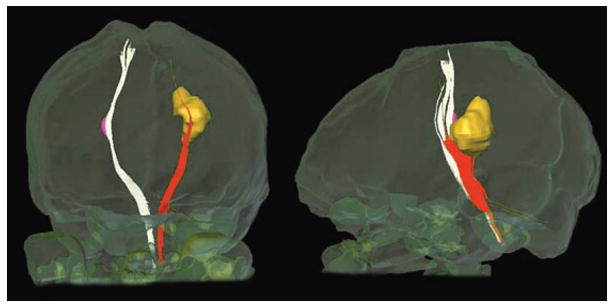
Reconstruction of cortical spinal tract in a multiple sclerosis patient. Lesions with low diffusion anisotropy are indicated by yellow (left hemisphere) and pink (right hemisphere) colors. The corticospinal tract is successfully reconstructed in the right hemisphere but not in the left, making it difficult to measure MR parameters along the corticospinal tract.
In this paper, we describe probabilistic maps of white matter tracts using a DTI database of normal adult subjects. Tractography results were transformed from individuals into a template and group-averaged trajectories were calculated. The purpose is two-fold. First, the population-averaged statistical maps can define the standard coordinates of the reproducible regions (cores) of the tracts. The resultant statistical maps of the normal population can then be used as a reference for abnormal white matter anatomy in neurodegenerative diseases. Second, the statistical template can be applied to individual patient data for automated white matter parcellation and for tract-specific quantification of MR parameters. This would mean that tractography for each individual is no longer necessary and the examination of multiple tracts can be performed automatically. This approach effectively eliminates the necessity to establish tractography protocols (e.g., descriptions to reproducibly define locations and sizes of seeding pixels across subjects) and to measure the reproducibility of the protocol. Although the quality of this template-based brain parcellation is heavily influenced by registration quality, this type of template-based quantification should provide an efficient means of initial assessment of the white matter status.
We performed reconstruction of 11 major white matter tracts using DTI data from 28 normal subjects, based on strict tracking protocols (Wakana et al., 2005), and registered the coordinates into a common template in the DTI-JHU space (lbam.med.jhmi.edu or www.DtiStudio.org) (Wakana et al., 2004) and the MNI-ICBM152 space (www.loni.ucla.edu/ICBM) (Mazziotta et al., 2001). This paper explains the tracking and normalization procedures for our atlas and demonstrates how it can be used to perform lesion-tract correlation studies. The results with the automated approach are then compared with a non-automated method, in which tractography is performed for individual subjects for validation.
Methods
Subjects
Institutional Review Board approval was obtained for the study and written, informed consent, including HIPAA compliance, were obtained from all subjects. Twenty-eight healthy adults (mean 29 ± 7.9 years old; male 17, female 11, all right-handed) participated our study. No subject had a history of neurologic disease. For demonstration of the proposed method, a DTI dataset of a multiple sclerosis (MS) patient (32-year-old man) was used. The patient had a T2-hyperintense lesion in the left corona radiata and suffered weakness of the right arm and leg.
Imaging
A 1.5T MR unit (Gyroscan NT, Philips Medical Systems) was used. DTI data were acquired with a single-shot, echo-planar imaging (EPI) sequence with sensitivity encoding (SENSE), using a parallel-imaging factor of 2.5 (Pruessmann et al., 1999). The imaging matrix was 96 × 96 with a field-of-view of 240 × 240 mm (nominal resolution, 2.5 mm), zero-filled to 256 × 256 pixels. Transverse sections of 2.5 mm thickness were acquired parallel to the anterior commissure-posterior commissure line. A total of 50-55 sections covered the entire hemisphere and brainstem without gaps. Diffusion weighting was encoded along 30 independent orientations (Jones et al., 1999), and the b-value was 700 mm2/s. Five additional images with minimal diffusion weighting (b ≈ 33 mm2/sec) were also acquired. The scanning time per dataset was approximately 6 minutes. To enhance the signal-to-noise ratio, imaging was repeated 3 times (total 18 min).
The data from the MS patient was acquired using a 3.0T MR unit (Philips Medical Systems). The imaging matrix was 112 × 112 with a field of view of 246 × 246 mm (nominal resolution, 2.2 mm), zero-filled to 256 × 256 pixels. Transverse sections of 2.2 mm thickness were acquired parallel to the anterior commissure-posterior commissure line. Other imaging parameters were the same as those for our normal DTI database.
Data processing
The DTI datasets were transferred to a personal computer running a Windows platform and were processed using DtiStudio (http://lbam.med.jhmi.edu or www.DtiStudio.org) (Jiang et al., 2006). Images were first realigned using Automatic Image Registration (Woods et al., 1998) using the first minimally diffusion-weighted image as a template, in order to remove any potential small bulk motion that may have occurred during the scans. The six elements of the diffusion tensor were calculated for each pixel using multivariant linear fitting. After diagonalization, three eigenvalues and eigenvectors were obtained. For the anisotropy map, fractional anisotropy (FA) was used (Pierpaoli and Basser, 1996). The eigenvector associated with the largest eigenvalue was used as an indicator of the fiber orientation. We also created an averaged diffusion-weighted image (aDWI) by adding all of the diffusion-weighted images. This image was used to drive cross-subject image registration.
Fiber tracking and ROI drawing strategy
For the 3D tract reconstruction, the Fiber Assignment by Continuous Tractography (FACT) method (Mori et al., 1999; Xue et al., 1999) was used with a fractional anisotropy threshold of 0.2 and a principal eigenvector turning angle threshold of 40° between two connected pixels. The fiber tracking based on FACT was performed by DtiStudio (Jiang et al., 2006). A multi-ROI approach was used to reconstruct tracts of interest (Conturo et al., 1999; Huang et al., 2004), exploiting existing anatomical knowledge of tract trajectories. Tracking was performed from all pixels inside the brain (the so-called brute-force approach), and fibers penetrating manually defined ROIs were assigned to the specific tracts associated with those ROIs. A description of the tracking protocol is provided in our previous papers (Stieltjes et al., 2001; Mori et al., 2002; Wakana et al., 2004; Wakana et al., 2005) and summarized in Fig. 2. In this study, we reconstructed the following 11 white matter tracts: forceps major (FMa); forceps minor (FMi); anterior thalamic radiation (ATR); cingulum of the cingulate cortex (CgC) and hippocampus (CgH); corticospinal tract (CST); inferior fronto-occipital fasciculus (IFO); inferior longitudinal fasciculus (ILF); superior longitudinal fasciculus (SLF); and uncinate fasciculus (Unc). There were two protocols for the SLF reconstruction – one to reveal trajectories to the frontal, parietal, and temporal lobes, and the other to select only the projections to the temporal lobe (tSLF).
Fig. 2.
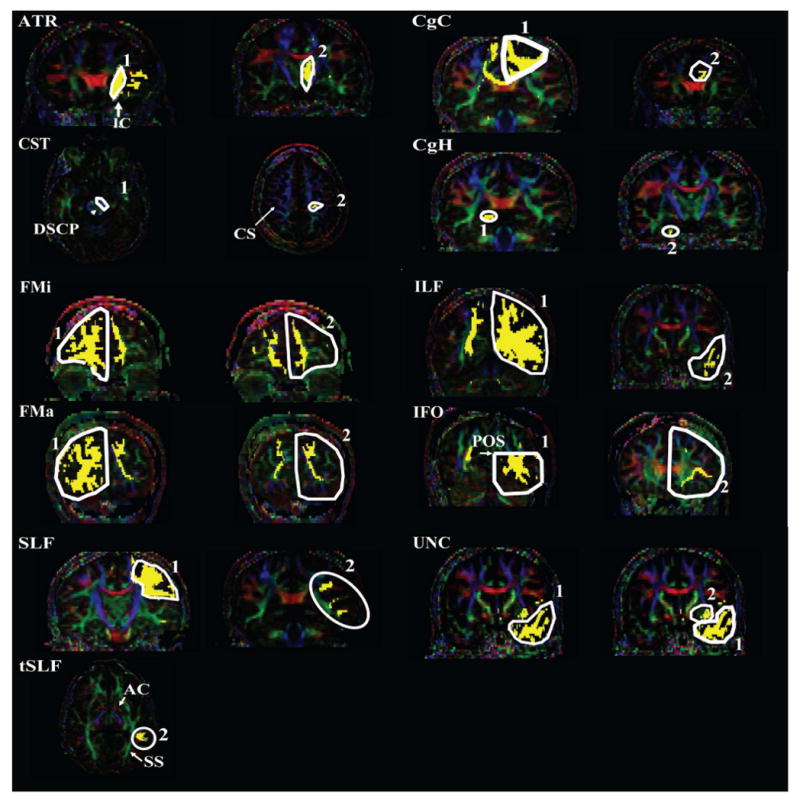
ROI locations used for reconstructions of 11 white matter tracts in this paper. All tracts are reconstructed using a two-ROI approach, as previously published (Wakana et al., 2005). Abbreviations are: ATR: anterior thalamic radiation; CgC: cingulum in the cingulated cortex area; Cgh: cingulum in the hippocampal area; CST: cortitospinal tract; FMa: forceps major; FMi: forceps minor; IFO: inferior fronto-occipital fasciculus; SLF: superior longitudinal fasciculus; tSLF: the temporal projection of the SLF; UNC: uncinate fasciculus; DSCP: decussation of the superior cerebellar peduncle; POS: parieto-occipito sulcus. The tSLF shares the first ROI with SLF.
Tract probabilistic map
Two different templates were used for the spatial normalization: JHU-DTI (Wakana et al., 2004; Mori et al., 2005) and MNI-ICBM152 (http://www.loni.ucla.edu/ICBM/). A twelve-mode affine transformation (Woods et al., 1998) was used to co-register the 28 subjects' DTI images to these templates. For the transformation of each subject into one of the templates, the aDWI was used. The resultant affine transformation matrix was then applied to the subject's fiber tracts to transform them to the template. The binarized masks reporting on tract locations in the standard coordinates were averaged over 28 subjects to generate probabilistic maps, in which each pixel contains information about the probability. The JHU-DTI template and averaged fiber probability maps are available at http://lbam.med.jhmi.edu.
Atlas-based automated parcellation for tract-specific MR parameter quantification
The tract probabilistic maps were used as templates for automated parcellation of the white matter and to quantify MR parameters. First, DTI data, including FA images, were transformed to the template. Then, the probabilistic maps of the white matter tracts were superimposed on the patient data to calculate the FA intensities and Trace/3 (mean diffusivity) using the following equation:
| Equation 1 |
| Equation 2 |
where Pri is the probability of the ith voxel occupied by the reconstructed tract, empirically decided by the number of subjects with the tract occupying the ith voxel divided by the total number of subjects. FAi and Tracei/3 are the FA and Trace/3 values of the ith voxel, respectively.
Comparison with results from individual fiber tracking
The atlas-based automated parcellation method was compared with individual tracking results to evaluate the accuracy of the probabilistic approach. For this purpose, DTI data from 10 normal subjects, which were not included to generate the 28-subject probabilistic maps, were used. For the “individual tracking results,” the tractography protocols in Fig. 2 were applied to the 10 normal data and the FA of each tract was measured. For the FA measurements, the tractography results were first converted to 1/0 binary maps (1: pixels that contained the fiber, 0: pixels that did not contain the fiber) and the maps were applied to FA maps as a masking. In this case, the tract coordinates and FA maps were both from the same subject. For “probabilistic results,” the tract probability maps obtained from the 28-subject data were applied to the 10 normal subjects. For FA measurements, Equation 1 was used. In this case, the tract coordinates and FA maps were from different subjects. Results of these two approaches were then compared by Pearson correlation analysis.
Software for automated tract-specific parcellation
The atlas-based automated parcellation method introduced in this paper was implemented in our DtiStudio:RoiEditor module (lbam.med.jhmi.edu, godzilla.kennedykrieger.org or www.MriStudio.org), which provides a user interface for this automated tract-specific quantification. The software reports the quantification results for the entire pathways or for each image slice in the three orthogonal planes.
Results
Fig. 3 shows the results of probabilistic maps of 11 white matter tracts reconstructed in the template coordinates. These tracts are well-defined at the core with higher probabilities, while they become more dispersed and have lower probabilities as they approach target cortical regions. In Fig. 4, individual and probabilistic methods were compared for the 11 tracts. For each tract, averages and the standard deviations among the subjects are plotted for both methods. The correlation constant for all the tracts is 0.88. The average coefficient of variation (= standard deviation/average) of the individual approach is 5.7% and the probabilistic approach is 8.0% for the 11 tracts, which may suggest a slightly higher precision for the individual approach. The slope is close to unity (0.82), but, for all tracts, the average values for the individual approach are higher, leading to the intercept of 0.14. To evaluate test-retest reproducibility, we scanned the same person three times (more than 24 hours apart for each session) and measured FA of the 11 tracts using the both approaches. The coefficient of variation (standard deviation / average) indicated comparable reproducibility (probabilistic: 1.8 ± 0.9 % vs individual: 2.5 ± 2.0 % for the 11 tracts).
Fig. 3.
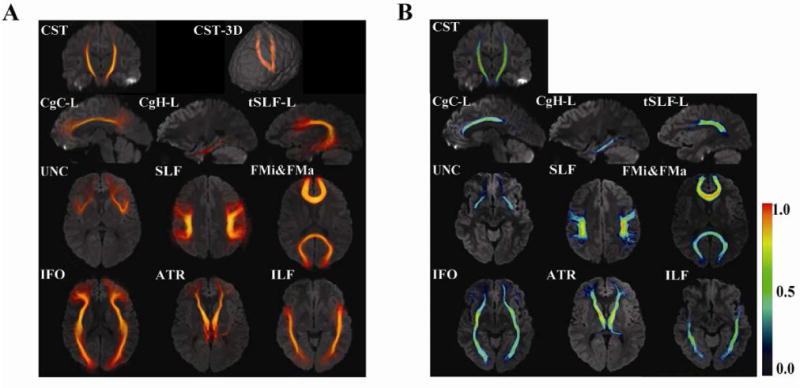
Probabilistic maps of 11 white matter tracts. Results are superimposed on a single-subject JHU template. The 3D volume rendering of the averaged tract (A) and color-scaled probabilistic maps (B) are superimposed on 2D slices. Maximum intensity projection is used for the color intensity in (A). The color in (B) represents probability, as shown in the color bar.
Fig. 4.
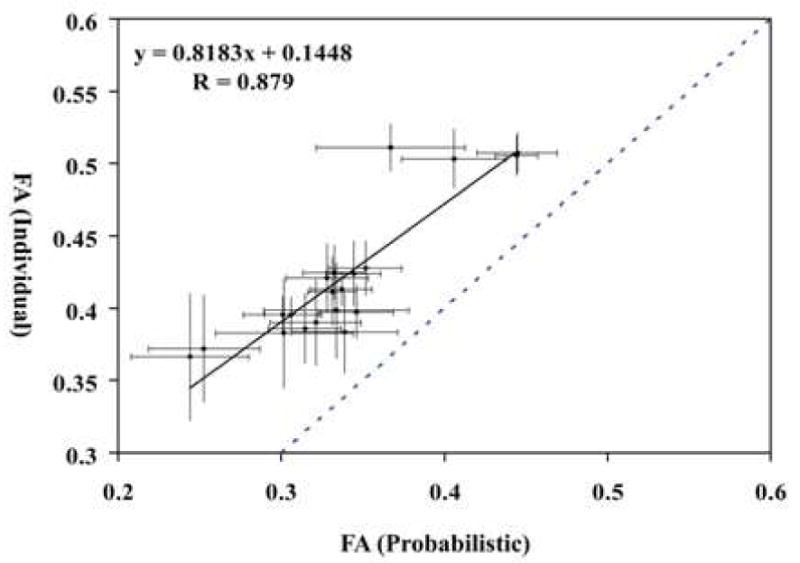
Comparison of individual and probabilistic methods for 11 tracts. Data from the both hemisphere are plotted together. Horizontal axis is FA value measured by probabilistic method and vertical axis is FA value measured by individual method. Dashed line is the identity line. Standard deviations of both methods are also shown.
For the corticospinal tract, the FA values of pixels within an axial slice are measured and plotted slice-by-slice to inspect individual-probabilistic correlations along the tract pathway (Fig. 5A). The correlation is excellent in the core region (midbrain – corona radiata), but deteriorates in peripheral regions (subcortical white matter). The correlation coefficients are 0.94 and 0.92 for the left and right hemisphere (Fig.5B and 5C), respectively, for the entire length in the hemisphere (-8 to 78mm) and 0.99 for the core region (-8 to 52mm). Fig. 6 shows the slice-by-slice correlation of the other 10 tracts (the entire length). The correlation coefficient was at least 0.82, except for UNC and SLF, which do not have enough dispersion in FA values, and all points are clustered in a confined region.
Fig. 5.
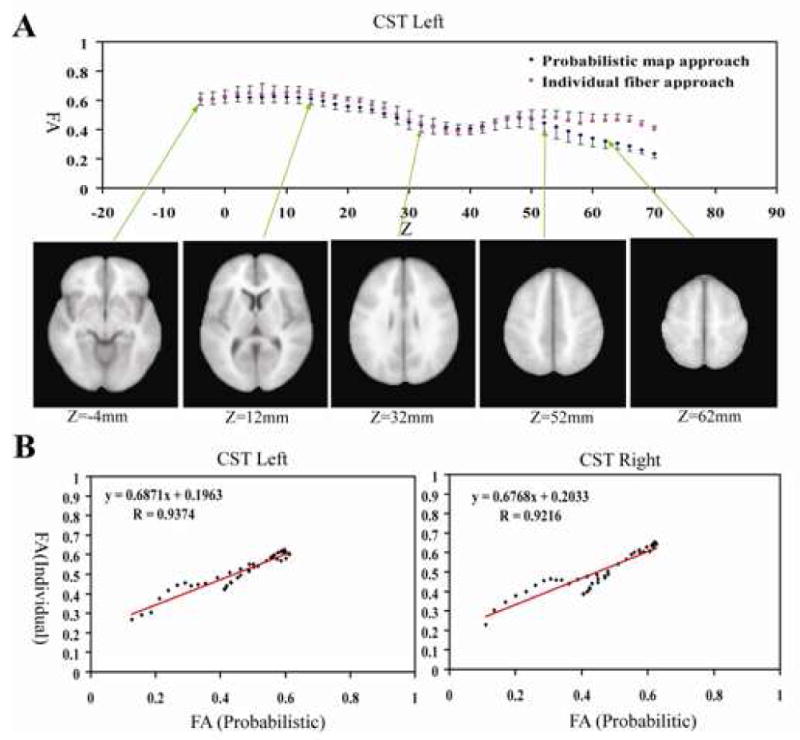
Comparison of FA measurements by individual and probabilistic methods for the corticospinal tract (CST) at each z-coordinate of the MNI template (A), and correlation plots of the left (B) and right (C) CST. Each point in (B) and (C) correspond to data points at each z coordinate. The origin of the z-coordinate (z = 0) is placed on the anterior commissure level. The averages and standard deviations were obtained from the 10 normal subjects.
Fig. 6.
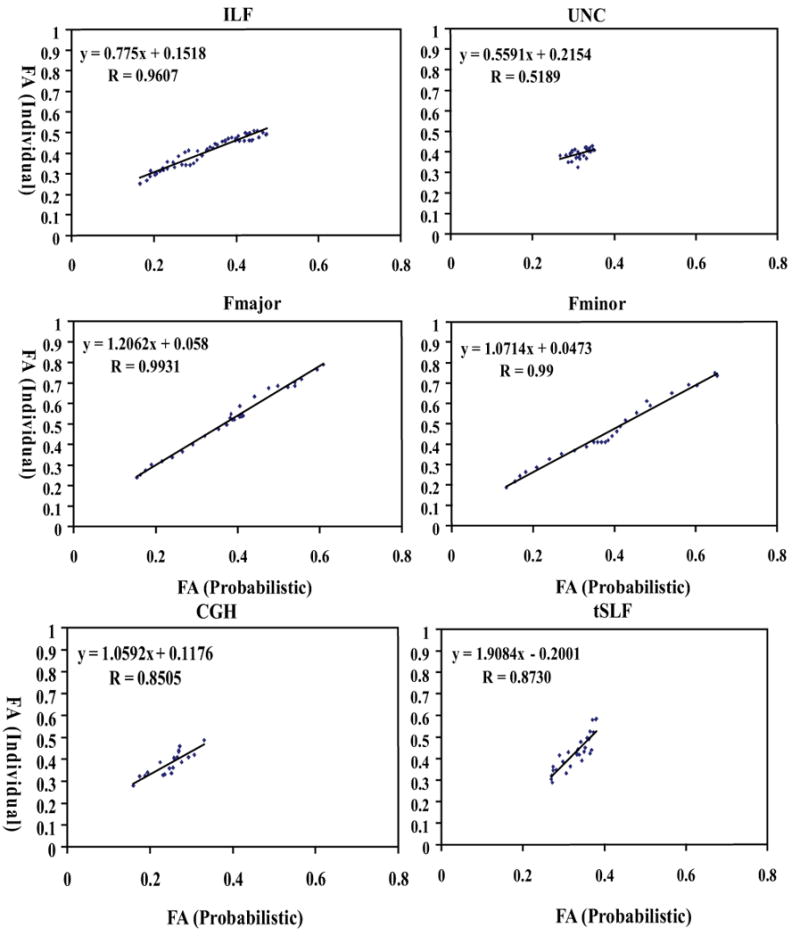
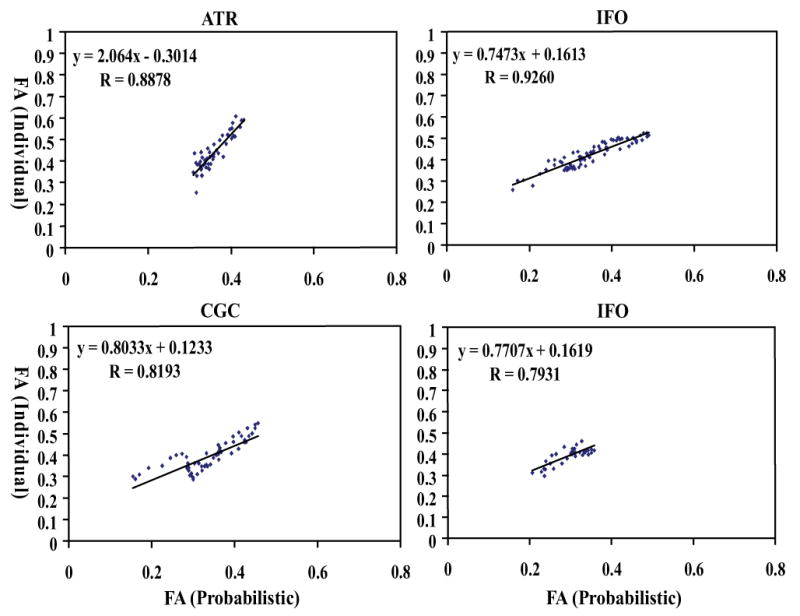
Pearson correlation analysis of probabilistic method (X axis) and individual method (Y axis) for FA measurements of 10 fiber tracts. All the correlation coefficients are greater than 0.82, except for UNC and SLF.
Fig. 7A shows the result of the automated white matter parcellation applied to a patient with relapsing-remitting MS. The probabilistic map of the corticospinal tract is superimposed on the normalized patient brain. The relative positions of the corticospinal tract and the T2-hyperintense lesion are visible in the normalized slice coordinates, z = 32mm - 52 mm. The FA and trace/3 value of the tract at each axial slice level are shown in Fig. 7B. The location and the spatial extent of the lesion along the tract are clearly identifiable. Although the lesion as seen on the trace map is not obvious at z < 24mm, the FA results suggest that the lesion extends beyond z = 12mm toward the midbrain. By visually inspecting these maps at z = 20 mm, this observation can be readily confirmed (Fig. 7C and 7D).
Fig. 7.
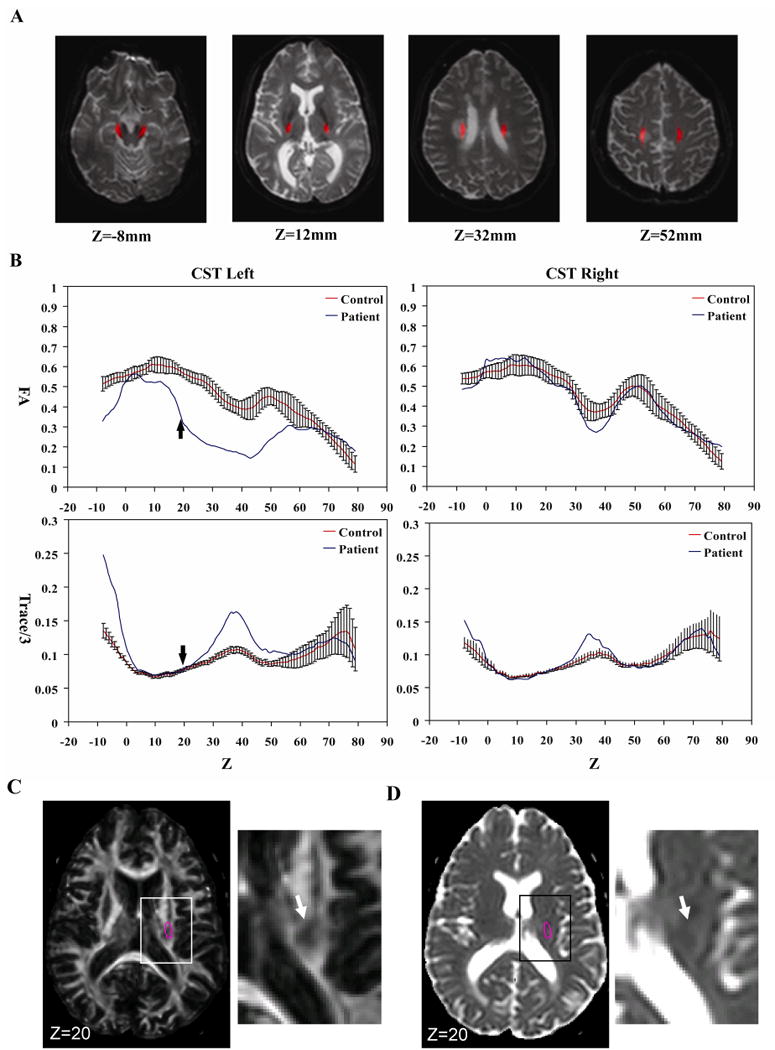
Probabilistic FA quantification of the corticospinal tract (CST) of an MS patient in the MNI coordinates. As shown in Fig. 1, a low FA region in the central semiovale interferes with CST reconstruction in this patient. The probabilistic approach is not influenced by this type of lesion in individuals. The probabilistic CST coordinates are superimposed on the MS patient data (A) and FA and Trace/3 are measured for the left and right hemisphere (B). In (C) and (D), FA and Trace/3 maps of the patient are shown at z = 20 mm (indicated by small arrows in (B)) where abnormality was found only in FA but not in Trace/3. The pink circles in (C) and (D) indicate probabilistic locations of the CST, defined by Pr > 0.2. White arrows indicate an apparent lesion in the FA map.
Discussion
Probabilistic maps of tractography
In this paper, probability maps of tractography results were created from our DTI database of 28 normal subjects. The results are registered to two standard coordinates – JHU-DTI and MNI coordinates – and are available for download from our website. Previously, probabilistic maps of white matter tracts (Mori et al., 2002; Xu et al., 2002; Ciccarelli et al., 2003), or tractography using averaged tensor fields, (Jones et al., 2002) have been reported. This paper proposes to use this approach for white matter parcellation in stereotaxic coordinates and for automated tract-specific quantification.
The validity of tractography has always been a subject of debate. All tracts described in this paper were reconstructed based on existing anatomical knowledge. Through the use of multiple ROIs, the reconstruction is designed to obtain tract trajectories that are faithful to existing anatomic knowledge to the extent possible (Conturo et al., 1999; Huang et al., 2004). The trajectories between the multiple ROIs should reflect the macroscopic architecture of the white matter. One of the well known limitations of DTI-based tractography is that it cannot properly handle crossing fibers within a pixel (Wiegell et al., 2000; Tuch et al., 2003). Tractography also contains errors due to noise and partial volume effects. Although these problems were ameliorated by adopting a multiple ROI approach, tractography results from a single subject could still contain false negatives and false positives, especially in the subcortical white matter regions. In our probabilistic approach, contributions of random errors should have been diminished through the group-averaging process. Nonetheless, it is reasonable to consider that the probabilistic maps contain erroneous white matter regions. Therefore, the obtained coordinates should be treated as an approximation of macroscopic organization of the white matter tracts.
Use of the probabilistic map as an anatomical template
There are two major usages for the tract probability maps. First, the maps can be generated for control and patient groups using the same template space and then can be superimposed. This would highlight and quantify the extent of regions in which tract shape is different. This type of approach could be used as a screening tool to discover sensitive brain regions in which the core of the white matter anatomy is altered. Second, the maps can be used as templates for the parcellation of the white matter and tract-specific monitoring of MR parameters. In the past, tractography results have been used as ROI to perform tract-specific quantification of MR parameters (Virta et al., 1999; Xue et al., 1999; Stieltjes et al., 2001; Glenn et al., 2003; Wilson et al., 2003; Partridge et al., 2004; Berman et al., 2005; Pagani et al., 2005; Jones et al., 2006; Kanaan et al., 2006). The probabilistic approach described in this paper can be considered as an extension of this idea. This probabilistic approach can be used for an MRI dataset without DTI (e.g., tract-specific quantification of T2 and magnetization transfer ratio). If high-quality DTI is available, this probabilistic approach may not be the ideal replacement for individual tractography or manual ROI-based analyses, which should provide better accuracy in localizing tracts of interest in each subject (see Fig. 5 and a recent publication that evaluates the reproducibility of tractography-based measurements (Heiervang et al., 2006)). However, there are two reasons the proposed method is useful. First, it can quickly screen the status of multiple tracts. For example, reporting of the FA of the 11 tracts is automated in DtiStudio:RoiEditor and takes less than 5 min. If any changes in patient populations are suspected in one of these tracts, it could efficiently direct the more time-consuming analyses to such regions. Second, when patients exhibit significant changes in pixel intensities, such as decreased FA, the results from the probability-based and individual-based methods may have significant differences, which would provide a new dimension in interpreting the status of the patient. This point is demonstrated in Figs. 1 and 8, in which the severe loss of FA prevented tract reconstruction.
Fig. 8.
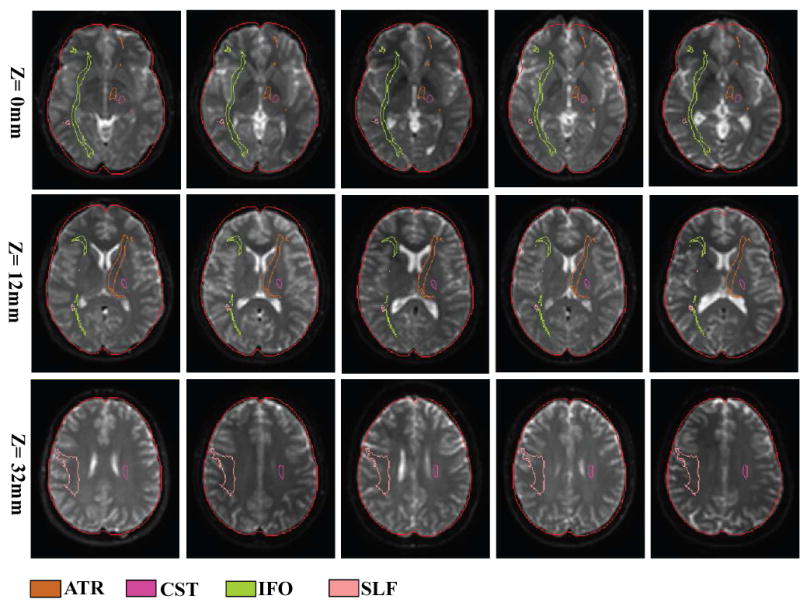
Normalized images of subject #1, 3, 5, 7, 9 used in Fig. 4 – 6 to demonstrate registration quality. Three axial slices at z = 0, 12, and 32 are shown, which reveal the probabilistic locations of the IFO (green), the SLF (peach), the ATR (orange), and the CST (pink). The outer boundary defines the shape of the ICBM-152 template.
In the probabilistic approach, pixels that belong to core regions of tracts, which are reproducible in the normal population, have larger weighting for tract-specific quantification based on Equation 1. The less reproducible regions are mostly at peripheral regions close to the cortex (Fig. 3B) and the quantification results are less accurate as seen in Fig. 5. Although these regions have lower weighting in Equation 1, their contributions to the tract-specific FA and Trace quantification (e.g. Fig. 4) could be non-negligible. This issue can be ameliorated by measuring slice-by-slice values, spatially separating the core and peripheral regions as shown in Fig. 5 and 7. In this paper, we used simple probability-weighted averages for FA and Trace quantification (Equation 1 and 2). Several causes of inaccuracies in the probabilistic approach, such as inclusion of the gray matter and CSF, could be reduced by employing more elaborated methods such as histogram and outlier rejection.
One limitation of the atlas-based method is that the result depends on the quality of registration. The registration quality affects the analysis at two levels: (1) generation of the probabilistic map; and (2) application of the map to individual cases. In this study, we used a 12-mode affine transformation, which cannot remove non-linear differences. This leads to less-than-perfect anatomical registration in the resultant probabilistic maps. To demonstrate quality of the registration, the brain contour of the ICBM-152 and locations of several probabilistic tract maps are superimposed on the 5 normal subjects used in this study after affine transformation and shown in Fig. 8. To test the accuracy of the probabilistic approach, we compared individual and probabilistic results using the 10 normal subjects. We found excellent correlation between the two methods, but the probabilistic approach tended to yield a lower FA, mostly attributable to the peripheral white matter regions. This is understandable because slight misregistration in the subcortical areas leads to inclusion of the cortex or even CSF. Interpretation of the absolute FA values from the probabilistic approach, thus, requires great care.
In our demonstration (Fig. 7), abnormally low FA and high Trace/3 are found in the midbrain region (z < 0 mm), which is beyond the normal range of variation. Close inspection of the tract coordinates reveals that the probabilistic tract coordinates are not well registered to the normalized patient brain in the midbrain area because the patient has a noticeably smaller midbrain, which leads to partial inclusion of CSF. In this case, it is anatomical change, but not the actual FA or Trace changes, that caused the abnormal values in the midbrain regions of Fig. 7. This is a good example that both anatomical (z = -4 – 0 mm) and intensity abnormalities (z = 10 – 50 mm) would be detected by similar intensity changes in this type of normalization-based approach; we cannot immediately conclude changes are due to intensity or anatomical abnormality based solely on intensity change. Similarly, care must be taken when the probabilistic maps from an adult population are applied to pediatric or aged populations. Because different age groups are likely to have consistent anatomical differences, results of the probabilistic approach would be affected not only by real intensity changes such as decreased FA but also anatomical differences. This is an important limitation of this approach and, thus, our probabilistic maps should be used as an initial screening tool rather than for definitive conclusions. In other words, the role of this automated method is to bring our attention to areas with probable abnormalities. When an abnormal region is found, careful inspections and further analyses, such as manual ROI drawing or anatomical examinations, should follow (e.g. see Fig. 7D and 7E). In the future, adoption of non-linear transformation to improve registration quality (thus minimizing the contributions of anatomical differences) will be an important research effort.
Another important limitation of the proposed approach is that our current atlas contains only selected white matter tracts. The 11 tracts were selected based on reproducibility measurements we performed prior to this study (Wakana et al., 2005). There could be many other important tracts for which we could not establish reproducible tracking protocols. Once the imaging resolution and SNR of DTI data improve, we expect that statistical maps of more tracts will be added to the atlas.
Conclusion
In this paper, we introduced a human brain white matter parcellation atlas based on probabilistic tract maps. We generated probabilistic maps of 11 major white matter tracts in two different templates. The probabilistic coordinates were superimposed on FA and Trace maps of normal subjects for automated quantification of these parameters on a tract-by-tract basis. There was an excellent correlation between the probabilistic and individual tractography approaches. The data from an MS patient was used as an example to demonstrate how the atlas could be used to detect tract-specific abnormalities. The proposed method is an effective approach to initial evaluation of the status of major white matter tracts.
Acknowledgments
This study was supported by NIH grants RO1 AG20012, PO1 EB001955, and P41 R15241 and NMSS TR-3760-A-3. Dr. van Zijl is a paid lecturer for Philips Medical Systems. This arrangement has been approved by Johns Hopkins University in accordance with its conflict of interest policies.
Footnotes
Publisher's Disclaimer: This is a PDF file of an unedited manuscript that has been accepted for publication. As a service to our customers we are providing this early version of the manuscript. The manuscript will undergo copyediting, typesetting, and review of the resulting proof before it is published in its final citable form. Please note that during the production process errors may be discovered which could affect the content, and all legal disclaimers that apply to the journal pertain.
References
- Basser PJ, Mattiello J, Le Bihan D. MR diffusion tensor spectroscopy and imaging. Biophys J. 1994;66:259–267. doi: 10.1016/S0006-3495(94)80775-1. [DOI] [PMC free article] [PubMed] [Google Scholar]
- Basser PJ, Pajevic S, Pierpaoli C, Duda J, Aldroubi A. In vitro fiber tractography using DT-MRI data. Magn Reson Med. 2000;44:625–632. doi: 10.1002/1522-2594(200010)44:4<625::aid-mrm17>3.0.co;2-o. [DOI] [PubMed] [Google Scholar]
- Berman JI, Mukherjee P, Partridge SC, Miller SP, Ferriero DM, Barkovich AJ, Vigneron DB, Henry RG. Quantitative diffusion tensor MRI fiber tractography of sensorimotor white matter development in premature infants. NeuroImage. 2005;27:862–871. doi: 10.1016/j.neuroimage.2005.05.018. [DOI] [PubMed] [Google Scholar]
- Catani M, Howard RJ, Pajevic S, Jones DK. Virtual in vivo interactive dissection of white matter fasciculi in the human brain. NeuroImage. 2002;17:77–94. doi: 10.1006/nimg.2002.1136. [DOI] [PubMed] [Google Scholar]
- Ciccarelli O, Toosy AT, Parker GJ, Wheeler-Kingshott CA, Barker GJ, Miller DH, Thompson AJ. Diffusion tractography based group mapping of major white-matter pathways in the human brain. NeuroImage. 2003;19:1545–1555. doi: 10.1016/s1053-8119(03)00190-3. [DOI] [PubMed] [Google Scholar]
- Conturo TE, Lori NF, Cull TS, Akbudak E, Snyder AZ, Shimony JS, McKinstry RC, Burton H, Raichle ME. Tracking neuronal fiber pathways in the living human brain. Proc Natl Acad Sci USA. 1999;96:10422–10427. doi: 10.1073/pnas.96.18.10422. [DOI] [PMC free article] [PubMed] [Google Scholar]
- Douek P, T R, Pekar J, Patronas N, Le Bihan D. MR color mapping of myelin fiber orientation. J Comput Assist Tomogr. 1991;15:923–929. doi: 10.1097/00004728-199111000-00003. [DOI] [PubMed] [Google Scholar]
- Glenn OA, Henry RG, Berman JI, Chang PC, Miller SP, Vigneron DB, Barkovich AJ. DTI-based three-dimensional tractography detects differences in the pyramidal tracts of infants and children with congenital hemiparesis. J Magn Reson Imaging. 2003;18:641–648. doi: 10.1002/jmri.10420. [DOI] [PubMed] [Google Scholar]
- Heiervang E, Behrens TE, Mackay CE, Robson MD, Johansen-Berg H. Between session reproducibility and between subject variability of diffusion MR and tractography measure. NeuroImage. 2006;33:867–877. doi: 10.1016/j.neuroimage.2006.07.037. [DOI] [PubMed] [Google Scholar]
- Huang H, Zhang J, van Zijl PC, Mori S. Analysis of noise effects on DTI-based tractography using the brute-force and multi-ROI approach. Magn Reson Med. 2004;52:559–565. doi: 10.1002/mrm.20147. [DOI] [PubMed] [Google Scholar]
- Jellison BJ, Field AS, Medow J, Lazar M, Salamat MS, Alexander AL. Diffusion tensor imaging of cerebral white matter: a pictorial review of physics, fiber tract anatomy, and tumor imaging patterns. AJNR Am J Neuroradiol. 2004;25:356–369. [PMC free article] [PubMed] [Google Scholar]
- Jiang H, van Zijl PC, K J, Pearlson GD, Mori S. DtiStudio: resource program for diffusion tensor computation and fiber bundle tracking. Comput Methods Programs Biomed. 2006;81:106–116. doi: 10.1016/j.cmpb.2005.08.004. [DOI] [PubMed] [Google Scholar]
- Jones DK, Catani M, Pierpaoli C, Reeves SJ, Shergill SS, O'Sullivan M, Golesworthy P, McGuire P, Horsfield MA, Simmons A, Williams SC, Howard RJ. Age effects on diffusion tensor magnetic resonance imaging tractography measures of frontal cortex connections in schizophrenia. Hum Brain Mapp. 2006;27:230–238. doi: 10.1002/hbm.20179. [DOI] [PMC free article] [PubMed] [Google Scholar]
- Jones DK, Griffin LD, Alexander DC, Catani M, Horsfield MA, Howard R, Williams SC. Spatial normalization and averaging of diffusion tensor MRI data sets. NeuroImage. 2002;17:592–617. [PubMed] [Google Scholar]
- Jones DK, Horsfield MA, Simmons A. Optimal strategies for measuring diffusion in anisotropic systems by magnetic resonance imaging. Magn Reson Med. 1999;42:515–525. [PubMed] [Google Scholar]
- Kanaan RA, Shergill SS, Barker GJ, Catani M, Ng VW, Howard R, McGuire PK, Jones DK. Tract-specific anisotropy measurements in diffusion tensor imaging. Psychiatry Res. 2006;146:73–82. doi: 10.1016/j.pscychresns.2005.11.002. [DOI] [PubMed] [Google Scholar]
- Makris N, Worth AJ, Sorensen AG, Papadimitriou GM, Reese TG, Wedeen VJ, Davis TL, Stakes JW, Caviness VS, Kaplan E, Rosen BR, Pandya DN, Kennedy DN. Morphometry of in vivo human white matter association pathways with diffusion weighted magnetic resonance imaging. Ann Neurol. 1997;42:951–962. doi: 10.1002/ana.410420617. [DOI] [PubMed] [Google Scholar]
- Mazziotta J, Toga A, Evans A, Fox P, Lancaster J, Zilles K, Woods R, Paus T, Simpson G, Pike B, Holmes C, Collins L, Thompson P, MacDonald D, Iacoboni M, Schormann T, Amunts K, Palomero-Gallagher N, Geyer S, Parsons L, Narr K, Kabani N, Le Goualher G, Boomsma D, Cannon T, Kawashima R, Mazoyer B. A probabilistic atlas and reference system for the human brain: International Consortium for Brain Mapping (ICBM) Philos Trans R Soc Lond B Biol Sci. 2001;356:1293–1322. doi: 10.1098/rstb.2001.0915. [DOI] [PMC free article] [PubMed] [Google Scholar]
- Mori S, Crain BJ, Chacko VP, van Zijl PCM. Three dimensional tracking of axonal projections in the brain by magnetic resonance imaging. Annal Neurol. 1999;45:265–269. doi: 10.1002/1531-8249(199902)45:2<265::aid-ana21>3.0.co;2-3. [DOI] [PubMed] [Google Scholar]
- Mori S, Kaufmann WE, Davatzikos C, Stieltjes B, Amodei L, Fredericksen K, Pearlson GD, Melhem ER, Solaiyappan M, Raymond GV, Moser HW, van Zijl PC. Imaging cortical association tracts in the human brain using diffusion-tensor-based axonal tracking. Magn Reson Med. 2002;47:215–223. doi: 10.1002/mrm.10074. [DOI] [PubMed] [Google Scholar]
- Mori S, Wakana S, Nagae-Poetscher LM, van Zijl PC. MRI atlas of human white matter. Elsevier; Amsterdam, The Netherlands: 2005. [Google Scholar]
- Nakada T, Matsuzawa H. Three-dimensional anisotropy contrast magnetic resonance imaging of the rat nervous system: MR axonography. Neurosc Res. 1995;22:389–398. doi: 10.1016/0168-0102(95)00917-i. [DOI] [PubMed] [Google Scholar]
- Pagani E, Filippi M, Rocca MA, Horsfield MA. A method for obtaining tract-specific diffusion tensor MRI measurements in the presence of disease: application to patients with clinically isolated syndromes suggestive of multiple sclerosis. NeuroImage. 2005;26:258–265. doi: 10.1016/j.neuroimage.2005.01.008. [DOI] [PubMed] [Google Scholar]
- Pajevic S, Pierpaoli C. Color schemes to represent the orientation of anisotropic tissues from diffusion tensor data: application to white matter fiber tract mapping in the human brain. Magn Reson Med. 1999;42:526–540. [PubMed] [Google Scholar]
- Parker GJ, Stephan KE, Barker GJ, Rowe JB, MacManus DG, Wheeler-Kingshott CA, Ciccarelli O, Passingham RE, Spinks RL, Lemon RN, Turner R. Initial demonstration of in vivo tracing of axonal projections in the macaque brain and comparison with the human brain using diffusion tensor imaging and fast marching tractography. NeuroImage. 2002;15:797–809. doi: 10.1006/nimg.2001.0994. [DOI] [PubMed] [Google Scholar]
- Partridge SC, Mukherjee P, Henry RG, Miller SP, Berman JI, Jin H, Lu Y, Glenn OA, Ferriero DM, Barkovich AJ, Vigneron DB. Diffusion tensor imaging: serial quantitation of white matter tract maturity in premature newborns. NeuroImage. 2004;22:1302–1314. doi: 10.1016/j.neuroimage.2004.02.038. [DOI] [PubMed] [Google Scholar]
- Pierpaoli C, Basser PJ. Toward a quantitative assessment of diffusion anisotropy. Magn Reson Med. 1996;36:893–906. doi: 10.1002/mrm.1910360612. [DOI] [PubMed] [Google Scholar]
- Pierpaoli C, Jezzard P, Basser PJ, Barnett A, Di Chiro G. Diffusion tensor MR imaging of human brain. Radiology. 1996;201:637–648. doi: 10.1148/radiology.201.3.8939209. [DOI] [PubMed] [Google Scholar]
- Poupon C, Clark CA, Frouin V, Regis J, Bloch L, Le Bihan D, Mangin JF. Regularization of diffusion-based direction maps for the tracking of brain white matter fascicules. NeuroImage. 2000;12:184–195. doi: 10.1006/nimg.2000.0607. [DOI] [PubMed] [Google Scholar]
- Pruessmann KP, Weiger M, Scheidegger MB, Boesiger P. SENSE: sensitivity encoding for fast MRI. Magn Reson Med. 1999;42:952–962. [PubMed] [Google Scholar]
- Stieltjes B, Kaufmann WE, van Zijl PCM, Fredericksen K, Pearlson GD, Mori S. Diffusion tensor imaging and axonal tracking in the human brainstem. NeuroImage. 2001;14:723–735. doi: 10.1006/nimg.2001.0861. [DOI] [PubMed] [Google Scholar]
- Tuch DS, Reese TG, Wiegell MR, Wedeen VJ. Diffusion MRI of complex neural architecture. Neuron. 2003;40:885–895. doi: 10.1016/s0896-6273(03)00758-x. [DOI] [PubMed] [Google Scholar]
- Virta A, Barnett A, Pierpaoli C. Visualizing and characterizing white matter fiber structure and architecture in the human pyramidal tract using diffusion tensor MRI. Magn Reson Imaging. 1999;17:1121–1133. doi: 10.1016/s0730-725x(99)00048-x. [DOI] [PubMed] [Google Scholar]
- Wakana S, Jiang H, Hua K, Zhang J, Dubey P, Blite A, van Zijl PC, Mori S. Reproducible protocol for human white matter fiber tracking and quantitative analysis of their status. International Society of Magnetic Resonance in Medicine; Miami: 2005. [Google Scholar]
- Wakana S, Jiang H, Nagae-Poetscher LM, Van Zijl PC, Mori S. Fiber Tract-based Atlas of Human White Matter Anatomy. Radiology. 2004;230:77–87. doi: 10.1148/radiol.2301021640. [DOI] [PubMed] [Google Scholar]
- Wiegell M, Larsson H, Wedeen V. Fiber crossing in human brain depicted with diffusion tensor MR imaging. Radiology. 2000;217:897–903. doi: 10.1148/radiology.217.3.r00nv43897. [DOI] [PubMed] [Google Scholar]
- Wilson M, Tench CR, Morgan PS, Blumhardt LD. Pyramidal tract mapping by diffusion tensor magnetic resonance imaging in multiple sclerosis: improving correlations with disability. J Neurol Neurosurg Psychiatry. 2003;74:203–207. doi: 10.1136/jnnp.74.2.203. [DOI] [PMC free article] [PubMed] [Google Scholar]
- Woods RP, Grafton ST, Holmes CJ, Cherry SR, Mazziotta JC. Automated image registration: I. General methods and intrasubject, intramodality validation. J Comput Assist Tomogr. 1998;22:139–152. doi: 10.1097/00004728-199801000-00027. [DOI] [PubMed] [Google Scholar]
- Xu D, Mori S, Solaiyappan M, van Zijl PC, Davatzikos C. A framework for callosal fiber distribution analysis. NeuroImage. 2002;17:1131–1143. doi: 10.1006/nimg.2002.1285. [DOI] [PubMed] [Google Scholar]
- Xue R, van Zijl PCM, Crain BJ, Solaiyappan M, Mori S. In vivo three-dimensional reconstruction of rat brain axonal projections by diffusion tensor imaging. Magn Reson Med. 1999;42:1123–1127. doi: 10.1002/(sici)1522-2594(199912)42:6<1123::aid-mrm17>3.0.co;2-h. [DOI] [PubMed] [Google Scholar]


