

Abstract
Early dietary sodium restriction has profound influences on the organization of the gustatory brainstem. However, the anatomical relationships among multiple gustatory nerve inputs have not been examined. Through the use of a triple fluorescence labeling procedure and confocal laser microscopy, terminal fields of the greater superficial petrosal (GSP), chorda tympani (CT), and glossopharyngeal (IX) nerves were visualized concurrently in the nucleus of the solitary tract (NTS) of developmentally sodium-restricted and control rats. Dietary sodium restriction during pre- and postnatal development resulted in a two-fold increase in the volume of both the CT and IX nerve terminal fields, but did not affect the volume of the GSP terminal field. In controls, these nerve terminal fields overlapped considerably with each other. The dietary manipulation significantly increased the overlapping zones among terminal fields, resulting in an extension of CT and IX fields past their normal boundaries. The differences in terminal field volumes were exaggerated when expressed relative to the respective NTS volumes. Further, increased terminal field volumes could not be attributed to an increase in the number of afferents because ganglion cell counts did not differ between groups. Taken together, selective increases in terminal field volume and ensuing overlap among terminal fields suggest an increased convergence of these gustatory nerve terminals onto neurons in the NTS. The genesis of such convergence is likely related to disruption of cellular and molecular mechanisms during the development of individual terminal fields, the consequences of which have implications for corresponding functional and behavioral alterations.
Keywords: brainstem nuclei, primary afferents, taste, confocal laser microscopy, sodium, diet
INTRODUCTION
Neural plasticity has been widely studied as a way to not only examine the brain’s compensatory strategies, but to also characterize normal developmental processes. Some of the most dramatic and widely cited examples of neural plasticity involve higher-order cortical processing and associated circuitry in sensory systems (Hubel and Weisel, 1970; Henderson et al., 1992; Buonomano and Merzenich, 1998; Catalano and Shatz, 1998; Rauschecker, 1999; Fox et al., 2002; Katz and Crowley, 2002; Yan, 2003). However, unlike other systems, the gustatory system shows a remarkable amount of developmental plasticity at the first synaptic relay in the brainstem, in the nucleus of the solitary tract (NTS).
Much of the research in the developing gustatory NTS has focused on the unique plasticity of chorda tympani (CT) nerve terminations in response to early environmental manipulations (Lasiter and Kachele, 1990; King and Hill, 1991; Lasiter and Diaz, 1992; Lasiter, 1995; Krimm and Hill, 1997; Pittman and Contreras, 2002). In rats fed a low sodium diet (0.03% NaCl) from at least E3–E12, the dorsal most portion of the CT field expands caudally, exceeding twice the size of controls (King and Hill, 1991; Krimm and Hill, 1997). The morphological alterations in the CT terminal field are permanent in that the effects are not reversible by age or by sodium repletion. In fact, feeding a sodium replete diet at adulthood to developmentally sodium-restricted rats exaggerates the effects (King and Hill, 1991). This phenomenon, brought about by dietary sodium manipulation, appears selective to the CT field and does not affect other gustatory nerve terminal fields (e.g., the glossopharyngeal (IX) and greater superficial petrosal (GSP) nerves, King and Hill, 1991; Sollars and Hill, 2000).
While previous tract tracing studies of gustatory projections to the NTS have provided the foundation for an understanding of the gross organization of gustatory terminations (Contreras et al., 1982; Hamilton and Norgren, 1984; Lasiter et al., 1989; Lasiter, 1992), the detailed organization of multiple gustatory terminal fields have not been examined simultaneously in a single animal. Of the tract tracing studies previously published, at most two tracers have been used in an individual animal to identify terminal fields. Previous experiments have either labeled the facial (VII) nerve (Lasiter et al., 1995), which is composed of both CT and GSP, or individual gustatory nerves were labeled on opposing sides of the animal (Hamilton and Norgren, 1984). Furthermore, these studies have either not been performed in living animals or they used horseradish peroxidase, both of which compromise the fidelity of the terminal field label. Finally, terminal fields were observed and reconstructed using transmitted light microscopy and not confocal laser microscopy. Therefore, it is difficult to precisely identify and measure the zones of overlapping fields.
In order to fully explore the plasticity of gustatory terminal fields in the brainstem, we developed a triple fluorescent labeling technique that could be used with confocal laser microscopy. The present study used these techniques to uncover unexpected and dramatic relationships among three gustatory terminal fields in developmentally sodium-restricted and control rats.
MATERIALS AND METHODS
All animal procedures were done in accordance with NIH guidelines for humane handling of animals, and all protocols were approved by the Institutional Animal Care Committee at the University of Virginia.
Animals
Eighteen adult (50–60 days old), female Sprague-Dawley rats (Harlan, Indianapolis, Indiana) maintained on either a control (n=9) or sodium-restricted (n=9) diet were used to simultaneously visualize the three gustatory terminal fields in the NTS. Sodium restriction was established by feeding pregnant rats a 0.03% NaCl diet (ICN Biomedicals, Aurora, OH) and distilled water ad libitum from three days postconception through weaning at 21 days postnatal. Once pups born to these mothers were weaned, they were maintained on the same dietary regimen through adulthood. Control rats were the offspring of dams maintained on the standard 1% NaCl rat chow and tap water ad libitum. Control pups were then weaned to the standard diet at 21 days postnatal.
Triple Fluorescent Anterograde Labeling
In order to examine the arrangement of the gustatory terminal fields within the NTS, the CT, GSP, and IX nerves projecting to the right NTS were consecutively labeled with one of three anterograde neural tracers (Fig. 1). Rats were anesthetized with a 100 mg/kg injection of ketamine, i. m. Supplementary injections were given as needed, and body temperature was maintained at 36°C using a water-circulating heating pad. Upon placement in a non-traumatic head holder (Erickson, 1966), a ventral approach, modified from Sollars and Hill (2000), was taken to expose the GSP and CT nerves in the right tympanic bulla. A longitudinal incision in the ventro-medial portion of the neck was made and the masseter muscle and the posterior belly of the digastricus muscle were retracted. A small hole was made in the ventral aspect of the tympanic bulla to gain access to the CT and the GSP. First the GSP and then the CT nerve was cut and labeled near the geniculate ganglia. After a brief application (approximately 20 seconds) of dimethyl sulfoxide (DMSO), crystals of 3 kD biotinylated dextran amine (Molecular Probes, Inc., Eugene, OR) and 3 kD tetramethylrhodamine dextran amine (Molecular Probes) were carefully placed on the proximal cut ends of the GSP and CT, respectively (Fig. 1). Petroleum jelly was applied over the cut ends of each nerve to hold dye crystals in place, and a piece of parafilm was placed over the opening created in the tympanic bulla. Next, the IX nerve was approached in the ventral side of the neck medial to the tympanic bulla. The nerve was cut and the proximal stump was teased onto a section of parafilm. Crystals of 3 kD cascade blue dextran amine (Molecular Probes) were applied to the proximal cut end after a short application of DMSO (Fig. 1). Petroleum jelly and a layer of parafilm were placed on top of the nerve to secure dye placement. Care was taken to ensure that other nerves in the vicinity (e.g., superior laryngeal nerve – branch of the vagus) were not inadvertently cut and labeled. The incision was then sutured, and the rat remained on the heating pad until it recovered from the anesthetic. The optimal time for transport of the three neural tracers was determined through pilot data to be approximately 24 hours. Rats were sacrificed after 24 hours and were perfused transcardially with Krebs (pH 7.3) followed by 8% paraformaldehyde (pH 7.0).
Figure 1.
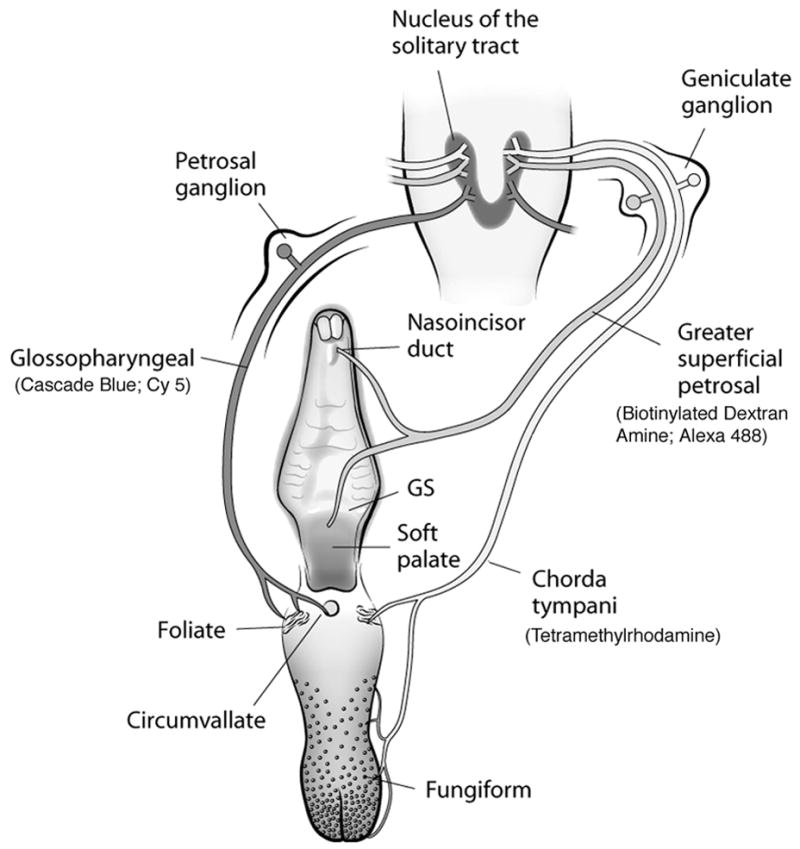
The anatomical organization of the peripheral gustatory system and the first central synaptic relay in the nucleus of the solitary tract (NTS). The chorda tympani (CT) nerve innervates taste buds in fungiform and foliate papillae on the anterior tongue. The greater superficial petrosal (GSP) nerve innervates taste buds in the nasoincisor duct, the geschmacksstreifen (GS), and the soft palate. Both nerves comprise the VIIth cranial nerve and have cell bodies in the geniculate ganglia. The glossopharyngeal (IX) nerve innervates taste buds in foliate and circumvallate papillae on the posterior tongue, and has cell bodies in the petrosal ganglia. All three nerves terminate bilaterally in the NTS; the glossopharyngeal nerve is shown on the left side only for illustrative purposes. The respective fluorescent markers used to detect each terminal field are noted in parentheses. See methods for a detailed description.
Tissue preparation
Brains were removed and postfixed in 8% paraformaldehyde overnight. After removal of the cerebellum, the medulla was blocked and sectioned on a vibratome horizontally at 50 μm through the entire NTS. This allowed visualization of the entire rostral-caudal and medial-lateral extent of the terminal fields (Davis, 1988; Whitehead, 1988; Lasiter et al., 1989). Tissue sections were collected in 0.1 mM phosphate buffered saline (PBS; pH 7.4) and remained free floating at room temperature throughout the remainder of the tissue preparation. Sections were incubated for 1 hour in 0.2% Triton X in PBS with a mixture of streptavidin alexa fluor 488 (Molecular Probes) at 1:500 to visualize GSP terminals labeled with biotinylated dextran amine and rabbit anti-cascade blue (Molecular Probes) at 1:500 to ultimately enable visualization of IX terminals labeled with cascade blue (Fig. 1). Sections were rinsed in PBS and subsequently incubated for 30 minutes in 0.2% Triton X and goat anti-rabbit Cy5 (Jackson ImmunoResearch Laboratories, Inc., West Grove, PA) at 1:500 to visualize IX terminals (Fig. 1). Sections were rinsed again in PBS and stored at 4° C until imaged. These fluorescent dyes were selected specifically for their particular excitation/emission wavelengths to avoid crossover of visible fluorescence. That is, each fluorochrome used had a distinct enough range of excitation that did not overlap significantly with the emission curves of the other two dyes, allowing visualization of each field with a confocal laser microscope system.
Confocal Microscopy and Data Collection
Terminal fields were imaged using an Olympus IX70 microscope fitted with a Fluoview 3.3 confocal laser scanning system (Olympus America Inc., Melville, NY) equipped with an argon-ion laser (488 nm; used to visualize the GSP terminal field), a helium-neon laser (543 nm; used to visualize the CT terminal field), and a helium-neon laser (633 nm; used to visualize the IX terminal field; Fig. 1). Each 50 μm section containing terminal field label was mounted between coverslips with a 9:1 mixture of glycerol and PBS, and optical images were captured every 3 μm for a total of approximately 17 images per section. Initially, for each 50 μm physical section, the GSP and CT fields were imaged with sequential passes of the blue (argon-ion laser) and green (helium-neon; 543 nm) lasers and collected as separate channels (Fig. 2A, B, D, E). Then, using the same parameters set for the initial scan, the IX field was imaged with the red laser (helium-neon; 633 nm) and saved as a third channel (Fig. 2C, F). Finally, using FluoView, all three channels were merged to create a composite view (Fig. 3).
Figure 2.

Fluorescent photomicrographs of separated channels of the GSP (green: A, D), CT (red: B, E), and IX (blue: C, F) terminal fields in the dorsal zone of NTS (perimeter marked by dotted line) in control (A–C) and sodium-restricted (D–F) rats. Note the enlarged appearance of the CT and IX terminal fields in sodium-restricted rats compared to controls. See figure 3B, F for corresponding merged images of these separate channels. R, rostral; L, lateral. Scale bar in A equals 100 μm.
Figure 3.

Fluorescent photomicrographs comparing the triple labeled terminal fields in horizontal sections of the NTS (approximate perimeter marked by white line) in a control (A–D) and a sodium-restricted (E–H) rat. The CT and IX terminal fields in the dorsal zone of restricted rats (E & F) are more expansive than controls (A & B). (Sections A and E are dorsal to B and F.) In the intermediate zone, the appearance of terminal fields in sodium-restricted rats (G) is also different from controls (C). Often, the IX terminal field in restricted rats extends into the ventral zone (H); however, this does not occur in controls (D). Retrogradely labeled salivatory nuclei are indicated by white arrows (B–D, G & H). Panels I – L show myelin-stained tissue from a separate control rat illustrating the shape of the NTS and other brainstem structures at the respective dorsal to ventral level to the fluorescent images in the same row. The NTS is outlined in black and black arrows point to the solitary tract. Refer to the color key in A to identify individual fields and respective overlap among different terminal fields. R, rostral; L, lateral. Scale bar in E equals 200 μm and refers to panels A – H. Scale bar in I equals 1 mm and refers to panels I – L. 4V, fourth ventricle; 12, hypoglossal nucleus; DCN, dorsal cochlear nucleus; icp, inferior cerebellar peduncle; NTS, nucleus of the solitary tract; Sp5, spinal trigeminal nucleus; sp5, spinal trigeminal tract; VCN, ventral cochlear nucleus
Terminal field volume and corresponding volumes of overlap among all three terminal fields and between individual terminal fields (Fig. 3) were quantified using Neurolucida software version 4.34 (MicroBrightField, Inc., Colchester, VT). Briefly, the perimeter of each labeled terminal field and the overlap among these fields was outlined and the area was calculated for each 3 μm optical section. Subsequently, the volume of each 50 μm physical section was calculated by summing the areas of each optical section and multiplying by 3 μm, the thickness between optical sections. Total terminal field volumes and volumes of overlap with other fields were determined by summing the volumes of each 50 μm section. For figure plates, Fireworks (Macromedia, Inc., San Francisco, CA), Volocity (Improvision, Inc., Lexington, MA) and Photoshop (Adobe Systems, San Jose, CA) were used to compose images from digital files in which all optical sections for each physical section were flattened into one plane. Images were only enhanced by contrast and brightness.
Control Measures
A variety of control measures were taken to verify that each fluorescent tracer labeled only the intended nerve. First, the geniculate ganglion, which contain cells whose axons comprise either the GSP or the CT nerve (never both; Fig. 1), were removed from three triple-labeled control and three sodium-restricted rats, sectioned on a cryostat, reacted as described above, and examined with the confocal laser microscope for the presence of double labeling. Since the tracer was applied peripheral to the ganglia these cells were labeled as well. Therefore, double-labeled geniculate ganglion cells would indicate a contamination of one nerve label with the other label (e.g., contamination of the GSP label with the CT label). In all cases, no double-labeled ganglion cells were observed. The labeling site of the IX nerve was distant from the tympanic bulla; therefore, petrosal ganglia were not examined.
Secondly, in addition to labeling afferent fibers that terminate in the NTS, each fluorescent tracer is effective in retrogradely labeling the respective salivatory nucleus cells (Contreras et al., 1980). These cells can be seen closely apposed medially to the intermediate and ventral zones of the NTS (Fig. 3B, C, D, G, H) and send outputs through only one nerve. We examined these retrogradely labeled cells for the presence of single or multiple fluorescent labels in every animal in which terminal field data were collected. Again, double-labeled cells indicates that a single tracer would inadvertently label more than one nerve. Upon every observation of the labeled terminal fields, the retrogradely labeled salivatory neurons never contained a double label.
Finally, the caudal portion of the NTS was examined in all brains to determine if the vagus nerve was inadvertently labeled (Hamilton and Norgren, 1984). In no case was there fluorescent label in the area of the NTS receiving vagal inputs.
NTS volume
To gain a perspective of the extent of terminal field distributions within the solitary nucleus, a myelin stain was used to determine total NTS volume (Fig. 3I – L). A separate group of adult control (n=4) and sodium-restricted (n=4) rats aged 40–60 days were perfused and brains were sectioned horizontally at 25 μm on a vibratome as described above. Sections were mounted on slides, delipidated in a graded series of alcohol and chloroform, and stained using a mixture of chromoxane cyanine R and 0.21M ferric chloride (Kiernan, 1984). With the exception of the solitary tract, the NTS is a myelin-poor area whose surrounding structures are myelin-rich. The darkly stained myelin allows the boundary of the NTS to be visualized throughout its dorsal-ventral extent (Fig. 3I – L). To quantify NTS volumes, the visible perimeter of the right NTS was outlined in each section and the corresponding areas were calculated using Neurolucida software. Total volume of the right NTS was determined by summing the areas of each section that contained terminal field (~ 22) and multiplying by 25 μm (the thickness of each section).
Ganglion Cell Quantification
In order to determine the effects of sodium-restriction on the survival of primary taste neurons, a separate group of control (n=10) and sodium-restricted (n=10) rats were used to count individual cell numbers in the geniculate and petrosal ganglia. The CT, GSP, and IX nerves were each labeled individually in separate rats as described above, except, Microruby (Molecular Probes) was used as the anterograde tracer. Microruby was used over other tracers because of its superior quality in labeling ganglion cells and because it can be used to visualize labeled cells by imaging intact (i.e., unsectioned) ganglia (Shuler et al., 2004). Visualization of BDA and Cascade Blue require histochemical reactions for visualization with the confocal laser microscope (see “Tissue Preparation” in this section). Each rat was perfused as described above. Ganglia were removed and postfixed in 8% paraformaldehyde overnight. Each ganglia was then dissected from either the VII or IX nerve and serial optical sections of intact ganglia were imaged on the confocal microscope at 2 μm intervals using the green laser, generating an average of 50 optical sections through each ganglia. All labeled neurons were physically counted with the aid of Neurolucida software.
Statistical Analysis
Mean total terminal field volume for each nerve and terminal field overlap volumes among nerves were compared statistically between control and sodium-restricted adults by analysis of variance (ANOVA). Mean volumes of dorsal, intermediate, and ventral portions (see Results for definitions of these zones) were also calculated, compared between control and sodium-restricted rats, and analyzed using ANOVA. In addition, ANOVAs were used to analyze statistical differences in NTS volumes and total ganglion cell numbers between control and sodium-restricted rats. All values are expressed as mean ± standard error. Statistical results with an alpha level less than 0.05 were reported as significant.
RESULTS
Total Terminal Field Volumes
Controls
Figure 4 shows the mean total volumes of terminal fields for the GSP, CT, and IX nerves. In control rats, the GSP terminations occupied the largest proportion of the NTS with a mean (± SEM) total terminal field volume of 77.3 (± 11.9) × 106 μm3. Total mean CT terminal field volume was 31.0 (± 3.0) × 106 μm3 and IX terminals occupied a mean volume of 67.2 (± 14.5) × 106 μm3. In controls, GSP terminations began more dorsal than did CT terminals and GSP terminal fields extended to (or beyond) the ventral extent of the CT terminal fields (Fig. 3A–D). IX projections terminated even more dorsally than GSP and extended ventrally to the dorsal-most portion of CT field (Fig. 3A, B), with the densest portions occupying the medial NTS. Therefore, the sequence of terminal fields in the control NTS in order of terminations from dorsal to ventral were IX, GSP, and then CT.
Figure 4.
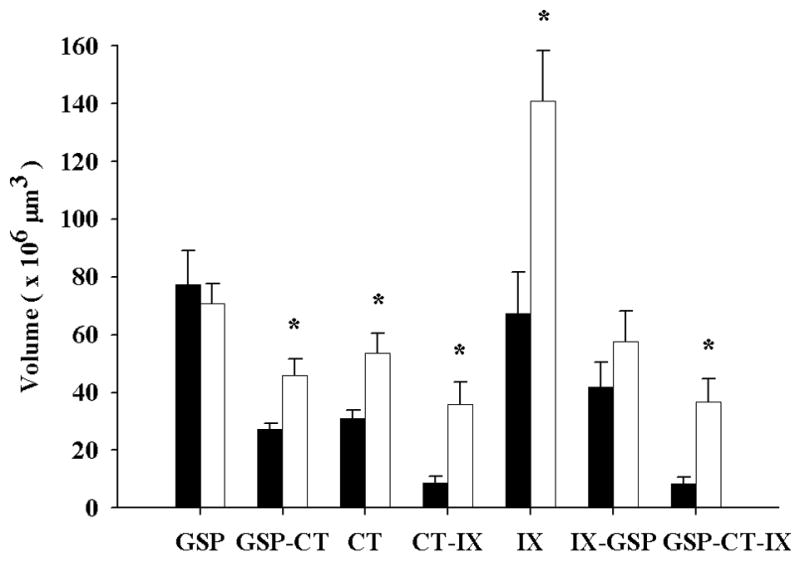
Mean (± SEM) total terminal field volumes of the GSP, CT, and IX nerves and corresponding overlap (e.g., GSP-CT) in the NTS of control (solid bars) and sodium-restricted (open bars) rats. In restricted rats, the CT and IX fields are larger than that of controls. This expansion results in corresponding increases in the overlap among terminal fields. GSP field size does not change. Asterisks indicate p < 0.05.
These three individual fields overlapped extensively with each other. CT and GSP fields overlapped widely within the rostral pole of the NTS (Fig. 3B–D) with a mean (± SEM) overlap volume of 27.2 (± 2.0) × 106 μm3 (Fig. 4). This represents approximately 88% of the CT field overlapping with the GSP field. A greater absolute amount of overlap occurred between GSP and IX fields (41.8 (± 8.6) × 106 μm3) than for CT and IX fields (8.6 (± 2.4) × 106 μm3; Fig. 4); however, the percentage of overlap that the GSP field had with the IX field and the percentage of overlap the CT field had with the IX field were not as extensive as was the percentage of overlap between the CT and the GSP fields (62% for GSP and IX overlap and 28% between CT and IX). The ventral-most extension of the IX field did not extend much beyond the dorsal-most boundary of the CT field, whereas the dorsal-most boundary of the GSP field invaded the ventral portion of the IX terminal field (Fig. 3A, B). The total mean volume for the overlap among all three fields was 8.5 (± 2.3) × 106 μm3 (Fig. 4). This overlap was essentially the amount found for the CT field overlap with the GSP (Fig. 4).
Sodium-restricted Rats
Developmental dietary sodium restriction resulted in profound alterations in the topography and distribution of gustatory terminal fields. Early dietary sodium restriction resulted in a significantly enlarged mean (± SEM) CT field (53.6 (± 6.7) × 106 μm3) compared to controls (P = 0.005; Fig. 4). This nearly 2X enlargement occurred in the dorsal-most portion of the CT terminal field, as it expanded caudally into the territories of the GSP and IX fields (Fig. 2E, 3F). The GSP terminal field in sodium-restricted rats was similar to controls (70.7 (± 7.0) × 106 μm3; P = 0.65; Fig. 4). Finally, the total IX field volume was over 2X greater than controls (140.9 (± 17.5) × 106 μm3; P = 0.013; Fig. 4). The IX field extended dorsally, ventrally, caudally, and laterally, well past the control IX field (Fig. 3E–H).
The amount of overlap occurring among fields was also different than in controls. As the CT and IX terminal fields increased in size, they expanded beyond the areas normally occupied in controls. Indeed, the volume of the mean (± SEM) CT-GSP field overlap was significantly greater than in controls (46.0 (± 5.6) × 106 μm3; P = 0.004; Fig. 4). Furthermore, the increase in overlapping volume was proportionate to the increase in volume of the CT field in sodium-restricted animals and did not differ between groups (88% vs. 86% of the CT field overlapped with the GSP field in controls and restricted rats, respectively). The overlap between the CT and IX fields also significantly increased with the dietary manipulation (35.8 (± 7.7) × 106 μm3; P = 0.007; Fig. 4), and was reflected in a larger proportion of the CT field overlapping with the IX field (28% vs. 67%). However, there were no group-related differences in the IX-GSP field overlap (57.6 (± 10.7) × 106 μm3; P = 0.280; Fig. 4), although the percent of GSP field contained within the IX field was slightly larger in restricted rats (62% vs. 82%). This indicates that the CT and IX fields extended past territory occupied in controls, into neighboring terminal fields. Finally, there was a significant increase in the volume in which all three terminal fields were common (36.7 (± 8.1) × 106 μm3; P = 0.007; Fig. 4), again due primarily to the increased size of the CT field.
Zonal Distribution of Terminal Fields
In order to localize regions especially susceptible to the dietary manipulation and to be consistent with our previous studies of CT terminal field in the NTS (King and Hill, 1991; Krimm and Hill, 1997; Sollars et al., 2006), the NTS was divided into dorsal, intermediate, and ventral zones. The dorsal zone contained sections in which the solitary tract was most visible and included sections in which the fourth ventricle occupied the largest medial-lateral extent (Fig. 3I, 3J). The dorsal zone was further characterized by the spinal trigeminal tract extending to approximately the rostral-most extent of the NTS and by the lack of the hypoglossal nucleus and the facial nucleus (Fig. 3I, J; facial nucleus not shown). This was the largest of the three zones, encompassing almost the entire IX terminal field in controls (Fig. 3A, B). In controls, this zone typically consisted of four to five 50μm sections and was distinguished by the rounded shape of the CT terminal field (Figs. 2B & 3B). The intermediate zone (usually two 50 μm sections) was characterized by the decrease in the fourth ventricle volume compared to the dorsal zone, by the dorsal extent of the hypoglossal nucleus, by the extension of the spinal trigeminal tract rostrally beyond the inferior cerebellar peduncle, and by the presence of the dorsal extent of the facial nucleus (Fig. 3K; facial nucleus not shown). In all animals, regardless of group, the terminal fields of the CT and GSP in the intermediate zone was most easily identified and most consistent across animals (Fig. 3C, G). The ventral zone of the gustatory terminal fields (usually three to four 50 μm sections) had an expanded hypoglossal nucleus and facial nucleus compared to the intermediate sections (Fig. 3L). Dividing the fields in this manner highlights the vastly different distribution of terminations along the dorsal-ventral aspect of the NTS and more narrowly defines specific regions of anatomical change. Compartmentalizing terminal fields into zones also demonstrates the similar characteristics and contiguous and overlapping arrangement of the three afferent terminal zones
It must be pointed out that we use the terms “dorsal”, “intermediate”, and “ventral” zones here to be consistent with earlier reports (King and Hill, 1991; Krimm and Hill, 1997; Sollars et al., 2006). However, the orientation of the NTS within the brainstem is such that the caudal portion of the NTS is dorsal to the ventral most portion. That is, the NTS is inclined from rostral to caudal. Therefore, the “dorsal” zone more accurately represents the dorsal-caudal portion of the field in the NTS and the intermediate and ventral sections represent a more ventral-rostral portion of the terminal field in the NTS.
Dorsal Zone Terminal Field Volume
The dorsal zone of the NTS exhibited the most substantial plasticity compared to other regions of the NTS. Consistent with previous findings (King and Hill, 1991; Krimm and Hill, 1997; Sollars et al., 2006), the mean (± SEM) volume of the CT field was over twice as large in the sodium-restricted animals (32.0 (± 5.9) × 106 μm3) compared to controls (15.6 (± 2.0) × 106 μm3; P = 0.023; Fig. 5A). The labeled fibers in restricted rats appeared more densely packed and extended more caudally than in controls (Figs. 2B, E, 3A–B, E–F). The corresponding portion of the GSP field was not significantly different between groups (restricted: 57.4 (± 10.7) × 106 μm3 v. control: 72.0 (± 13.5) × 106 μm3; P = 0.442; Fig. 2A, D; 5A). However, the volume of the IX field underwent a significant expansion in sodium-restricted rats compared to controls (131.8 (± 20.0) × 106 μm3 v. 67.0 (± 14.3) × 106 μm3; P = 0.030; Fig. 5A). The expansion of the IX field in the dorsal region extended further lateral, caudal, and ventral than in control animals (Fig. 2C, F; 3A, B, E, F).
Figure 5.
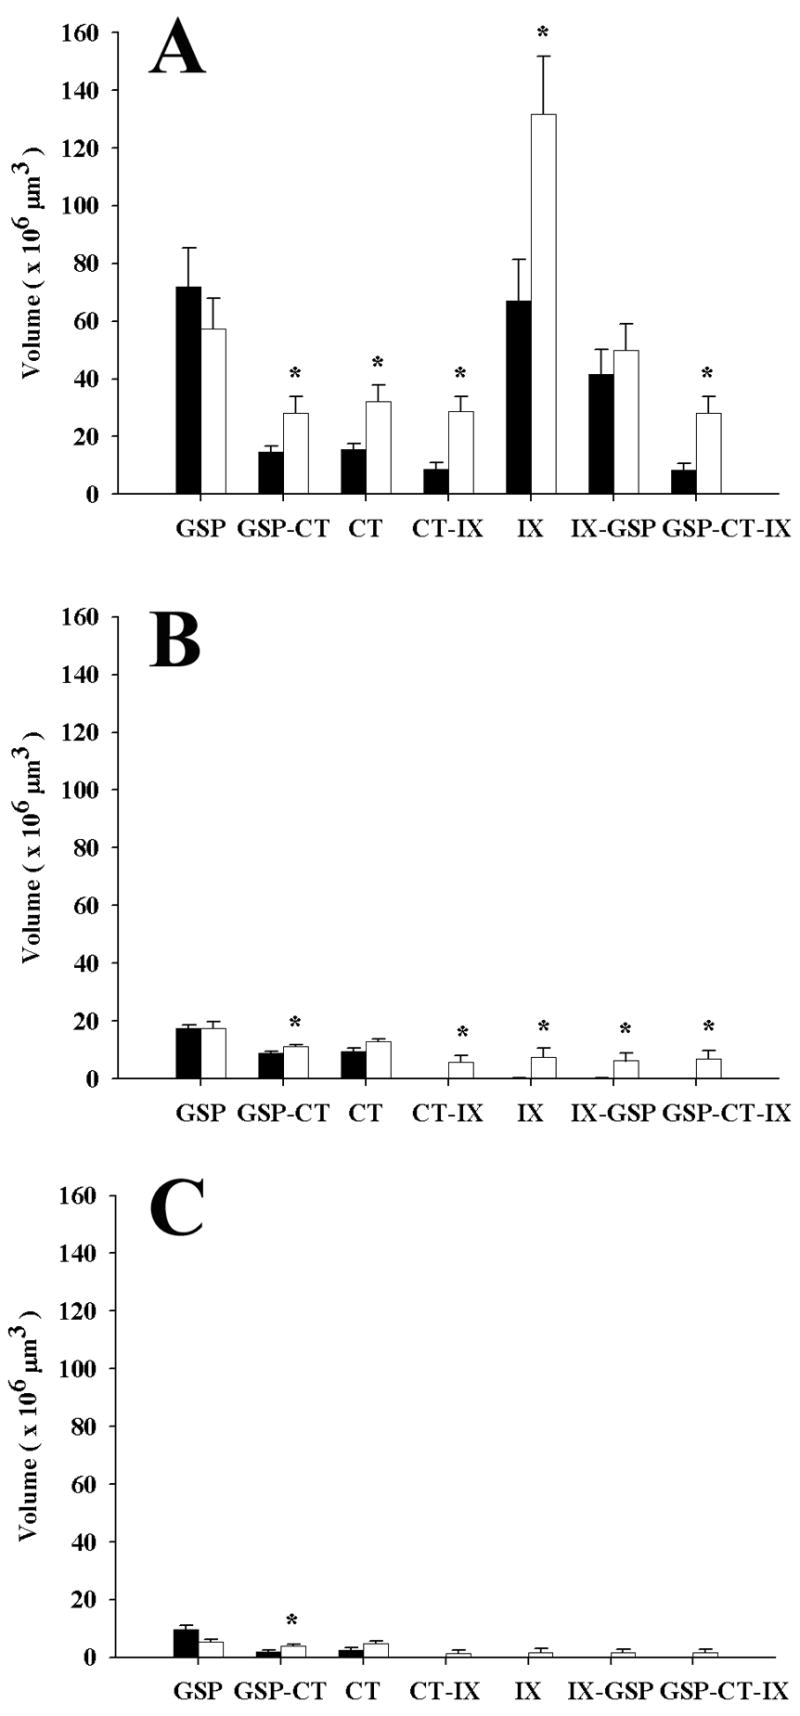
Zonal distribution of mean (± SEM) terminal field volumes of the GSP, CT, and IX nerves and corresponding overlap in the NTS of control (solid bars) and restricted (open bars) rats. A: Dorsal zone. The largest proportion of the respective terminal fields is contained in the dorsal zone. Also, the greatest increases in terminal field volume occur in this zone in restricted rats compared to controls. B: Intermediate zone. Terminal field volumes are distributed differently in this zone compared to others. Dietary manipulation affects only the IX field and resulting overlap of the IX field with CT and GSP. C: Ventral zone. This zone contains the least volume of terminal fields. The significance in CT-GSP overlap in restricted rats is attributed to a difference in how the GSP and CT fields are distributed within the NTS. Asterisks indicate p < 0.05.
Such differences in the patterns of gustatory terminations in the dorsal NTS were also reflected in the proportions of the overlapping fields. The dorsal CT field overlapped completely within the GSP field, and this volume of overlap was significantly greater in restricted rats compared to controls (28.3 (± 5.6) × 106 μm3 v. 14.9 (± 2.0) × 106 μm3; P = 0.041; Figs. 3B, F; 5A). In fact, the increase in overlap between the two fields was directly related to the increase in volume of the CT field, since the overlap increased proportionally to the increase in CT terminal field size. There was also a significant increase in the overlap between the CT and IX fields when comparing restricted to control rats (28.7 (± 5.2) × 106 μm3 v. 8.6 (± 2.4) × 106 μm3; P = 0.007; Figs. 3B, F; 5A). This increase was also due to the expansion of both the CT and IX fields past their normal boundaries. However, there was no significant difference in the volume of the overlapping regions of the GSP and IX fields (restricted: 49.9 (± 9.2) × 106 μm3 v. control: 41.7 (± 8.5) × 106 μm3; P = 0.533; Figs. 3B, F; 5A). Finally, the volume of the region in which of all three terminal fields overlapped also increased significantly (restricted: 28.2 (± 5.6) × 106 μm3 v. control: 8.4 (± 2.3) × 106 μm3; P = 0.009; Figs. 3B, F; 5A).
Intermediate Zone Terminal Field Volume
A different pattern of terminal field organization between groups was also evident in the intermediate zone of the NTS. Here, the CT terminal fields in both groups had a more compact oval configuration than in dorsal regions (Fig. 3C, G). In the intermediate zone, the volume of CT terminal field label in restricted animals was not significantly different from controls (12.7 (± 1.0) × 106 μm3 v. 9.4 (± 1.1) × 106 μm3; P = 0.069; Fig. 5B). Furthermore, the GSP field volumes in this zone were also similar between groups (restricted: 17.4 (± 2.4) × 106 μm3 v. control: 17.5 (± 1.1) × 106 μm3; P = 0.978; Fig. 5B). However, the IX field in sodium-restricted rats showed robust expansion into the intermediate portion of the NTS, extending ventrally beyond the boundaries of the control field; in controls, the IX field was not present in the intermediate NTS (Fig. 3C, G). Specifically, sodium restriction yielded a 40-fold increase in volume compared to controls (7.4 (± 3.0) × 106 μm3 v. 0.2 (± 0.2) × 106 μm3 P = 0.030; Fig. 5B).
Despite no significant changes in the total volume of CT and GSP terminal fields in the intermediate NTS, there was a significant increase in the volume of overlap between the GSP and CT fields in restricted rats compared to controls (11.1 (± 0.6) × 106 μm3 v. 8.7 (± 0.7) × 106 μm3; P = 0.039; Figs. 3C, G; 5B). Additionally, both the volume of the overlapping field between the CT and IX fields and between the GSP and IX fields in restricted rats increased proportionally with an increase in the IX terminal field volume (CT-IX restricted: 5.6 (± 2.5) × 106 μm3 v. control: 0.004 (± 0.004) × 106 μm3; P = 0.04) (IX-GSP restricted: 6.1 (± 2.7) × 106 μm3 v. control: 0.1 (± 0.1) × 106 μm3; P = 0.04; Fig. 5B). Thus, in restricted rats, the IX terminal field in the intermediate zone of the NTS intersected with both the GSP and CT terminal fields. This is also evident in the significantly increased volume of the overlapping portion of all three terminals fields (restricted: 7.0 (± 2.8) × 106 μm3 v. control: 0.004 (± 0.004) × 106 μm3; P = 0.03; Figs. 3C, G; 5B)
Ventral Zone Terminal Field Volume
The ventral portion of the NTS contained the least volume of gustatory terminal fields. Both CT and GSP terminal fields were sparse and were not reliably different between diet conditions (P = 0.069 and P = 0.052, respectively; Fig. 5C). In two of the nine sodium-restricted rats, a small portion of the IX field extended into the ventral NTS; this extension occurred in none of the control rats (Fig. 3D, H). However, there was not a significant difference in the volume of the IX field in sodium-restricted rats compared to controls (P = 0.152; Fig. 5C).
In addition, the terminal field volume overlap between CT-IX and IX-GSP were not significantly different between groups (P = 0.185 and P = 0.184, respectively; Fig. 5C). However, there was a significant increase in the overlap of the GSP and CT terminal fields in sodium-restricted rats compared to controls (P = 0.042; Figs. 3D, H; 5C). Finally, the overlap among all three terminal fields was not significantly different (P = 0.189; Fig. 5C).
Coronal Sections: An Illustration of the Overlapping Fields in Subnuclei
As noted previously, the NTS is inclined dorsoventrally as it extends rostrally; therefore, the term “dorsal” also denotes caudal. This feature is best seen through serial coronal sections of the brainstem. Moreover, subdivisions of the NTS based on cyto- and chemoarchitectural features have been defined exclusively with coronal sections (Whitehead, 1988; Halsell et al., 1996; Zhang and Ashwell, 2001).
To illustrate the overlapping fields and the diet-related differences further, we labeled the gustatory nerves of a control and a developmentally sodium-restricted rat as done earlier, but sections were made coronally through the NTS. Terminal field labeling and imaging of the GSP, CT, and IX were accomplished as described for the horizontally-sectioned tissue (Fig. 6A–D, 6G–J). Additionally, one optical section using transmitted light was imaged to determine subnuclei within the NTS. This allowed us to accurately overlay the flattened terminal field image onto an image in which subnuclei of the NTS could be visualized (Fig. 6E, K). Finally, each section was mounted on slides and subsequently stained with creysl violet to show the NTS and other dorsal medullary structures (Fig. 6F, L). No measurements were taken from coronal sections.
Figure 6.

Coronal section through the “intermediate” zone of the rat medulla in a control (A – F) and in a sodium-restricted rat (G – L) showing the terminal field for the GSP (A, G), CT (B, H), and the IX nerves (C, I). Panels D and J show the merged terminal fields and panels E and K show the merged image superimposed on an image of the brainstem obtained through the transmitted light channel on the confocal laser microscope system. Panels F and L show nissl-stained tissue illustrating the location of the NTS relative to other brainstem structures. Dark lines in E, F, K, and L demarcate the approximate boundaries of the subdivisions in the NTS as described by Halsell et al., 1996. These examples illustrate the primary findings of the data obtained in horizontal sections: GSP terminal fields are similar between control (A) and sodium-restricted rats (G), whereas the CT terminal field in sodium-restricted rats (H) extends more dorsally and caudally than in controls (B), and the IX terminal field is enlarged and extends more ventrally in sodium-restricted rats (I) than in controls (C). Importantly, the expanded CT and IX fields in sodium-restricted rats do not invade additional subdivisions in the NTS than in controls (E, K). Note that the borders of the subdivisions are close approximations of what the borders are as revealed by more extensive staining procedures (see Halsell et al., 1996). Panels F and L show that these sections are from the “intermediate” zone and are from approximately the same rostral-caudal level. Refer to the color key in D to identify individual fields and respective overlap among different terminal fields. D, dorsal; L, lateral; T, solitary tract; M, medial subdivision of the NTS, RC, rostral central subdivision of the NTS; V, ventral subdivision of the NTS; RL, rostral lateral subdivision of the NTS. 4V, fourth ventricle; 10, dorsal motor nucleus of the vagus; 12, hypoglossal nucleus; MVe, medial vestibular nucleus; sp5, spinal trigeminal tract; SpVe, spinal vestibular nucleus. Scale bar in A equals 200 μm and applies to A – D and G – J. Scale bar in E equals 200 μm and also applies to panel K. Scale bar in F equals 500 μm and also applies to panel L.
Figure 6 shows the overlapping fields in a control (A–F) and in a developmentally sodium-restricted (G–L) rat. These coronal sections were taken approximately 600 μm caudal from the anterior-most extent of the NTS (Fig. 6F, 6L). Therefore, sections used here to illustrate the diet-related effects were from the “intermediate” zone of the NTS (Halsell et al., 1996). The GSP terminal fields were similar between the control and sodium-restricted rat (Fig. 6A, 6G). However, the CT terminal field in the sodium-restricted rat (Fig. 6H) was substantially larger than in the control rat (Fig. 6B). Similarly, the IX terminal field in the sodium-restricted rat (Fig. 6I) was larger and extended more ventrally than in the control rat (Fig. 6C). These fields combined to show greater amounts of overlap in the sodium-restricted rat (Fig. 6J) compared to the control rat (Fig. 6D). Importantly, the expanded terminal fields in the sodium-restricted rat were contained within the same subnuclei as occupied by the control. That is, the labels were limited primarily to the rostral-central and medial subnuclei and did not extend into the ventral subnucleus (Fig. 6E, K). It should be noted that the boundaries for the subdivisions of NTS subnuclei shown in Figure 6 are similar to that shown by Halsell et al. (1996) the exact boundaries may differ slightly from that shown.
Summary of Terminal Field Organization
The three gustatory terminal fields in control rats were arranged in an ordered, yet overlapping, fashion such that IX terminals began most dorsally and spread rostrally, caudally, laterally, and ventrally into the GSP terminal field. As the IX field reached its ventral-most extent, the CT field began and overlapped almost completely with the GSP terminal field. The GSP field began more dorsally than the CT field, but both the GSP and CT fields extended to the same ventral boundary of the NTS. Sodium restriction dramatically altered the topography of the CT and IX terminal fields of the NTS, without affecting the distribution of the GSP terminal field. For the CT terminal field, this plasticity was most evident in the dorsal portion of the CT field. The effects on the IXth terminal field were more widespread, whereby IX fields extended further dorsally, ventrally, caudally, and laterally throughout the NTS. The three terminal fields overlapped more extensively in sodium-restricted rats compared to control rats, indicating that all three gustatory nerves converge onto larger areas in the NTS of restricted rats than in controls.
Total NTS volume
Since sodium-restricted rats are much smaller than controls at adulthood (Hill et al., 1986), we measured the total NTS volume in sodium-restricted and control rats to examine the relative size of the terminal fields within the NTS. The mean total volume of the right NTS was 10.2 (± 0.5) × 108 μm3 in control and 7.2 (± 0.2) × 108 μm3 in restricted rats. This represented a significant 29.2% decrease in total volume of NTS in sodium-restricted rats compared to controls (P = 0.001; Fig. 7A). These totals were consistent with the total NTS volumes reported by King and Hill (1991). When individual nerve terminal field volumes were standardized to their respective NTS volumes, the group-related differences were magnified. The CT and IX terminal fields and their respective overlapping portions occupied a significantly larger percentage of the nucleus relative to controls while the GSP terminal field did not differ significantly between groups. The CT terminal field occupied 7.4% of the total NTS in sodium-restricted rats compared to 3% of the NTS in control rats (P = 0.0001; Fig. 7B). The IX terminal field occupied 19.5% of the total NTS in sodium-restricted rats compared to 6.6% of the NTS in control rats (P = 0.002; Fig. 7B). The GSP terminal field occupied 9.8% of the total NTS in sodium-restricted rats compared to 7.6% of the NTS in control rats (P = 0.17; Fig. 7B). The corresponding overlap between the individual fields and among all three fields also increased significantly (GSP-CT, P = 0.0001; CT-IX, P = 0.004; IX-GSP, P = 0.047; Fig. 7B). Therefore, the differences in the larger absolute volumes for the CT and IX fields in sodium-restricted rats compared to controls were exaggerated when expressed relative to the smaller NTS.
Figure 7.

A. Total mean volume of the right half of the NTS in control (solid bars) and restricted (open bars) rats. The NTS volume of restricted rats is significantly smaller than controls. B. Mean volume of GSP, CT, and IX terminal fields and their respective overlapping portions normalized to total NTS volume in control (solid bars) and restricted (open bars) rats. A greater proportion of the NTS is occupied by overlapping terminal fields in restricted rats compared to controls. Error bars denote SEM; asterisks indicate p < 0.05.
Ganglion cell number
Ganglion cell numbers were counted to address the hypothesis that the increase in terminal field volumes in sodium-restricted rats was due to an increased number of primary afferents terminating in the NTS. That is, a diet-related increase in neuron number may result in an increase in the volume of afferent projections to the NTS. However, sodium restriction did not alter the total number of ganglion cells for any of the three taste nerves. Figure 8 shows that there were no significant differences between control and sodium-restricted ganglion cell numbers for the CT (P = 0.105), GSP (P = 0.065), or IX nerves (P = 0.931).
Figure 8.
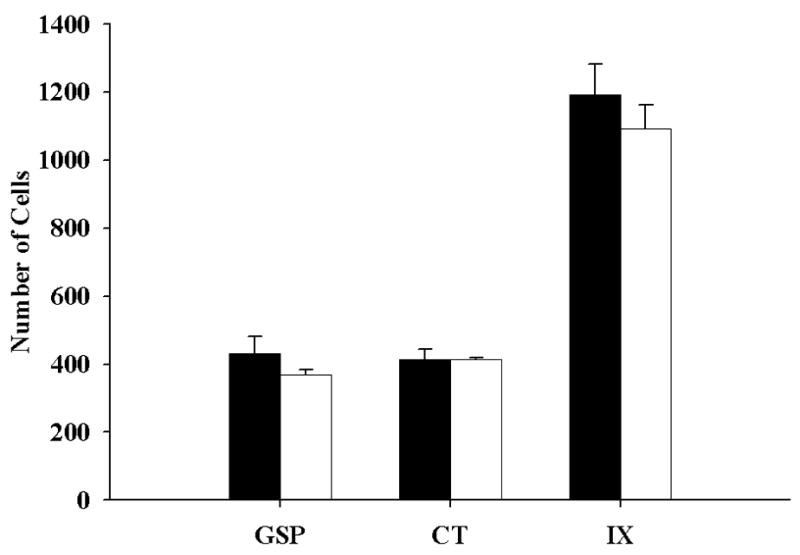
Mean (± SEM) number of geniculate (GSP, CT) and petrosal (IX) ganglion cells in control (solid bars) and restricted (open bars) rats. The number of cells in each respective ganglia are similar in control and restricted rats. Note: petrosal ganglia contain 3X more cells than geniculate ganglia.
DISCUSSION
Through the use of a novel triple fluorescent labeling procedure, this study demonstrated specific and dramatic plastic anatomical changes in afferent terminal fields in the gustatory medulla. The total volume of the CT and IX nerve terminal fields were expanded at least two times their normal size in developmentally sodium-restricted rats, while the GSP was unaffected by the dietary manipulation. Moreover, the change in terminal field volumes impacted the way nerves project into the NTS and overlapped with other fields. These effects were even more dramatic when considering that the total volume of the NTS in restricted rats was smaller than in controls. Furthermore, this plasticity could not be accounted for by sheer increases in innervating afferent fibers because sodium restriction did not alter the survival of geniculate or petrosal ganglion cells.
A clear advantage of our triple labeling approach is that, for the first time, the relative relationships among the terminal fields of three distinct gustatory nerves could be examined in the medulla of controls and experimental animals. Figure 9 depicts this organization in both control and sodium-restricted rats. In control rats, the IX terminates dorsal to the other two terminal fields and projects ventrally to overlap with the dorsal (i.e., dorsal-caudal) portion of the GSP field. The IX field extends more rostrally at the dorsal GSP zone and terminates more laterally in the NTS than was previously reported (Hamilton and Norgren, 1984; also see Fig. 3A, B). The ventral portion of the IX field abuts the dorsal-most portion of the CT field. CT and GSP fields nearly overlap completely within the rostral pole of the NTS. Contrary to previous results, the coextensive CT and GSP fields within the rostral NTS not only occupy the lateral portions of the NTS, but both extend medially as well (Hamilton and Norgren, 1984; see Fig. 3A – C; E – F). Importantly, there is a relatively small region where all three nerves terminate.
Figure 9.
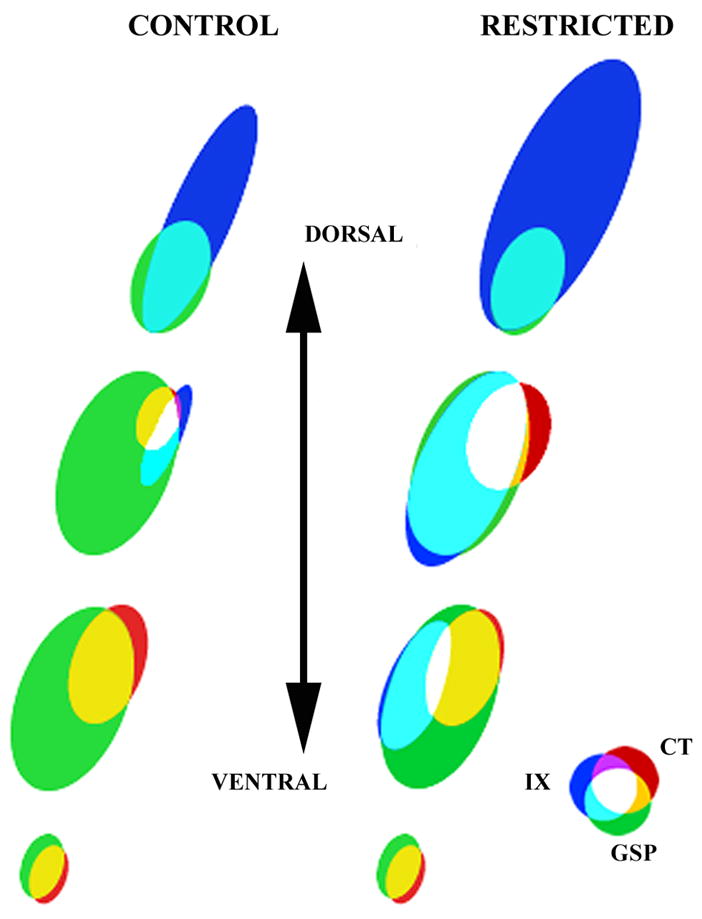
Model of terminal field organization through the dorsal-ventral extent of horizontal sections from the right NTS in control and restricted rats. Overlapping fields are represented at four levels along the dorsal-ventral axis. See results for details of the overlap among the three fields and a comparison of diet-related differences. Refer to color key to identify individual fields and respective overlap among different terminal fields. Note: Due to the orientation of the NTS within the brainstem, the term “dorsal” sections refers to dorsal-caudal and “ventral” refers to ventral-rostral.
In sodium-restricted rats, the dorsal portion of the CT terminal field expands caudally outside its normal boundaries into GSP and IX field territory. The IX field extends dorsally, caudally, laterally, and ventrally, well past the apparent boundary of control IX field. Consequently, the overlap occurring among adjacent fields also increases.
Comparisons with previous studies
Consistent with King and Hill (1991) and Krimm and Hill (1997), we found anatomical changes induced by early dietary sodium restriction in the dorsal portion of the CT terminal field. It is within this zone where changes in terminal fields are also affected developmentally by limited taste experience (Lasiter and Diaz, 1992; Lasiter, 1995), taste receptor cell damage (Lasiter and Kachele, 1990), and high salt diets (Pittman and Contreras, 2002). Thus, a variety of experimental procedures show this zone to be especially susceptible to environmental alterations.
However, our triple label experiments show that plasticity is not exclusive to the CT terminal field as previously demonstrated (King and Hill, 1991), but also includes the IX terminal field. Furthermore, in contrast to previous reports that dietary sodium restriction does not change the absolute volume of the CT terminal field but changes the distribution of the terminal field in the NTS (King and Hill, 1991), we found that the dietary manipulation also increases the absolute CT terminal field volume. We believe these differences are partially due to the relatively high sensitivity of labeling terminal fields with fluorescent tracers and to viewing fields with a confocal laser microscope.
Speculations on plasticity mechanisms
Since sodium-taste-elicited activity is a major component of the electrophysiological response of the CT nerve, hypotheses that center around CT activity shaping terminal field development have been attractive. Indeed, dietary NaCl restriction during early development produces a selective reduction in the taste response of the CT nerve to sodium salts but not to other taste stimuli (Hill, 1987; Hill and Przekop, 1988). Our data indicate, however, that terminal field plasticity is no longer unique to the CT field. In fact, compared to the CT, sodium restriction produces much more dramatic changes in the terminal field of the IX. However, the sensitivity of the IX nerve taste responses to sodium salts is insubstantial compared to responses of the CT nerve (Formaker and Hill, 1991; Kitada et al., 1998). Furthermore, the processes that determine the abnormal terminal fields in the NTS induced by dietary sodium restriction appear to be accomplished before taste receptor cells are present on the tongue. Restricting maternal dietary sodium during only a brief critical period from E3–E12 is sufficient to cause an enlarged CT terminal field (Krimm and Hill, 1997). Thus, the parameters allowing plasticity to occur are established well before sodium taste stimuli are transduced through functional taste receptor cells, suggesting that an activity-dependent mechanism may not be the only explanation for alterations in terminal field development as a result of sodium restriction. Dietary sodium restriction must influence gustatory nerve terminal field development by additional, non-activity dependent mechanisms as well.
Prenatal dietary manipulations have a range of physiological consequences that extend beyond the gustatory system and may play a role in gustatory terminal field development. For example, reduction of sodium intake affects hormonal levels like aldosterone (Kifor et al., 1991; Lehoux et al., 1994) and early dietary restriction paradigms influence growth factor levels such as IGF1 (Fliesen et al., 1989). Indeed, IGF1 has significant effects on NTS development (Eustache et al., 1994; Dentremont et al., 1999). Thus, the anatomical rearrangement occurring within the NTS may not be directly related to taste function but may result from nonspecific effects of early sodium restriction. That is, the boundaries and subsequent molecules associated with boundary formation for the CT and IX field (e.g., axonal pathfinding) may be altered through early dietary sodium restriction, independent of neural activity.
Some selectivity must still be present, however, because the GSP terminal field is not affected. It is possible that the effects of early dietary manipulation may be expressed after processes that determine GSP field development are solidified. That is, the processes resulting from our dietary manipulation may exist after the GSP field is determined but before the molecular cues associated with the formation of CT and IX terminal fields are organized.
Given the development of the three terminal fields, it is possible that the GSP field may shape the formation of other gustatory fields in the NTS, especially the CT. Facial nerve axons, which include both CT and GSP, terminate in the rostral NTS at P1 and develop to approximately P25 (Lasiter, 1992). IX fibers enter the NTS around P10 and develop to approximately P45 (Lasiter, 1992). This chronological pattern of innervation and terminal field formation in the NTS occurs in conjunction with the morphological development of gustatory receptors. The maturation of palatal taste receptor cells precedes that of fungiform and circumvallate taste receptor cells (Harada et al., 2000). Furthermore, preliminary data from our lab indicate a significant GSP field development by P10, whereas CT field development is immature at this age (S. I. Sollars & D. L. Hill, unpublished observations). Given this sequence of individual terminal field development, we propose that the GSP terminations arrive first in the NTS and establish their boundaries before the effects of the plasticity-inducing diet are realized. As the GSP terminal field becomes established, the CT terminal field termination pattern is subject to the milieu organized by the pioneering GSP field. Indeed, the restricted CT terminal field pattern mirrors that of the GSP nerve, as they overlap almost entirely within the rostral pole of the NTS. As an aside, this would predict that disruption in GSP field development would correspondingly disrupt CT field development. Finally, the IX fibers, perhaps due to influences from other nerves, expand to where the boundary cues are apparently grossly disrupted.
Potential functional and behavioral effects
As a result of the disruption of individual terminal field boundaries, gustatory afferents from the three nerves likely converge anatomically more onto NTS neurons than in controls. Such convergence may have a corresponding functional basis. In addition to the selective decrease in taste responses from NTS neurons driven by stimulation of the anterior tongue in sodium-restricted rats (i.e., CT stimulation; Vogt and Hill, 1993), functional alterations may also be evident in NTS neurons receiving unique combinations of two or three afferent inputs. Our data indicate NTS neurons in sodium-restricted rats would likely receive inputs from receptive fields not normally found in controls (Travers et al., 1986). As a corollary to the unusual synaptic inputs in restricted rats, the morphology of NTS neurons and associated synaptic structures would also likely be affected. Indeed, gross changes in dendritic length and number occur in sodium-restricted rats (King and Hill, 1993). This potential anatomical and functional convergence may also be reflected behaviorally by altering taste-related behaviors, including sodium appetite. Therefore, the striking alterations occurring in the NTS both pre- and postsynaptically as a result of developmental dietary manipulation have important implications on central processing of taste stimuli and on behavior.
Acknowledgments
We extend our appreciation to Dr. Peter C. Brunjes for the use of his confocal laser microscope and to Mr. William B. Goodwin and Ms. Rebecca B. Reddaway for their technical assistance. We also express our sincere gratitude to Ms. Jennifer E. Stertzer for her digital imaging expertise.
This research was supported by NIH grants DC00407 and DC06332. We also thank the expert technical assistance by Mr. William B. Goodwin, Jr.
LITERATURE CITED
- Buonomano DV, Merzenich MM. Cortical plasticity: from synapses to maps. Annu Rev Neurosci. 1998;21:149–186. doi: 10.1146/annurev.neuro.21.1.149. [DOI] [PubMed] [Google Scholar]
- Catalano SM, Shatz CJ. Activity-dependent cortical target selection by thalamic axons. Science. 1998;281:559–562. doi: 10.1126/science.281.5376.559. [DOI] [PubMed] [Google Scholar]
- Contreras RJ, Beckstead RM, Norgren R. The central projections of the trigeminal, facial, glossopharyngeal and vagus nerves: an autoradiographic study in the rat. J Auton Nerv Syst. 1982;6:303–322. doi: 10.1016/0165-1838(82)90003-0. [DOI] [PubMed] [Google Scholar]
- Contreras RJ, Gomez MM, Norgren R. Central origins of cranial nerve parasympathetic neurons in the rat. J Comp Neurol. 1980;190:373–394. doi: 10.1002/cne.901900211. [DOI] [PubMed] [Google Scholar]
- Davis BJ. Computer generated rotational analyses reveal a key three-dimensional feature of the nucleus of the solitary tract. Brain Res Bull. 1988;20:545–548. doi: 10.1016/0361-9230(88)90213-4. [DOI] [PubMed] [Google Scholar]
- Dentremont KD, Ye P, D’Ercole AJ, O’Kusky JR. Increased insulin-like growth factor-I (IGF-I) expression during early postnatal development differentially increases neuron number and growth in medullary nuclei of the mouse. Brain Res. 1999;114:135–141. doi: 10.1016/s0165-3806(99)00024-3. [DOI] [PubMed] [Google Scholar]
- Erickson RP. Nontraumatic headholders for mammals. Physiol Behav. 1966;1:97–98. [Google Scholar]
- Eustache I, Seyfritz N, Gueritaud JP. Effects of insulin-like growth factors on organotypic cocultures of embryonic rat brainstem slices and skeletal muscle fibres. Dev Brain Res. 1994;81:284–292. doi: 10.1016/0165-3806(94)90314-x. [DOI] [PubMed] [Google Scholar]
- Fliesen T, Maiter D, Gerard G, Underwood LE, Maes M, Keteslegers JM. Reduction of serum insulin-like growth factor-I by dietary protein restriction is age dependent. Pediatr Res. 1989;26:415–419. doi: 10.1203/00006450-198911000-00010. [DOI] [PubMed] [Google Scholar]
- Formaker BK, Hill DL. Lack of amiloride sensitivity in SHR and WKY glossopharyngeal taste responses to NaCl. Physiol Behav. 1991;50:765–769. doi: 10.1016/0031-9384(91)90015-g. [DOI] [PubMed] [Google Scholar]
- Fox K, Wallace H, Glazewski S. Is there a thalamic component to experience-dependent cortical plasticity? Phil Trans R Soc Lond B. 2002;357:1709–1715. doi: 10.1098/rstb.2002.1169. [DOI] [PMC free article] [PubMed] [Google Scholar]
- Halsell CB, Travers SP, Travers JB. Ascending and descending projections from the rostral nucleus of the solitary tract originate from separate neuronal populations. Neuroscience. 1996;72:185–197. doi: 10.1016/0306-4522(95)00528-5. [DOI] [PubMed] [Google Scholar]
- Hamilton RB, Norgren R. Central projections of gustatory nerves in the rat. J Comp Neurol. 1984;222:560–577. doi: 10.1002/cne.902220408. [DOI] [PubMed] [Google Scholar]
- Harada S, Yamaguchi K, Kanemaru N, Kasahara Y. Maturation of taste buds on the soft palate of the postnatal rat. Physiol Behav. 2000;68:333–339. doi: 10.1016/s0031-9384(99)00184-5. [DOI] [PubMed] [Google Scholar]
- Henderson TA, Woolsey TA, Jacquin MF. Infraorbital nerve blockade from birth does not disrupt central trigeminal pattern formation in the rat. Dev Brain Res. 1992;66:146–152. doi: 10.1016/0165-3806(92)90152-m. [DOI] [PubMed] [Google Scholar]
- Hill DL. Susceptibility of the developing rat gustatory system to the physiological effects of dietary sodium deprivation. J Physiol. 1987;393:423–434. doi: 10.1113/jphysiol.1987.sp016830. [DOI] [PMC free article] [PubMed] [Google Scholar]
- Hill DL, Przekop PR. Influences of dietary sodium on functional taste receptor development: a sensitive period. Science. 1988;241:1826–1828. doi: 10.1126/science.3175625. [DOI] [PubMed] [Google Scholar]
- Hill DL, Mistretta CM, Bradley RM. Effects of dietary NaCl deprivation during early development on behavioral and neurophysiological taste responses. Behav Neurosci. 1986;100:390–398. doi: 10.1037//0735-7044.100.3.390. [DOI] [PubMed] [Google Scholar]
- Hubel DH, Wiesel TN. The period of susceptibility to the physiological effects of unilateral eye closure in kittens. J Physiol. 1970;206:419–436. doi: 10.1113/jphysiol.1970.sp009022. [DOI] [PMC free article] [PubMed] [Google Scholar]
- Katz LC, Crowley JC. Development of cortical circuits: lessons from ocular dominance columns. Nat Rev Neurosci. 2002;3:34–42. doi: 10.1038/nrn703. [DOI] [PubMed] [Google Scholar]
- Kiernan JA. Chromoxane cyanine R. II. Staining of animal tissues by the dye and its iron complexes. J Microsc. 1984;134:25–39. doi: 10.1111/j.1365-2818.1984.tb00501.x. [DOI] [PubMed] [Google Scholar]
- Kifor I, Moore TJ, Fallo F, Sperling E, Menachery A, Chiou C-Y, Williams GH. The effect of sodium intake on angiotensin content of the rat adrenal gland. Endocrinology. 1991;128:1277–1284. doi: 10.1210/endo-128-3-1277. [DOI] [PubMed] [Google Scholar]
- King CT, Hill DL. Early sodium chloride deprivation selectively influences the terminal field organization of gustatory afferents projecting to the NTS. J Comp Neurol. 1991;303:159–169. doi: 10.1002/cne.903030114. [DOI] [PubMed] [Google Scholar]
- King CT, Hill DL. Neuroanatomical alterations in the rat nucleus of the solitary tract folowing early maternal NaCl deprivation and subsequent NaCl repletion. J Comp Neurol. 1993;333:531–542. doi: 10.1002/cne.903330406. [DOI] [PubMed] [Google Scholar]
- Kitada Y, Mitoh Y, Hill DL. Salt taste responses of the IXth nerve in Sprague-Dawley rats: lack of sensitivity to amiloride. Physiol Behav. 1998;63:945–949. doi: 10.1016/s0031-9384(98)00009-2. [DOI] [PubMed] [Google Scholar]
- Krimm RF, Hill DL. Early prenatal critical period for chorda tympani nerve terminal field development. J Comp Neurol. 1997;378:254–264. [PubMed] [Google Scholar]
- Lasiter PS. Postnatal development of gustatory recipient zones within the nucleus of the solitary tract. Brain Res Bull. 1992;28:667–677. doi: 10.1016/0361-9230(92)90245-s. [DOI] [PubMed] [Google Scholar]
- Lasiter PS. Effects of orochemical stimulation on postnatal development of gustatory recipient zones within the nucleus of the solitary tract. Brain Res Bull. 1995;38:1–9. doi: 10.1016/0361-9230(95)00063-k. [DOI] [PubMed] [Google Scholar]
- Lasiter PS, Diaz J. Artificial rearing alters development of the nucleus of the solitary tract. Brain Res Bull. 1992;29:407–410. doi: 10.1016/0361-9230(92)90076-a. [DOI] [PubMed] [Google Scholar]
- Lasiter PS, Kachele DL. Effects of early postnatal receptor damage on development of gustatory recipient zones within the nucleus of the solitary tract. Dev Brain Res. 1990;55:57–71. doi: 10.1016/0165-3806(90)90106-9. [DOI] [PubMed] [Google Scholar]
- Lasiter PS, Wong DM, Kachele DL. Postnatal development of the rostral solitary nucleus in rat: Dendritic morphology and mitochandrial enzyme activity. Brain Res Bull. 1989;22:313–321. doi: 10.1016/0361-9230(89)90059-2. [DOI] [PubMed] [Google Scholar]
- Lehoux J-G, Bird IM, Rainey WE, Tremblay A, Ducharme L. Both low sodium and high potassium intake increase the level of adrenal angiotensin-II receptor type 1, but not that of adrenocorticotropin. Endocrinology. 1994;134:776–782. doi: 10.1210/endo.134.2.7507836. [DOI] [PubMed] [Google Scholar]
- Pittman DW, Contreras RJ. Dietary NaCl infulences the organization of chorda tympani neurons projecting to the nucleus of the solitary tract in rats. Chem Senses. 2002;27:333–341. doi: 10.1093/chemse/27.4.333. [DOI] [PubMed] [Google Scholar]
- Rauschecker JP. Auditory cortical plasticity: a comparison with other sensory systems. Trends Neurosci. 1999;22:74–80. doi: 10.1016/s0166-2236(98)01303-4. [DOI] [PubMed] [Google Scholar]
- Sollars SI, Hill DL. Lack of functional and morphological susceptibility of the greater superficial petrosal nerve to developmental dietary sodium restriction. Chem Senses. 2000;25:719–727. doi: 10.1093/chemse/25.6.719. [DOI] [PubMed] [Google Scholar]
- Sollars SI, Walker BR, Thaw AK, Hill DL. Age-related decrease of the chorda tympani nerve terminal field in the nucleus of the solitary tract is prevented by dietary sodium restriction during development. Neuroscience. 2006;137:1229–1236. doi: 10.1016/j.neuroscience.2005.09.040. [DOI] [PMC free article] [PubMed] [Google Scholar]
- Shuler MG, Krimm RF, Hill DL. Neuron/target plasticity in the peripheral gustatory system. J Comp Neurol. 2004;472:183–192. doi: 10.1002/cne.11017. [DOI] [PMC free article] [PubMed] [Google Scholar]
- Travers SP, Pfaffmann C, Norgren R. Convergence of lingual and palatal gustatory neural activity in the nucleus of the solitary tract. Brain Res. 1986;365:305–320. doi: 10.1016/0006-8993(86)91642-2. [DOI] [PubMed] [Google Scholar]
- Vogt MB, Hill DL. Enduring alterations in neurophysiological taste responsed after early dietary sodium deprivation. J Neurophysiol. 1993;69:832–841. doi: 10.1152/jn.1993.69.3.832. [DOI] [PubMed] [Google Scholar]
- Whitehead MC. Neuronal architecture of the nucleus of the solitary tract in the hamster. J Comp Neurol. 1988;276:547–572. doi: 10.1002/cne.902760409. [DOI] [PubMed] [Google Scholar]
- Yan J. Development and plasticity of the auditory cortex. Can J Neurol Sci. 2003;300:189–200. doi: 10.1017/s0317167100002572. [DOI] [PubMed] [Google Scholar]
- Zhang LL, Ashwell KW. Development of the cyto- and chemoarchitectural organization of the rat nucleus of the solitary tract. Anat Embryol (Berl) 2001;203:265–282. doi: 10.1007/s004290000151. [DOI] [PubMed] [Google Scholar]