Abstract
For T1ρ quantification, a three-dimensional (3D) acquisition is desired to obtain high-resolution images. Current 3D methods that use steady-state spoiled gradient-echo (SPGR) imaging suffer from high SAR, low signal-to-noise ratio (SNR), and the need for retrospective correction of contaminating T1 effects. In this study, a novel 3D acquisition scheme–magnetization-prepared angle-modulated partitioned-k-space SPGR snapshots (3D MAPSS)–was developed and used to obtain in vivo T1ρ maps. Transient signal evolving towards the steady-state were acquired in an interleaved segmented elliptical centric phase encoding order immediately after a T1ρ magnetization preparation sequence. RF cycling was applied to eliminate the adverse impact of longitudinal relaxation on quantitative accuracy. A variable flip angle train was designed to provide a flat signal response to eliminate the filtering effect in k-space caused by transient signal evolution. Experiments in phantoms agreed well with results from simulation. The T1ρ values were 42.4 ± 5.2 ms in overall cartilage of healthy volunteers. The average coefficient-of-variation (CV) of mean T1ρ values (N = 4) for overall cartilage was 1.6%, with regional CV ranging from 1.7% to 8.7%. The fitting errors using MAPSS were significantly lower (P < 0.05) than those using sequences without RF cycling and variable flip angles.
Keywords: magnetic resonance imaging, T1ρ, MAPSS, cartilage, osteoarthritis
Noninvasive early detection of cartilage degeneration in osteoarthritis (OA) is of increasing clinical importance. Magnetic resonance imaging (MRI) has been widely used for detecting and monitoring cartilage injuries (1). Recent developments in high field MR (such as the availability of clinical systems with a field strength of 3 T) have further enhanced image spatial resolution and signal-to-noise ratio (SNR) (2). However, conventional MRI is limited to providing primarily morphologic changes of cartilage. Since damage to the collagen-proteoglycan (PG) matrix in cartilage occur early in the course of OA, imaging markers that can probe biochemical changes are essential for early detection of cartilage degeneration. Recent developments in this active field include delayed gadolinium enhanced MRI of cartilage (dGEMRIC) (3–5), T2 (6 –10), and T1ρ (11–16) relaxation time quantification.
The T1ρ parameter describes the spin-lattice relaxation in the rotating frame (17). It reflects the slow motion interactions between motion-restricted water molecules and their local macromolecular environment. The extracellular matrix (ECM) in articular cartilage provides a motion-restricted environment for water molecules. Changes to the ECM therefore may be reflected in measurements of T1ρ. T1ρ relaxation rate (1/T1ρ) has been shown to decrease linearly with decreasing PG content in ex vivo bovine patellae (11) and in trypsinized cartilage (18). In vivo studies have also shown increased cartilage T1ρ values for patients with OA (19,20).
Current T1ρ quantification techniques are based on either two dimensional (2D) fast spin echo (FSE) (21), spiral imaging (16), echo planar imaging (EPI) (22), or 3D gradient echo sequences (20,23). Compared with 2D methods, 3D imaging is free from artifacts caused by slice cross-talk. Therefore 3D sequences can generally have a thinner slice thickness, and consequently may provide a more accurate assessment of cartilage degeneration. High-resolution MRI is particularly attractive in the context of OA, in which cartilage becomes very thin—on the order of or less than 1 mm. Furthermore, a 3D acquisition is desired due to the non-slice-selective nature of the T1ρ preparation pulses (spin-lock pulses). A 3D T1ρ mapping technique has been developed based on a steady-state spoiled gradient echo (SPGR) imaging sequence (23) and has shown clinical promise at both 1.5T (20) and 3T (24). Using this method, however, the energy deposited by the sequence (as estimated by specific absorption rate [SAR]) is intensive because T1ρ preparation pulses are applied every TR. Relatively long TRs (140 ms at 1.5T and 175 ms at 3T) are used to comply with the maximum SAR mandated by the U.S. Food and Drug Administration (FDA). This long TR results in long acquisition times. In addition, this technique requires a prior knowledge of T1 (or an assumption) for T1ρ quantification as T1-dependent steady-state signals are used.
In this study, we propose a pulse sequence to acquire data during the transient signal evolution in a 3D gradient echo sequence right after T1ρ preparation, to overcome the aforementioned shortcomings. Acquisition during transient signal evolution has been applied in magnetization-prepared gradient-echo (MP-GRE) sequences such as snapshot fast low angle shot (FLASH) (25) and the magnetization-prepared rapid gradient-echo (MP-RAGE) (26). These sequences differ from conventional GRE imaging by using a contrast preparation period, a relatively long intershot delay time, and acquiring data while the signal evolves toward the steady state. The contrast generated by the magnetization preparation sequence dominates the resulting image contrast.
Images acquired with different levels of contrast preparation can be fitted to generate quantitative maps. How-ever, there are several potential sources of quantification inaccuracy when using such an acquisition. First, the longitudinal relaxation during data acquisition can degrade the desired contrast and cause quantification deviation (27). Second, signal evolution during the transient stage imposes different k-space weights to each phase encoding step, imparting a filtering effect. This effect can be equivalent to low-pass filtering, resulting in image blurring, or high-pass filtering, resulting in edge enhancement. The characteristics of this filter depends on a number of parameters, including magnitude of the prepared signal, tissue T1 and T2, sequence TR and TE, flip angle, spoiling method, and phase-encoding order. A few strategies have been previously proposed to eliminate these image artifacts in the context of T2-weighted (28) or diffusion-weighted images (27). In this study, two techniques, RF cycling and varying the flip angle train during the acquisition of each segment, are implemented to address these problems in the context of T1ρ quantification.
Thus, the goals of the study were as follows: 1) to develop a fast and reliable 3D T1ρ mapping technique using the strategies discussed above; 2) to investigate the feasibility and reproducibility of applying this technique in vivo at 3T; and 3) to establish baseline values of T1ρ in different regions in femoral-tibial and femoral-patellar joints of healthy volunteers.
MATERIALS AND METHODS
Sequence Design
Magnetization Preparation
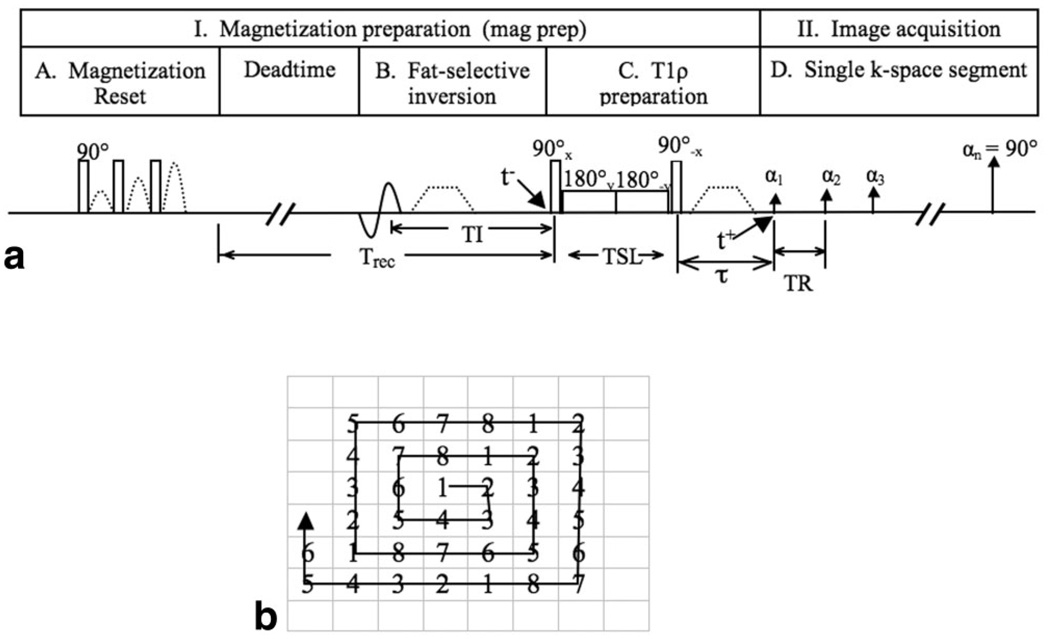
The T1ρ-weighted imaging sequence is composed of two parts: magnetization preparation for the imparting of T1ρ contrast, and a segmented 3D SPGR acquisition immediately after T1ρ preparation during transient signal evolution, as shown in Fig. 1. During magnetization preparation, magnetization reset pulses spoil all longitudinal magnetization. An operator-defined recovery time (Trec) following magnetization reset guarantees that the signal at time t− (right before T1ρ preparation) is the same independent of spin history. Using a fat-selective inversion pulse, fat is nulled at t− after inversion time (TI). T1ρ magnetization preparation is implemented using previously developed spin-lock techniques (16). The spin-lock preparation sequence consists of a hard 90° pulse (with duration of 250 µs) followed by a spin-lock pulse and a hard −90° pulse. The first 90° pulse applied along the x-axis flips the longitudinal magnetization into the transverse plane along the y-axis. Then, a long low-power pulse is applied along the y-axis to spin-lock the magnetization. The duration of this spin-lock pulse, or the time of spin-lock (TSL), determines the amount of T1ρ weighting at time t+. The second 90° pulse flips this spin-locked magnetization back to the z-axis. The phase of the second half of the spin-lock pulse is shifted 180° from the first half to reduce artifacts caused by B1 inhomogeneity (29). Residual transverse magnetization is dephased by a crusher gradient. Magnetization stored along the z-axis is read out immediately by a 3D SPGR acquisition.
FIG. 1.
a: Sequence diagram for T1ρ-weighted imaging using 3D MAPSS. b: k-Space trajectory of the interleaved segmented elliptic-centric acquisition. The numbers stand for the data acquisition segment. VPS = 8 is used to simplify visualization and normally VPS is larger than 8.
Segmented Elliptic-Centric Acquisition
The data is acquired during signal evolution toward steady state. This effectively filters the k-space data, with a different filter imparted for different TSLs. If conventional sequential phase encoding is used, the prepared magnetization may evolve significantly before acquisition of the center of k-space (28,30). Since the overall image contrast is determined primarily by the signal at low frequencies, this evolution may cause image artifact and significant inaccuracies in quantification. It is therefore desirable that the center of k-space is sampled first and immediately after magnetization preparation. In this study, k-space is traversed in a segmented and interleaved elliptic centric order, as illustrated in Fig. 1b. Multiple k-space lines representing a single segment of k-space are acquired per single magnetization preparation, and the center-most k-space lines are acquired at the beginning of each segment. The number of k-space lines acquired per magnetization preparation is defined as views per segment (VPS). The number in Fig. 1b stands for the acquisition in each segment, using VPS = 8 as an example. In practice, VPS is normally much larger than 8. VPS = 8 is used in Fig. 1b to simplify visualization of phase ordering in this interleaved segmented elliptic centric approach.
RF Cycling
For a sequence in which a constant α pulse is applied and there is no RF cycling (shortened as “no cycling” hereafter), the transverse magnetization after the nth α pulse, Mxy(n), can be calculated as:
| [1] |
where Mz (n,−) is the longitudinal signal right before the nth α pulse. It can be calculated based on signal evolving from longitudinal signal right after the n−1th α pulse Mz(n−1, +) as:
| [2] |
The longitudinal signal before first α pulse will be determined by preparation signal:
| [3] |
where τ is the delay between magnetization preparation and signal acquisition, as shown in Fig. 1. Therefore, the transverse signal Mxy(n) after the nth α pulse is given by:
| [4] |
where ,
e1=e−TR/T1 and e2=e−TE/T*2
The second item in the equation is an independent additive component to the signal and will affect quantification accuracy if not corrected.
An RF cycling technique is applied to eliminate T1 contamination in the T1ρ-weighted images (16,27). There are two acquisitions for each phase encoding step. During the second acquisition, longitudinal magnetization is inverted immediately after T1ρ preparation and the flip angle for image acquisition is −α, resulting the transverse signal after the nth α pulse as:
| [5] |
Subtracting Eq. [5] from Eq. [4] yields:
| [6] |
This RF cycling scheme also yields a transient signal evolution that is independent of the prepared magnetization Mprep.
Variable Flip Angle Train Design
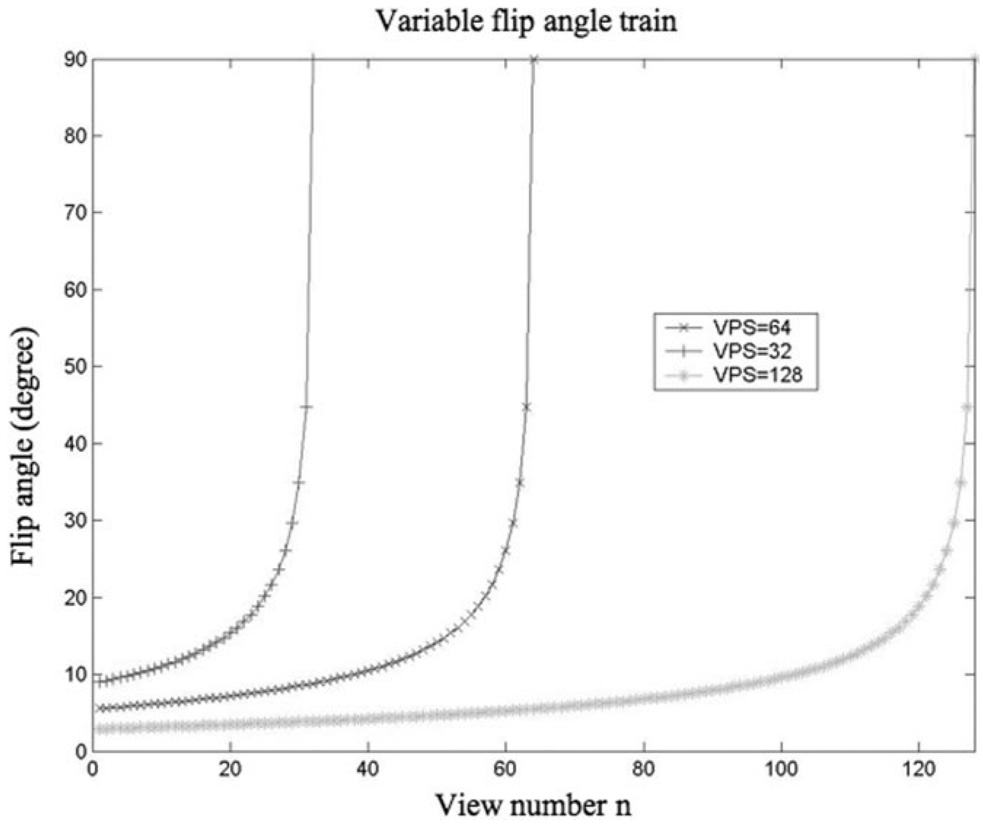
As discussed above, signal evolution during approach to steady state effectively applies a k-space filter to the ideal spatial frequency spectrum. The applied filters properties depend on a number of parameters including magnitude of preparation signal, tissue T1 and T2, sequence TR and TE, flip angle, spoiling method, and phase-encoding order. It has been recognized that utilizing variable flip angles during the sequence is an effective method for controlling the relative signal intensity variation produced by a train of RF pulses (31). The target response in the present sequence is a uniform signal intensity for each phase encoding step to eliminate this k-space filtering effect. Given a tissue T1 and T2, and sequence TR, TE, and Trec (Fig. 1), the signal evolution is calculated based on Bloch equation simulation during each repetition cycle. Then the appropriate flip angle for each α pulse is determined iteratively in order to obtain the desired flat signal intensity. To maximize SNR, the last flip angle is constrained to be 90°. Perfect spoiling—that all transverse magnetization is eliminated at the end of each α pulse cycle—is assumed. The same optimal variable flip angle train is used for each different TSL because the transient signal evolution is independent of the prepared magnetization as discussed in the previous section.
The sequence, as described above, has been given the name 3D magnetization-prepared angle-modulated partitioned-k-space spoiled gradient echo snapshots (3D MAPSS). Simulation was implemented using the following parameters: TR = 9.3 ms, Trec = 1500 ms, VPS = 64, TSL = 0, 10, 40, and 80 ms, assuming T1 = 1240 ms and T1ρ = 45 ms, which are values similar to those of healthy human cartilage at 3T (2).
SNR Efficiency Calculation
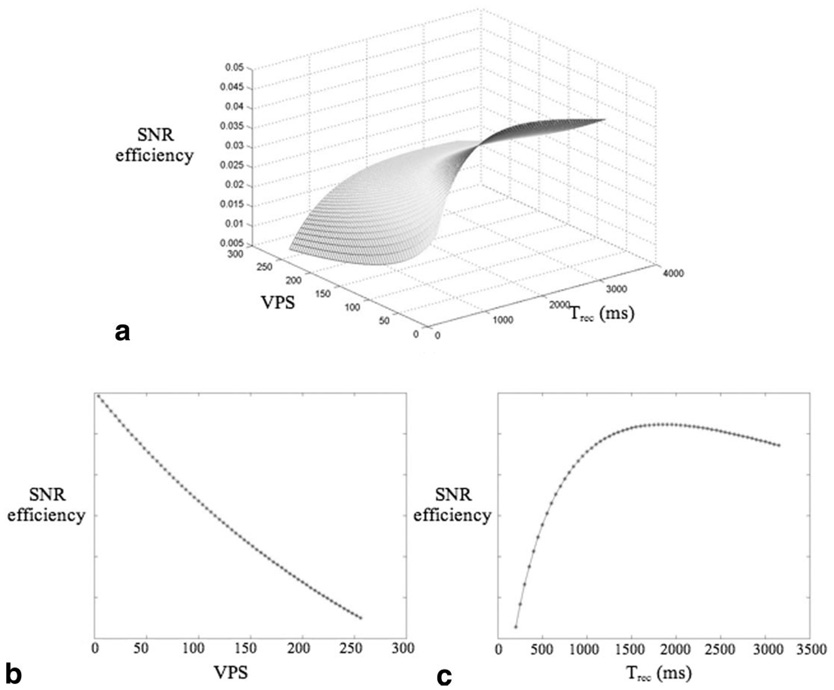
Using the 3D T1ρ MAPSS sequence, the acquisition time and SNR for a given prescribed voxel size, are affected mainly by two operator-defined parameters: VPS and Trec. Lower VPS will generate higher flip angle trains (Fig. 2) and consequently higher SNR, but will also need longer acquisition time. Trec determines the amount of saturation recovery, therefore longer Trec will produce higher SNR but also longer acquisition time. SNR efficiency, defined as mean signal divided by the square root of acquisition time, was simulated with varying VPS (from 4 to 256) and Trec (from 100 ms to 3000 ms). Figure 3a illustrates the 3D plot of SNR efficiency vs. VPS and Trec. The results suggest that shorter VPS provide higher SNR efficiency. To maintain a reasonable scan time, VPS = 64 was used in the following study. Trec = 1500 ms was used, which gives maximum SNR efficiency with VPS = 64. Figure 3b and c are 2D plots of SNR efficiency vs. VPS with Trec = 1500 ms and of SNR efficiency vs. Trec with VPS = 64, respectively.
FIG. 2.
Flip angle trains with different VPS to provide a uniform signal intensity through phase encoding steps. To maximize SNR, the last flip angle is constrained to be 90°.
FIG. 3.
a: SNR efficiency vs. VPS and Trec. b: SNR efficiency vs. VPS, with Trec = 1500 ms. c: SNR efficiency vs. Trec, with VPS = 64. SNR efficiency is in arbitrary units.
SAR Estimation
The SAR for a single pulse used in the sequence was estimated as proposed by Collins et al. (32):
| [7] |
where α is flip angle, τ is duration (in ms), f is a shape factor that equals 1 for a hard pulse or equals the width of the central lobe, as defined by the zero crossing points, for a sinc pulse. SAR (90°, 3), the SAR for a 90° hard pulse with a duration of 3 ms, was estimated as 2.83 W/kg for a sphere model at 3T, four times the value at 1.5T as estimated in Ref. 32 using a head coil. The minimum time delay (TD) between two spin-lock pulses will be determined from the equation:
| [8] |
where SAR(αn, τn) was calculated from Eq. [7] for all pulses in the sequence. Specifically for the MAPSS sequence, it includes the T1ρ preparation sequence (two hard 90° pulses and a spin-lock pulse) and the α pulses in the SPGR sequences. SARFDA is the FDA-mandated maximum SAR level that equals 12 W/kg in 1 g of tissue in the extremities averaged over five minutes. Based on this equation, the required minimum time TD between two spin-lock pulses was 360 ms using the parameters listed below at 3T: a hard 90° pulse duration of 0.3 ms, the longest spin-lock pulse duration of 80 ms, spin-lock frequency of 500 Hz, pulse duration of α pulses of 1.6 ms, and VPS = 64. The TD used in present work was 2095 ms (Trec + TR × VPS = 1500 ms + 9.3 ms × 64) and was much longer than the required minimum value.
Phantom and In Vivo Imaging
All data were acquired on a 3T GE EXCITE scanner (Waukesha, WI, USA) using a quadrature knee coil. A commercial cylindrical T1 phantom (Diagnostic Sonar, Livingston, UK) with known T1 = 950 ms at 3T (close to the T1 of human cartilage) was scanned to investigate the effect of longitudinal relaxation on image quality and quantification. Cylindrical homogeneous agar gel phantoms with different concentration (2% and 4%, weight/volume) were scanned to compare T1ρ quantification with a previously validated sequence (16). The parameters used to image these phantoms were: TR/TE = 9.3 ms/3.7 ms, FOV = 10 cm, in-plane matrix = 256 × 128, slice thickness = 4 mm, bandwidth (BW) = 31.25 kHz, VPS = 64, Trec = 1500 ms, TSL = 0/10/40/80 ms, spin-lock frequency (FSL) =500 Hz. To investigate sequence reproducibility, the phantom with 4% agar was imaged six times, two times at magnet isocenter, two times 50–60 mm right of isocenter, and two times 50–60 mm left of isocenter. The phantom was repositioned between scans. The reproducibility was estimated with coefficients of variation (CV), calculated as the ratio of standard deviation (SD) to average T1ρ. The agar phantoms were also scanned with Trec varying from 500 ms to 2000 ms with an increment of 500 ms to investigate the effect of different Trec times on the T1ρ quantification.
A total of four healthy volunteers (two female, two male, age range = 19–34 years) without any clinical symptoms of OA or other knee injuries were scanned. The protocol included a high-resolution 3D water-excitation SPGR sequence (TR/TE = 15 ms/6.7 ms, flip angle = 12, FOV = 14 cm, matrix = 512 × 512, slice thickness = 1 mm, BW = 31.25 kHz) and T1ρ quantification with and without RF cycling and modulated flip angle train. The parameters for the T1ρ sequences were: TR/TE = 9.3 ms/3.7 ms; FOV = 14 cm, in-plane matrix = 256 × 128, slice thickness = 4 mm, BW = 31.25 kHz, VPS = 64, Trec = 1.5 s, TSL = 0/10/40/80 ms, and FSL = 500 Hz. The number of slices ranged from 22 to 30, depending on the size of the knee. The total acquisition time for the four T1ρ-weighted images was approximately 15 min. All the subjects were scanned twice with repositioning between scans to investigate in vivo reproducibility.
Image Postprocessing
T1ρ-weighted images with varying TSLs were transferred to a Sun workstation (Sun Microsystems, Palo Alto, CA, USA) for offline postprocessing. The T1ρ map was reconstructed by fitting the image intensity pixel-by-pixel to the equation below using a Levenberg-Marquardt monoexponential fitting algorithm developed in-house:
| [9] |
The goodness of fit for each pixel was evaluated using normalized fitting errors defined as:
| [10] |
where yi is the original T1ρ-weighted signal, ŷi the fitted values, n the number of different TSLs used (four in this work), and SD is the background SD in the acquired T1ρ-weighted images. T1ρ-weighted images with the shortest TSL (therefore with highest SNR) were rigidly registered to the high-resolution T1-weighted SPGR images acquired in the same exam using the VTK CISG Registration Toolkit (33). The transformation matrix was applied to the reconstructed T1ρ map.
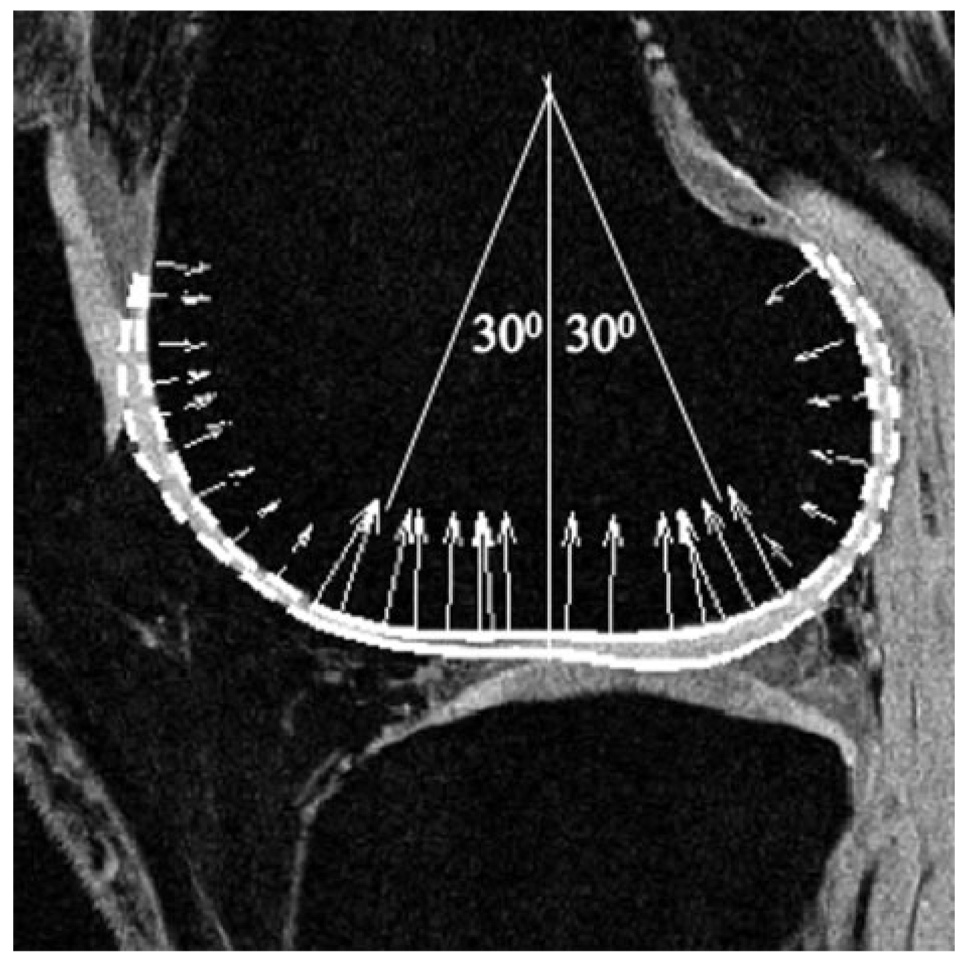
Cartilage was segmented semiautomatically using high-resolution SPGR images with an in-house algorithm based on edge detection and Bezier splines (34). Five regions of cartilage were determined: patellar, lateral femoral condyle (LFC), medial femoral condyle (MFC), lateral tibia (LT), and medial tibia (MT). The LFC and MFC were then further divided into trochlea (trLF and trMF), central (cLF and cMF), and posterior (pLF and pMF) subcompartments. The central portions of the cartilage were defined as those contiguous sections in which the normal vectors of the Splines exhibited a maximal deviation of 30° from the longitudinal axis of the femur as demonstrated in Fig. 4. 3D cartilage contours were generated and overlaid to the registered T1ρ map. T1ρ values (mean ± SD) and normalized fitting errors (mean ± SD) were calculated for different regions of cartilage, as well as for the cartilage as a whole. The in vivo reproducibility was estimated with CV as defined previously of T1ρ values in overall cartilage and in each of the defined compartments.
FIG. 4.
Definition of trochlea, central, and posterior subcompartments in femoral condyles. Solid line: central regions; Dashed line: trochlea (anterior) and posterior regions.
RESULTS
Simulation
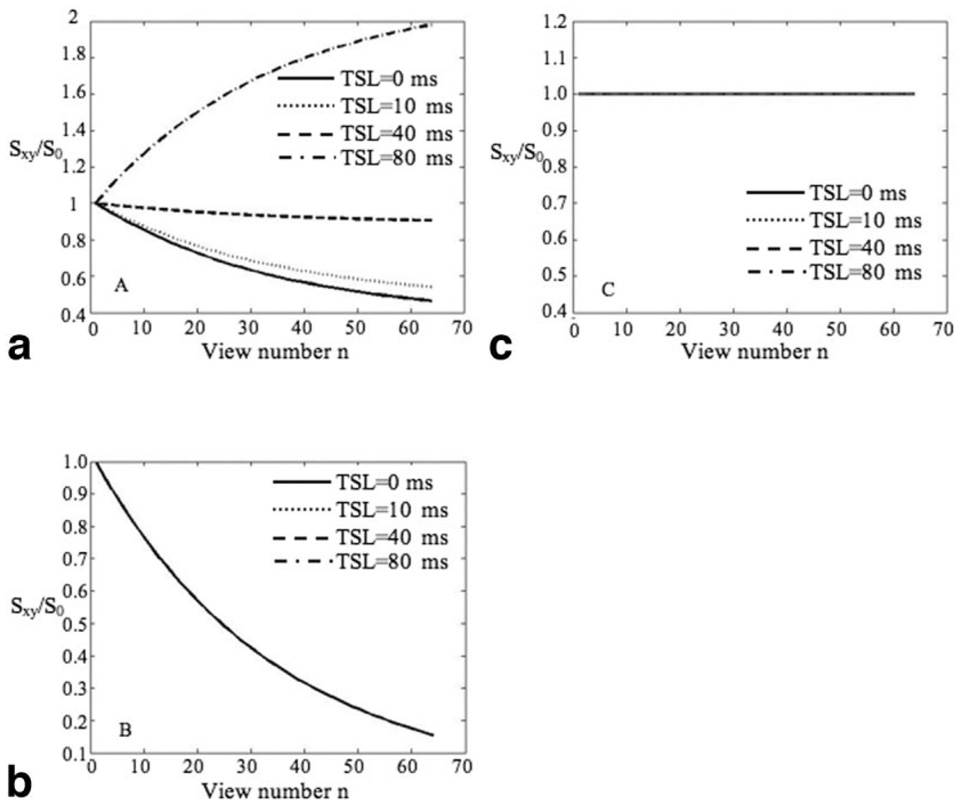
Figure 5 shows signal evolution during the α train for acquisitions without RF cycling (“no cycling”) (Fig. 5a), with RF cycling (“cycling”) (Fig. 5b), and with RF cycling + optimized flip angle (MAPSS) (Fig. 5c). The signal was normalized to that after the first α pulse. Using the “no cycling” acquisition, signal during the segmented SPGR acquisition decreases with TSL = 0, 10, and 40 ms (implying a low-pass filter) and increases with TSL = 80 ms (implying a high-pass filter). Using the “cycling” acquisition, signals with different TSLs experience the same decreasing evolution (after normalizing to the signal after first α pulse). The MAPSS acquisition eliminates this filtering effect by using a modulated flip angle train.
FIG. 5.
Signal evolution (normalized to signal after first α pulse) using “no-cycling” acquisition (a), “cycling” acquisition (b), and MAPSS (c). Using the “no cycling” acquisition, signal decreases with TSL = 0, 10, and 40 ms (implying a low-pass filter) and increases with TSL = 80 ms (implying a high-pass filter). Using the “cycling” acquisition, signals with different TSLs experience the same decreasing evolution. The MAPSS acquisition eliminates this filtering effect by using a modulated flip angle train as shown in Fig. 2.
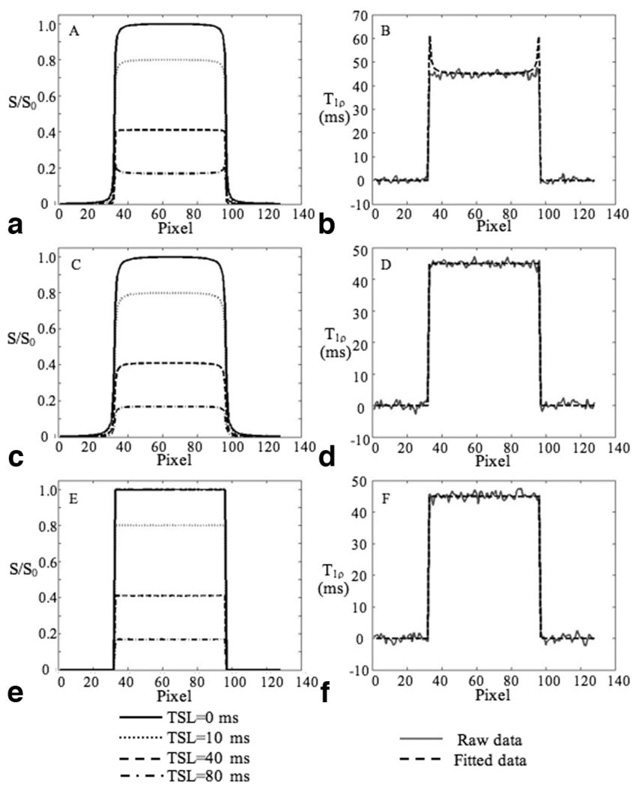
Figure 6 shows the T1ρ-weighted signals (left column) and the fitted T1ρ values (right column) using “no cycling” acquisition (Fig. 6a), “‘cycling” acquisition (Fig. 6b), and MAPSS acquisition (Fig. 6c), respectively. Using the “no cycling” acquisition, the T1ρ-weighted signal shows blurring with TSL = 0, 10, and 40 ms (very slightly), and edge enhancement with TSL = 80 ms. The calculated T1ρ values are artificially high at edges. Using the “cycling” acquisition, the T1 relaxation contamination is eliminated and the fitted T1ρ values are accurate. However, the T1ρ-weighted signal still shows blurring with each TSL. The MAPSS sequence generates T1ρ-weighted signals without any blurring or edge enhancement and quantification inaccuracy has been eliminated.
FIG. 6.
Simulated T1ρ-weighted signals (left column) and the fitted T1ρ values (right column) using “no-cycling” acquisition (a) and (b), “cycling” acquisition (c) and (d), and MAPSS (e) and (f), respectively. Using the “no cycling”’ acquisition, the T1ρ-weighted signal shows blurring with TSL = 0, 10, and 40 ms, and edge enhancement with TSL = 80 ms (a). The calculated T1ρ values are artificially high at edges (b). Using the “cycling” acquisition, the T1 relaxation contamination is eliminated and the fitted T1ρ values are accurate (d). However, the T1ρ-weighted signal still shows blurring with each TSL (c). The MAPSS sequence generates T1ρ-weighted signals without any blurring or edge enhancement (e) and quantification inaccuracy has been eliminated (f).
Phantom
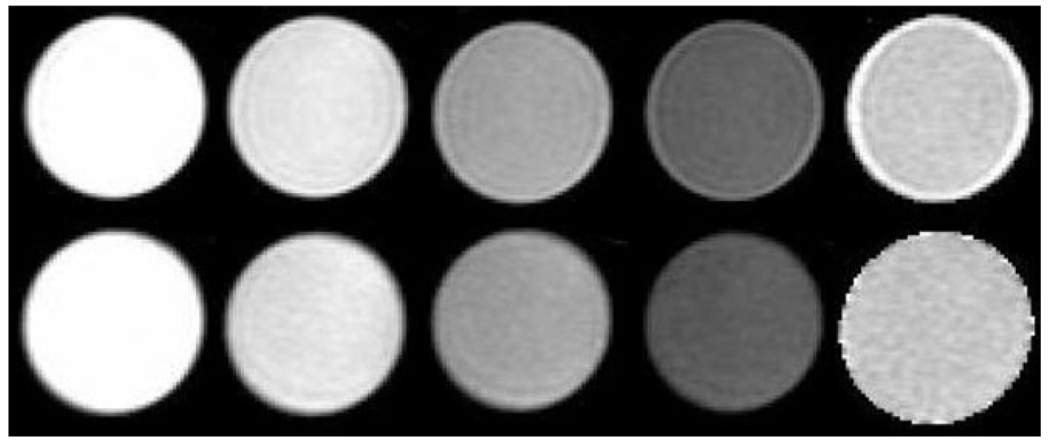
Figure 7 shows the T1ρ-weighted images for the T1 phantom using “no cycling” and MAPSS, respectively. Significant edge enhancement was shown in T1ρ-weighted images with TSL = 80 ms when using “no cycling.” In the images acquired with MAPSS, no obvious edge enhancement or blurring is visualized. Significant elevation of the fitted T1ρ was also observed at the edge of the phantom using “no-cycling” acquisition.
FIG. 7.
T1ρ-weighted images and T1ρ maps using “no-cycling” (upper) and MAPSS acquisition (lower), respectively. From left to right: T1ρ-weighted images with TSL = 0, 10, 40, and 80 ms and the reconstructed T1ρ maps. Significant edge enhancement was seen in T1ρ-weighted images with TSL = 80 ms using “no-cycling” acquisition. No obvious image blurring or edge enhancement was shown in images with MAPSS. Significant elevation of the fitted T1ρ was also observed at the edge of the phantom using “no-cycling” acquisition.
Table 1 shows the T1ρ values of the 4% and 2% agar phantoms, respectively. No significant differences in T1ρ values were found with different Trec. The T1ρ variation was less than 2.5% and 2.0% with Trec ranging from 500 ms to 2000 ms for the 4% and 2% agar phantoms, respectively. The CV for the mean T1ρ of the 4% agar phantom is 0.9%, demonstrating good reproducibility.
Table 1.
T1ρ Values of Agarose Phantoms With Different Trec*
| Trec | 500 ms | 1000 ms | 1500 ms | 2000 ms |
|---|---|---|---|---|
| 2% agar | 78.8 ± 8.2 | 76.9 ± 5.0 | 77.0 ± 3.8 | 76.8 ± 3.0 |
| 4% agar | 44.6 ± 4.2 | 44.4 ± 2.5 | 43.8 ± 1.9 | 43.7 ± 1.7 |
Values are given as mean ± SD.
In Vivo
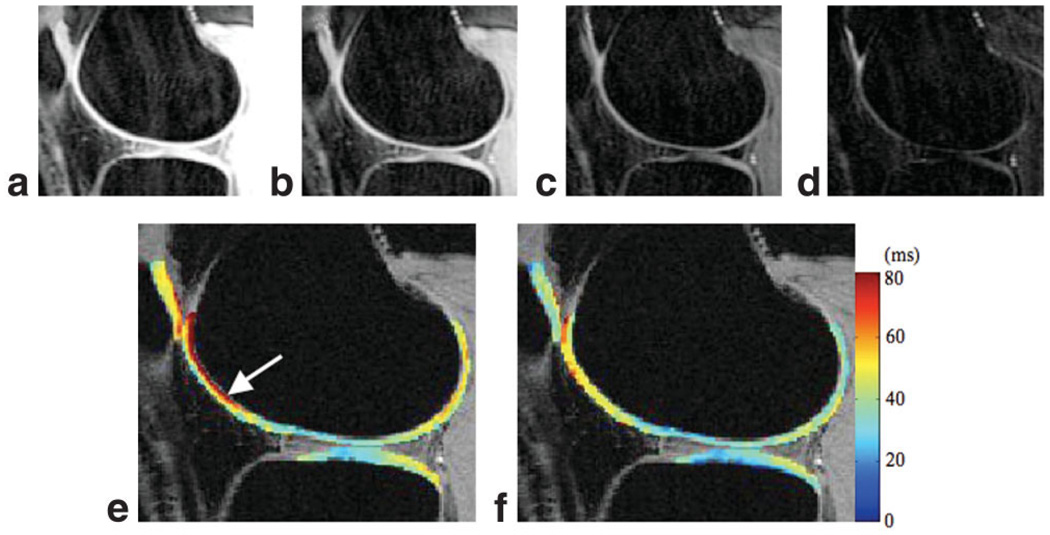
The T1ρ values were 42.4 ± 5.2 ms in overall cartilage for the volunteers, ranging from 36.8 ± 3.2 ms to 43.2 ± 1.3 ms in the nine defined compartments (Table 2). The average CV for mean T1ρ in overall cartilage (global reproducibility) is 1.6%. Regional reproducibility varies between 1.7% and 8.7% (Table 1). Figure 8a–d shows the T1ρ-weighted images in a healthy volunteer with TSL = 0, 10, 40, and 80 ms, respectively. No obvious image blurring or edge enhancement was observed in these images. Figure 8e and f are the fitted T1ρ maps using MAPSS and “no cycling” sequences, respectively. T1ρ values are artificially elevated at the edge of LFC (arrow) in the map acquired with the “no cycling” sequence. No such effect was seen in T1ρ maps generated using MAPSS. The fitting error (normalized to SD of background signal) in overall cartilage and in each of the nine compartments using MAPSS are significantly lower than those using the “no cycling” sequence (1.06 ± 0.08 vs. 2.55 ± 0.35; P < 0.05).
Table 2.
Average T1ρ Values and Coefficients of Variation (N = 4) for Overall Cartilage and in Each Compartment Using MAPSS
| LFC | MFC | |||||||||
|---|---|---|---|---|---|---|---|---|---|---|
| Overall | LT | MT | Patella | |||||||
| TrLF | pLF | cLF | TrMF | pMF | cMF | |||||
| T1ρ(ms)a | 42.4 ± 5.2 | 45.0 ± 6.8 | 41.9 ± 4.2 | 41.1 ± 3.7 | 43.8 ± 6.1 | 42.9 ± 4.0 | 41.2 ± 1.5 | 36.8 ± 3.2 | 40.7 ± 4.2 | 43.2 ± 1.3 |
| CV (%) | 1.6 | 6.0 | 1.7 | 6.4 | 8.7 | 4.8 | 6.4 | 3.0 | 5.8 | 4.1 |
Values are given as mean ± SD.
FIG. 8.
a–d: T1ρ-weighted images in a healthy volunteer using MAPSS. TSL = 0, 10, 40, and 80 ms. e: The reconstructed T1ρ map using “no-cycling” acquisition. f: The reconstructed T1ρ map using MAPSS. Artificially elevated T1ρ values were seen (arrow) in (e).
The T1ρ values in the trochlea and posterior regions are slightly higher than those in the central regions in both LFC (45.0 ± 6.8 ms in TrLF, 41.9 ± 4.2 ms in pLF, vs. 41.1 ± 3.7 ms in cLF) and MFC (43.8 ± 6.1 ms in TrMF, 42.9 ± and 4.0 ms in pMF, vs. 41.2 ± 1.5 ms in cMF). With this small population, no significance was found in these differences.
DISCUSSION
In this study, a 3D T1ρ quantification technique has been developed based on 3D MAPSS. Using the transient signal during evolution toward steady state, this sequence provides a novel fast method for acquiring 3D T1ρ-weighted images.
Using spin-lock techniques, the T1ρ preparation sequence contains long-duration RF pulses and therefore requires more RF power than other conventional MRI sequences. In a previously described T1ρ-weighted sequence based on a steady-state 3D SPGR sequence, the T1ρ preparation is played out every TR (20). The sequence in turn uses a relatively long TR for SAR reduction, and thus requires long acquisition times. In addition, a relatively low spin-lock frequency (300 Hz) and short maximum TSL (32 ms) were used. Using 3D MAPSS, the T1ρ preparation sequence is played out once every segment, followed by a train of α pulses for signal acquisition. A relatively long delay time is used (Trec) for longitudinal recovery after the acquisition of each segment. With Trec as 1.5 s (as used in this study) at 3T, the MAPSS sequence can use spin-lock frequencies up to 1200 Hz with TSLs as long as 80 ms while still maintaining SAR under the maximum SAR mandated by the FDA. A transmit/receive knee coil that covered a smaller volume of tissue than the standard head coil was used in this study. Therefore the SAR calculated with Eq. [7] may overestimate the actual SAR of this sequence. T1ρ values have been shown to increase in osteoarthritic cartilage (16,19,20). Sampling T1ρ decay at long TSL is necessary for accurate fitting for long T1ρ values. T1ρ increases as the strength of the SL field increases, a phenomenon termed T1ρ dispersion (35). T1ρ dispersion may also have tissue specificity (36). The MAPSS sequence allows using a high SL frequency and makes it possible to study T1ρ dispersion in vivo within a wide frequency range.
To quantify a parameter of interest (such as T1ρ, T2) using this magnetization-prepared sequence, it is desirable to acquire the prepared longitudinal magnetization right after the preparation sequence. In the original work of snapshot FLASH proposed by Haase (25), ultrashort TR (3 ms), very small flip angle (<5°), and relatively small phase encoding steps (N = 64) were used. With these sequence parameters, the signal evolution toward steady state was relatively small. Conventional sequential phase encoding was used and images with good quality were obtained on a 40-cm bore 4.7T scanner. However, on a whole-body scanner, the same imaging parameters (ultrashort TR and very low flip angle) will generate images with either relatively low SNR or relatively low resolution (31). In later versions of snapshot sequences, longer TR (approximately 10 ms) and higher flip angles (higher than 10) were normally used to increase signal intensity (28). Using these parameters, there is significant signal evolution following magnetization preparation, depending on both tissue relaxation properties and data acquisition parameters. Thus, acquiring data using centrically reordered phase encoding is critical so that the low spatial frequencies are sampled first (37). The centric readout can be further optimized with interleaved and segmented elliptical centric phase encoding (38,39), also called interleaved square-spiral phase encoding (40), where the centermost regions of k-space are sampled at the beginning of each segment. Thus minimum signal evolution will be present in the center of k-space and image artifact is minimized.
Using this segmented elliptic-centric readout, the signal evolution during data acquisition acts as a filter in k-space, as shown in Fig. 5a. Although it is possible to flatten the signal evolution by using variable flip angle trains, different flip angle trains are needed for different TSLs, which may confound the quantification. An RF cycling technique was implemented in this study. The effects of this cycling technique are two-fold. First, it eliminates the component independent of the prepared magnetization, item B(n) as in Eq [4]. Without RF cycling to eliminate this term, quantification accuracy can be compromised. Second, this RF cycling scheme yields a transient signal evolution that is independent of the prepared magnetization, as shown in Fig. 5b. This makes it possible to obtain a flat signal response by applying the same tailored flip angle train for all TSL’s.
Because there are no contaminating T1 effects in the acquired MAPSS data, prior knowledge of tissue T1 for retrospective correction of these effects, as is required in steady state T1ρ SPGR (20), is not needed with MAPSS. However, to tailor the flip angle train, a T1 for the tissue of interest is assumed. For this study, cartilage T1 was assumed to be 1240 ms based on values published by prior studies (2). Deviation from this assumed T1 value may introduce variations from the desired flat signal profile. Previous published studies have suggested a 10% T1 variation across the cartilage, and no significant changes in osteoarthritic cartilage T1 values (23). Simulation of signal intensity was implemented with T1 values ranging from 1116 to 1364 ms (1240 ms ± 10%) using a tailored flip angle train based on T1 = 1240 ms and VPS = 64. The relative signal intensity variation during approach toward the steady state was less than 5% within this range of T1 values. The impact of this signal trend on actual quantification is expected to be minimal. Muscle in the knee joint has been reported to have T1 values of approximately 1420 ms at 3T, thus no significant quantitative inaccuracies are expected at the interface of cartilage and muscle. However, signal from synovial fluid with T1 values greater than 3 s may blur or otherwise impede into cartilage signal, which may result in artificially high T1ρ values at the cartilage/fluid interfaces. Techniques to suppress fluid signal may help to circumvent this problem.
The T1ρ values obtained using MAPSS are consistent with those obtained with our previously validated sequence based on 2D spiral imaging both in phantoms and in vivo (16). The values are also consistent with those in the literature using steady state 3D SPGR (20) and 2D FSE (21). T1ρ values increase as agarose concentrations decrease in the phantom. The sequence has shown good reproducibility both in phantom (average CV less than 1%) and in vivo (average global CV as 1.6% and regional CV ranging 1.7–8.7%) experiments. The T1ρ values are slightly higher in non-weight-bearing regions than in weight-bearing regions. This spatial variation in the relaxation times may be due to different chemical compositions and/or the different orientation of these regions relative to the external magnetic field B0. Further investigations are needed to fully understand this regional variation in T1ρvalues.
Simulation results have shown that shorter VPS will produce higher SNR efficiency in MAPSS (Fig. 3). In practice, relatively long VPS (64 or higher) needs to be used so that the total scan time is reasonable. Parallel imaging has been used to reduce scan time for T1ρ quantification (38). Using MAPSS, parallel imaging can reduce the total scan time, and/or—when used to reduce VPS—increase SNR efficiency. The current sequence is developed for T1ρ quantification; however, the MAPSS technique can be applied for quantification of other parameters such as T1, T2, and diffusion coefficients.
CONCLUSIONS
A fast and reliable 3D T1ρ quantification technique has been developed in this study based on MAPSS. This sequence provides a fast 3D quantification technique of T1ρ, and potentially of other parameters of interest. Quantitative assessment of the cartilage matrix will enhance our ability to diagnose and monitor cartilage degeneration in OA and other knee injuries. To establish the role of T1ρ quantification in OA, a larger study involving a cohort of healthy controls as well as patients with OA at different stages is warranted in the future.
Acknowledgments
Grant sponsor: National Institutes of Health (NIH); Grant numbers: K25 AR053633; RO1 AR46905.
REFERENCES
- 1.Eckstein F, Burstein D, Link T. Quantitative MRI of cartilage and bone: degenerative changes in osteoarthritis. NMR Biomed. 2006;19:822–854. doi: 10.1002/nbm.1063. [DOI] [PubMed] [Google Scholar]
- 2.Gold GE, Han E, Stainsby J, Wright G, Brittain J, Beaulieu C. Musculoskeletal MRI at 3.0 T: relaxation times and image contrast. AJR Am J Roentgenol. 2004;183:343–351. doi: 10.2214/ajr.183.2.1830343. [DOI] [PubMed] [Google Scholar]
- 3.Bashir A, Gray ML, Burstein D. Gd-DTPA2- as a measure of cartilage degradation. Magn Reson Med. 1996;36:665–673. doi: 10.1002/mrm.1910360504. [DOI] [PubMed] [Google Scholar]
- 4.Bashir A, Gray ML, Hartke J, Burstein D. Nondestructive imaging of human cartilage glycosaminoglycan concentration by MRI. Magn Reson Med. 1999;41:857–865. doi: 10.1002/(sici)1522-2594(199905)41:5<857::aid-mrm1>3.0.co;2-e. [DOI] [PubMed] [Google Scholar]
- 5.Nieminen MT, Rieppo J, Silvennoinen J, Toyras J, Hakumaki JM, Hyttinen MM, Helminen HJ, Jurvelin JS. Spatial assessment of articular cartilage proteoglycans with Gd-DTPA-enhanced T1 imaging. Magn Reson Med. 2002;48:640–648. doi: 10.1002/mrm.10273. [DOI] [PubMed] [Google Scholar]
- 6.Xia Y, Farquhar T, Burton-Wuster N, Ray E, Jelinski L. Diffusion and relaxation mapping of cartilage-bone plugs and excised disks using microscopic magnetic resonance imaging. Magn Reson Med. 1994;31:273–282. doi: 10.1002/mrm.1910310306. [DOI] [PubMed] [Google Scholar]
- 7.Mosher TJ, Dardzinski BJ, Smith MB. Human articular cartilage: influence of aging and early symptomatic degeneration on the spatial variation of T2—preliminary findings at 3 T. Radiology. 2000;214:259–266. doi: 10.1148/radiology.214.1.r00ja15259. [DOI] [PubMed] [Google Scholar]
- 8.Dardzinski BJ, Laor T, Schmithorst VJ, Klosterman L, Graham TB. Mapping T2 relaxation time in the pediatric knee: feasibility with a clinical 1.5-T MR imaging system. Radiology. 2002;225:233–239. doi: 10.1148/radiol.2251011461. [DOI] [PubMed] [Google Scholar]
- 9.David-Vaudey E, Ghosh S, Ries M, Majumdar S. T2 relaxation time measurements in osteoarthritis. Magn Reson Imaging. 2004;22:673–682. doi: 10.1016/j.mri.2004.01.071. [DOI] [PubMed] [Google Scholar]
- 10.Dunn TC, Lu Y, Jin H, Ries MD, Majumdar S. T2 relaxation time of cartilage at MR imaging: comparison with severity of knee osteoarthritis. Radiology. 2004;232:592–598. doi: 10.1148/radiol.2322030976. [DOI] [PMC free article] [PubMed] [Google Scholar]
- 11.Duvvuri U, Reddy R, Patel SD, Kaufman JH, Kneeland JB, Leigh JS. T1rho-relaxation in articular cartilage: effects of enzymatic degradation. Magn Reson Med. 1997;38:863–867. doi: 10.1002/mrm.1910380602. [DOI] [PubMed] [Google Scholar]
- 12.Nugent AC, Johnson GA. T1rho imaging using magnetization-prepared projection encoding (MaPPE) Magn Reson Med. 2000;43:421–428. doi: 10.1002/(sici)1522-2594(200003)43:3<421::aid-mrm14>3.0.co;2-x. [DOI] [PubMed] [Google Scholar]
- 13.Akella SV, Regatte RR, Gougoutas AJ, Borthakur A, Shapiro EM, Kneeland JB, Leigh JS, Reddy R. Proteoglycan-induced changes in T1rho-relaxation of articular cartilage at 4T. Magn Reson Med. 2001;46:419–423. doi: 10.1002/mrm.1208. [DOI] [PubMed] [Google Scholar]
- 14.Makela HI, Grohn OH, Kettunen MI, Kauppinen RA. Proton exchange as a relaxation mechanism for T1 in the rotating frame in native and immobilized protein solutions. Biochem Biophys Res Commun. 2001;289:813–818. doi: 10.1006/bbrc.2001.6058. [DOI] [PubMed] [Google Scholar]
- 15.Mlynarik V, Szomolanyi P, Toffanin R, Vittur F, Trattnig S. Transverse relaxation mechanisms in articular cartilage. J Magn Reson. 2004;169:300–307. doi: 10.1016/j.jmr.2004.05.003. [DOI] [PubMed] [Google Scholar]
- 16.Li X, Han E, Ma C, Link T, Newitt D, Majumdar S. In vivo 3T spiral imaging based multi-slice T(1rho) mapping of knee cartilage in osteoarthritis. Magnetic resonance in medicine. Magn Reson Med. 2005;54:929–936. doi: 10.1002/mrm.20609. [DOI] [PubMed] [Google Scholar]
- 17.Redfield AG. Nucclear spin thermodynamics in the rotating frame. Science. 1969;164:1015–1023. doi: 10.1126/science.164.3883.1015. [DOI] [PubMed] [Google Scholar]
- 18.Regatte RR, Akella SV, Borthakur A, Kneeland JB, Reddy R. Proteoglycan depletion-induced changes in transverse relaxation maps of cartilage: comparison of T2 and T1rho. Acad Radiol. 2002;9:1388–1394. doi: 10.1016/s1076-6332(03)80666-9. [DOI] [PubMed] [Google Scholar]
- 19.Duvvuri U, Charagundla SR, Kudchodkar SB, Kaufman JH, Kneeland JB, Rizi R, Leigh JS, Reddy R. Human knee: in vivo T1(rho)-weighted MR imaging at 1.5 T—preliminary experience. Radiology. 2001;220:822–826. doi: 10.1148/radiol.2203001662. [DOI] [PubMed] [Google Scholar]
- 20.Regatte RR, Akella SV, Wheaton AJ, Lech G, Borthakur A, Kneeland JB, Reddy R. 3D-T1rho-relaxation mapping of articular cartilage: in vivo assessment of early degenerative changes in symptomatic osteoarthritic subjects. Acad Radiol. 2004;11:741–749. doi: 10.1016/j.acra.2004.03.051. [DOI] [PubMed] [Google Scholar]
- 21.Wheaton AJ, Borthakur A, Kneeland JB, Regatte RR, Akella SV, Reddy R. In vivo quantification of T1rho using a multislice spin-lock pulse sequence. Magn Reson Med. 2004;52:1453–1458. doi: 10.1002/mrm.20268. [DOI] [PubMed] [Google Scholar]
- 22.Borthakur A, Hulvershorn J, Gualtieri E, Wheaton A, Charagundla S, Elliott M, Reddy R. A pulse sequence for rapid in vivo spin-locked MRI. J Magn Reson Imaging. 2006;23:591–596. doi: 10.1002/jmri.20537. [DOI] [PMC free article] [PubMed] [Google Scholar]
- 23.Borthakur A, Wheaton A, Charagundla SR, Shapiro EM, Regatte RR, Akella SV, Kneeland JB, Reddy R. Three-dimensional T1rho-weighted MRI at 1.5 Tesla. J Magn Reson Imaging. 2003;17:730–736. doi: 10.1002/jmri.10296. [DOI] [PubMed] [Google Scholar]
- 24.Pakin S, Schweitzer M, Regatte R. 3D-T1rho quantitation of patellar cartilage at 3.0T. J Magn Reson Imaging. 2006;24:1357–1363. doi: 10.1002/jmri.20733. [DOI] [PubMed] [Google Scholar]
- 25.Haase A. Snapshot FLASH MRI. Applications to T1, T2 and chemical shift imaging. Magn Reson Med. 1990;13:77–89. doi: 10.1002/mrm.1910130109. [DOI] [PubMed] [Google Scholar]
- 26.Mugler JP, 3rd, Brookeman JR. Three-dimensional magnetization-prepared rapid gradient-echo imaging (3D MP RAGE) Magn Reson Med. 1990;15:152–157. doi: 10.1002/mrm.1910150117. [DOI] [PubMed] [Google Scholar]
- 27.Coremans J, Spanoghe M, Budinsky L, Sterckx J, Luypaert R, Eisendrath H, Osteaux M. A comparison between different imaging strategies for diffusion measurements with the centric phase-encoded turbo-FLASH sequence. J Magn Reson. 1997;124:323–342. doi: 10.1006/jmre.1996.1025. [DOI] [PubMed] [Google Scholar]
- 28.Williams C, Redpath T. Sources of artifact and systematic error in quantitative snapshot of FLASH imaging and methods for their elimination. Magn Reson Med. 1999;41:63–71. doi: 10.1002/(sici)1522-2594(199901)41:1<63::aid-mrm10>3.0.co;2-f. [DOI] [PubMed] [Google Scholar]
- 29.Charagundla SR, Borthakur A, Leigh JS, Reddy R. Artifacts in T(1rho)-weighted imaging: correction with a self-compensating spin-locking pulse. J Magn Reson. 2003;162:113–121. doi: 10.1016/s1090-7807(02)00197-0. [DOI] [PubMed] [Google Scholar]
- 30.Holsinger A, Riederer S. The importance of phase-encoding order in ultra-short TR snapshot MR imaging. Magn Reson Med. 1990;16:481–488. doi: 10.1002/mrm.1910160315. [DOI] [PubMed] [Google Scholar]
- 31.Mugler Jr, 3rd, Epstein F, Brookeman JR. Shaping the signal response during the approach to steady state in three-dimensional magnetization-prepared rapid gradient-echo imaging using variable flip angles. Magn Reson Med. 1992;28:165–185. doi: 10.1002/mrm.1910280202. [DOI] [PubMed] [Google Scholar]
- 32.Collins CM, Li S, Smith MB. SAR and B1 field distributions in a heterogeneous human head model within a birdcage coil. Specific energy absorption rate. Magn Reson Med. 1998;40:847–856. doi: 10.1002/mrm.1910400610. [DOI] [PubMed] [Google Scholar]
- 33.Rueckert D, Sonoda LI, Hayes C, Hill DL, Leach MO, Hawkes DJ. Nonrigid registration using free-form deformations: application to breast MR images. IEEE Trans Med Imaging. 1999;18:712–721. doi: 10.1109/42.796284. [DOI] [PubMed] [Google Scholar]
- 34.Carballido-Gamio J, Bauer JS, Lee KY, Krause S, Majumdar S. Combined image processing techniques for characterization of MRI cartilage of the knee; Proceedings of the 27th Annual International Conference of the IEEE Engineering in Medicine and Biology Society (EMBS); 1–4 September 2005; Shanghai, China. pp. 3043–3046. [DOI] [PubMed] [Google Scholar]
- 35.Sepponen R. Rotating frame and magnetization transfer. In: Stark DD, Bradley WGJ, editors. Magnetic Resonance Imaging (book) St. Louis: Mosby Year Book; 1992. pp. 204–218. [Google Scholar]
- 36.Borthakur A, Wheaton AJ, Gougoutas AJ, Akella SV, Regatte RR, Charagundla SR, Reddy R, Kneeland JB. In vivo measurement of T1rho dispersion in the human brain at 1.5 Tesla. J Magn Reson Imaging. 2004;19:403–409. doi: 10.1002/jmri.20016. [DOI] [PubMed] [Google Scholar]
- 37.Chien D, Atkinson D, Edelman R. Strategies to improve contrast in turboFLASH imaging: reordered phase encoding and k-space segmentation. J Magn Reson Imaging. 1991;1:63–70. doi: 10.1002/jmri.1880010108. [DOI] [PubMed] [Google Scholar]
- 38.Korin H, Riederer A, Bampton A, Ehman R. Altered phase encoding order for reduced sensitivity to motion corruption in 3DFT MR imaging. J Magn Reson Imaging. 1992;2:687–693. doi: 10.1002/jmri.1880020613. [DOI] [PubMed] [Google Scholar]
- 39.Wilman A, Riederer S. Improved centric phase encoding orders for three-dimensional magnetization-prepared MR angiography. Magn Reson Med. 1996;36:384–392. doi: 10.1002/mrm.1910360309. [DOI] [PubMed] [Google Scholar]
- 40.Stocker T, Shah N. MP-SAGE: a new MP-RAGE sequence with enhanced SNR and CNR for brain imaging utilizing square-spiral phase encoding and variable flip angles. Magn Reson Med. 2006;56:824–834. doi: 10.1002/mrm.21011. [DOI] [PubMed] [Google Scholar]


