Abstract
Electron tomography has become a uniquely powerful tool for investigating the structures of individual cells, viruses, and macromolecules. Data collection is, however, time consuming and requires expensive instruments. To optimize productivity, we have incorporated one of the existing tilt-series acquisition programs, UCSF Tomo, into the well-developed automatic electron microscopy data collection package Leginon to enable fully automatic, sequential tilt series acquisition. Here we describe how UCSF Tomo was integrated into Leginon, what users must do to set up a data collection session, how the automatic collection proceeds, how archived data about the process can be accessed and used, and how the software has been tested.
Keywords: TEM, Cryo-electron microscopy, Electron microscopy, Automation, Tomography
1. Introduction
Electron tomography (ET) is the highest resolution technique available today for observing the 3-D structure of unique biological objects such as cells, many viruses, and certain flexible macromolecules, and is also being used increasingly in various “Materials science” applications (Jensen and Briegel, 2007; Lučić et al., 2005; McIntosh et al., 2005). In ET, a series of projection images is recorded through a specimen with a transmission electron microscope as the specimen is incrementally tilted around one and then sometimes a second axis. Three-dimensional reconstructions, or “tomograms,” are then calculated from such “tilt-series” through back-projection or other reconstruction algorithms. Specimens can be imaged at either ambient or cryogenic temperatures, enabling high-resolution visualization of large volumes of fixed samples (through serial section montaging [Marsh, 2005]) as well as more detailed analysis of smaller samples preserved in a near-native, frozen-hydrated state (Murphy and Jensen, 2005).
While the basic idea of ET has been around for decades (DeRosier and Moore, 1970; Hart, 1968; Hoppe et al., 1968), technical challenges have until recently prevented its widespread use in all but a few dedicated laboratories. Because no goniometer is mechanically perfect and samples are never exactly at eucentric height, as the sample is tilted it moves both laterally and vertically within the column. Instrumental advances such as CCD cameras and electronic controls were therefore needed before software could be written to automatically tilt the sample, apply beam and image shifts to keep the specimen under the beam and its image centered on the CCD, and adjust focus throughout the tilt-series (Koster et al., 1992). A number of software packages for this are now available, including SerialEM (Mastronarde, 2005), TOM (Nickell et al., 2005), Xplore3D (FEI Company), and UCSF Tomo (Zheng et al., 2004), offering a variety of different schemes for data collection and specimen tracking. Tilt-series usually take an hour or two to record, so in a typical working day operators can only acquire a few. Technical problems often ruin tilt-series, requiring additional targets to be found and imaged. Compounding the challenge, many biological questions require the comparison of tens or hundreds of successful tomograms (Briegel et al., 2008; Li et al., 2007). Serial section and montage tomography applications are even more demanding (Marsh, 2005).
Two opportunities for increasing throughput are first to facilitate the process of finding the best targets on a grid, and second, to automate the process of advancing from one target to another during a session. This would free the user from all but the first hour or so of the session when the targets were chosen, and then allow efficient, uninterrupted data collection to proceed through nights and weekends without the constraints of user endurance. Several good packages that assist in the process of target selection and sequential imaging (Lei and Frank, 2005; Oostergetel et al., 1998; Potter et al., 1999; Shi et al., 2008; Suloway et al., 2005; Zhang et al., 2001) have already been developed for single particle imaging, and the SerialEM and TOM tomography packages have already been extended to support sequential tilt-series acquisition. Based on a different idea of how to improve data collection, UCSF Tomo was recently enhanced to produce reconstructions in real-time, allowing operators to evaluate results and adjust their collection strategies accordingly mid-session (Zheng et al., 2007). Here we describe our efforts to integrate UCSF Tomo’s fast, predictive tracking algorithm into Leginon, a well-developed “single-particle” and “2-D crystallographic” automatic data collection package with sophisticated targeting, imaging, management, and querying tools. Our choice to incorporate UCSF Tomo into Leginon is part of a long-term plan to eventually provide a single package (Leginon) that will support all the major three-dimensional electron microscopy data collection protocols (2-D crystallography, single particle analysis, and now tomography) on all the major microscope brands.
2. Integration of UCSF Tomo into Leginon
The Leginon software package (Suloway et al., 2005) is comprised of “nodes,” defined as individual modules capable of performing tasks such as acquiring an image from the microscope or finding a target within an image. In the code, each node is implemented as a separate class, and so can have inheritance relationships with others. Nodes communicate through “events” that deliver information like a particular target location. The types of nodes that are active and the order of events that are transmitted between them define the data collection process, which is also known as an “application.” Existing Leginon applications include, for instance, fully and partially automated single-particle data collection. These applications proceed by first assembling an “atlas” of tiled, low magnification images; searching the atlas for promising regions/targets; and finally recording higher magnification images of each target one after another. The appropriate magnification, beam intensity, and beam shifts for each step are stored as part of data referred to as “presets,” which are analogous to the “states” commonly used in low dose kits.
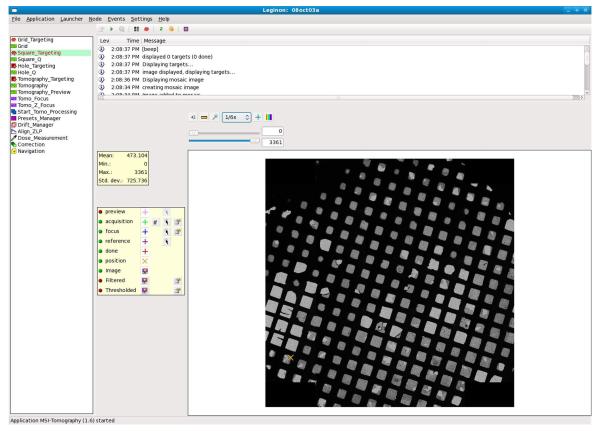
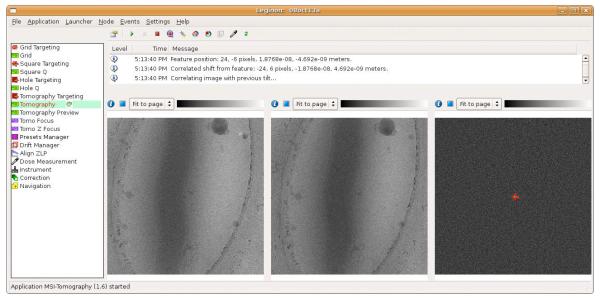
In order to incorporate UCSF Tomo into Leginon, a new application with new graphical user interface elements was created called “MSI Tomography,” endowed with all the same atlas-acquisition and sequential target imaging capabilities of previous Leginon applications. The key difference is that after a series of targets is identified from a low magnification atlas (Fig. 1), instead of recording a single high magnification projection image of each target (like is done for single particle applications), MSI Tomography records an entire tilt series. To accomplish this a new subclass of the existing “Acquisition” node/class was defined named the “Tomography” node/class, which manages the collection of a tilt series. In addition to all the members of its parent Acquisition class, the Tomography class uses five helper classes which were ported directly from UCSF Tomo (Microsoft Visual Studio C++ to Python). The fast performance of the Tomography node was maintained through the use of C/C++ Python extensions and the NumPy and SciPy packages for computationally intense calculations. The Tomography node’s user interface, also adapted from UCSF Tomo, contains three image panels to show the last two images recorded and their cross-correlation (Fig. 2).
Figure 1. Screenshot of MSI Tomography’s graphical user interface during target selection.
General Leginon functions are provided along the top menu. The various Leginon nodes available in the new MSI Tomography application are listed on the left, and a message log records events and alerts in the upper right. Once a specific node is selected (here the Square Targeting node), additional node-specific functions appear on a button bar below the menu and appropriate images appear in the main panel to the lower right, surrounded by further buttons and tools. The tools shown are for selecting and further inspecting potential target, focusing, and reference locations.
Figure 2. Screenshot of MSI Tomography’s graphical user interface during tilt series acquisition.
The Tomography node is selected in the node list (left) to display the newly added user interface. The message log (top center) displays information about the tilt series’ progression, including measurements and predictions. Three image viewers are included as in UCSF Tomo (bottom center): the left image displays the previous tilt image, the center image is the current tilt image, and the right image displays their cross-correlation with a peak identified.
In addition to the new Tomography node, two other nodes, MeasureDose and AlignZeroLossPeak, were added to Leginon as well as a new global position known as the “Reference.” Assuming a large empty hole in the grid is chosen as the Reference, the MeasureDose node can be used to assess long-term fluctuations in beam intensity by acquiring images of the uninterrupted beam. The AlignZeroLossPeak node is also meant to be executed at the Reference position, where it adjusts for slit drifts in Gatan Imaging Filters by calling a DigitalMicrograph (Gatan) script of the same name. Finally, several new web-based viewing tools were written to track the application’s progress and analyze the images and metadata captured in the Leginon database.
3. User Tasks
The main goal of this work was to consolidate all the user tasks into a single, short “setup and target selection” process at the beginning of the data collection session. The process of calibration, preset setup, and multi-scale target selection and imaging are similar to other Leginon MSI applications, where targets are selected in low magnification images and then imaged sequentially at higher magnifications. The following text is not meant to be a user manual, but is intended to give the reader a sense of the workflow and time requirements.
As for the other Leginon applications, the magnitude and direction of the microscope’s actual response to various commands like beam and image shifts and stage movements must be calibrated periodically, especially after the instrument (and in particular the goniometer) is serviced (Suloway et al., 2005). These calibrations can take hours to perform, but are then stored and can be used by all Leginon applications for weeks. Individual data collection sessions begin by setting up the six or more presets that will be used for finding and later re-centering targets, focusing and making other adjustments, and acquiring the actual tilt-series (Table 1). Generally presets are not created de novo, but they are imported from previous experiments and fine-tuned before each session. The electron beam position relative to the specimen and detector changes significantly over time, and therefore requires fine-tuning each time the microscope is used. The intensity of the electron beam also changes over time, and so generally also requires adjustment, especially in presets where dose and beam size are critical. Establishing and fine-tuning the presets usually takes 30-60 minutes, depending on how appropriate and well-adjusted the existing presets already are.
Table 1.
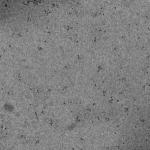
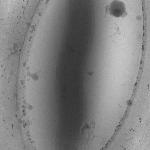
Example presets typically used for ET data collection in Leginon (assumes a 4k × 4k camera)
| Preset name | Atlasa | Grid | Square | Hole |
|---|---|---|---|---|
| Example image | 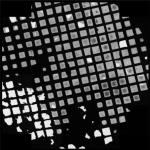 |
 |
 |
 |
| Magnification | - | 100x | 480x | 3kx |
| Size (pixels/side) | - | 512 | 512 | 512 |
| Defocus (μm) | 0 | 0 | 0 | -100 |
| Pixel size after binning (nm) |
- | 840 | 170 | 28 |
| Dose delivered to specimen (e-/Å2) |
negligible | negligible | negligible | <0.01 |
| Field of view (μm/side) |
∼2000 | 430 | 90 | 14 |
| Description/Use | Selecting viable grid squares | Building the atlas | Selecting regions with good holes |
Selecting potential targets and corresponding focus positions |
| Preset name | Tomography Preview | Focus | Tomography | |
|---|---|---|---|---|
| Example image | 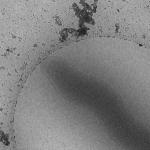 |
 |
 |
|
| Magnification | 22.5kx | 27.5kx | 27.5x | |
| Size (pixels/side) | 1024 | 1024 | 2048 | |
| Defocus (μm) | -20 | - | -10 | |
| Pixel size after binning (nm) |
1.9 | 1.6 | 0.78 | |
| Dose delivered to specimen (e-/Å2) |
<0.25 | 0b | 1-3c | |
| Field of view (μm/side) |
2.0 | 1.6 | 1.6 | |
| Description/Use | Highly defocused to enhance contrast / Final selection and prioritization of targets |
Adjusting defocus and stage z-height |
Acquiring the tilt series |
Atlas is not technically a preset but actually a montage of Grid images.
Focus targets are selected to be out of the specimen area.
Tomography preset dose depends on the tilt series dose and current tilt angle.
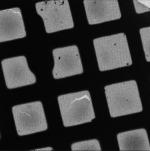
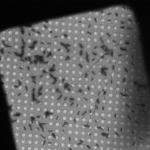
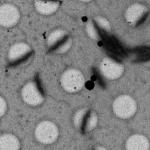
Once the presets are established, targets are selected. Whereas without automation, dose-sensitive cryo-EM targets are typically just “wandered into” and chosen based on limited sampling of the grid, automation allows a user to quickly survey large regions of the grid to find and prioritize the very best available targets. First, an atlas of the entire grid (or at least the region that will still be visible at high tilt) is generated by tiling low magnification (“Grid” preset) images into a montage (Table 1, first column, and Fig. 1). A few of the grid squares with the best ice thickness are then chosen by the user, a higher magnification image of each square is recorded with the “Square” preset, and a rough stage-z-height adjustment is performed. Depending on the size, abundance, and nature of the sample, additional images at progressively higher magnification are then used to find and prioritize the best targets. For micron-long bacterial cells, for instance, promising regions of squares are chosen and the “Hole” preset is then used to obtain images at high enough magnification that the boundaries of individual cells can be seen draped across holes in the carbon support. At this point potential targets are marked for further inspection and the “Tomography Preview” preset is used to record an image of each one, generally at the same or slightly lower magnification as the tilt-series will be acquired, but with much higher defocus to enhance contrast and heavily binned to minimize sample exposure. Tomography Preview images can be used to distinguish, for instance, a virus particle from a liposome, or the extent of cell constriction in a dividing bacterial cell, before time is invested into a tilt-series. In this way users choose the final targets that will be imaged. In addition to the center point of each target, a nearby position is also marked for fine stage-z-height adjustment and focusing. The time required to select targets is highly variable, and has in our experience ranged from one to several hours.
Once targets are selected, but before Leginon begins sequential tilt-series acquisition, the two lower magnification presets (Grid and Square) are dropped and the remaining presets are readjusted. This is done because whenever Leginon moves from one preset to another, it cycles through the entire set of active presets to reduce hysteresis, and unless the lower magnification presets are removed from the list, such cycling would cause the objective lens to be turned on and off frequently. The “Focus” and “Tomography” presets are usually set to the same (high) magnification and are used for focusing and tilt series acquisition, respectively. Compared to the “Tomography” preset, the “Focus” preset uses a more condensed beam for improved contrast, but within a smaller area to make sure the target isn’t exposed prematurely. Thus once the Grid and Square presets are dropped, the objective lens will remain in the “SA” mode for the rest of the session as targets are re-centered and imaged one by one. At this point it can be helpful to let the microscope stabilize for 10-20 minutes, and then after temperatures and currents equilibrate, the objective aperture can be inserted and centered. This second round of preset setup and stabilization usually takes about another half an hour, but then the user can launch sequential tilt-series acquisition and leave.
4. Automatic data collection
Before the first target is imaged and periodically thereafter (for instance every several hours), Leginon adjusts for small fluctuations in the intensity and voltage of the beam. The stage is moved to the Reference position on the grid (usually a large empty hole), and using the Tomography preset the AlignZeroLossPeak node re-centers the energy slit. Then the MeasureDose node re-checks the intensity of the uninterrupted beam so that the exact dose specified by the user is delivered.
Next Leginon moves to the focus position adjacent to the first target and sets the stage-z-height to the gross position estimated previously during target selection. The stage-z-height is now set more precisely by the Focuser node, again by measuring image displacement at two different alpha-axis stage tilts, but this time at higher magnification (Hole preset) and with progressively larger stage tilt. Once the stage is at the eucentric height, the Focuser node further increases the magnification to the Focus preset and adjusts focus and astigmatism by measuring the image displacements induced by electron beam tilt (Koster et al., 1987). Next the stage is moved to the recorded position of the first target and a “targeting” image is recorded using the Hole preset. This image is cross-correlated with the original (Hole) image where the center of the target was marked to assess stage drift and/or errors in stage movement. This process can be repeated as necessary until the desired stage position accuracy is reached (Yoshioka et al., 2007). Up to this point, the various targets are reached by stage movement as would be the case for manual targeting. Here and throughout data collection, the measurement and correction for drift is handled by Leginon’s DriftManager node, which stores cumulative measurements of drift and adds them to target coordinates whenever necessary. Finally, before the tilt series is begun, the backlash that is often released when the stage is first tilted is released. This is done by tilting the stage slightly (for instance to 5°) and then returning the stage to the untilted position in small (for instance 1°) steps. Another (Hole) image is recorded, and the stage movement is compensated for by beam and image shifts to prevent any further (lateral) mechanical movements of the stage. Despite the many images that have already been recorded of the target, because the dose per image in the Hole preset is typically only .01 electrons/Å2, the total dose applied is still essentially negligible.
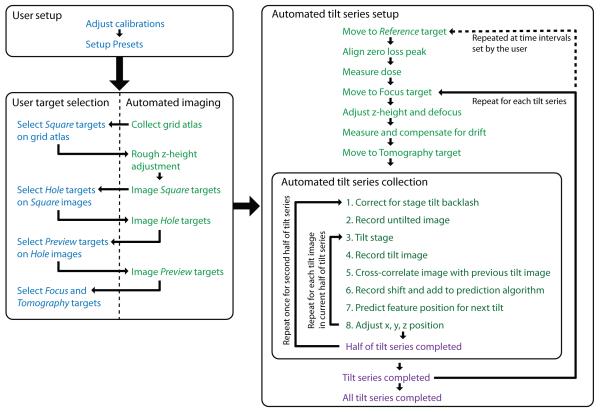
Now that Leginon has recentered the energy slit, calibrated the dose, fine-tuned the stage-z-height, refocused, removed stigmatism, re-centered the target, and released backlash, the actual tilt series begins. As with UCSF Tomo, the first image is recorded with the stage untilted (using the Tomography preset). The stage is then tilted one increment and a second image is recorded. The first two images are cross-correlated, the trajectory of the specimen in x, y, and z is modeled, the specimen is tilted another increment, the predicted beam and image shifts and focus changes are applied, and the next image of the tilt series is acquired. This process continues as the specimen is progressively tilted (Fig. 3), aided by the fact that the number of data points available to model the specimen’s trajectory increases just as the magnitudes of the specimen movements do too at high tilt angles. Unlike UCSF Tomo, the Tomography node of MSI Tomography has the added advantage of being able to load information from previous tilt series stored in Leginon’s MySQL database (see below) to initiate the model for the specimen’s trajectory even before the first tilt. Options are therefore given to initiate the model either with user-defined pre-calibrations or with existing models (like the most recent one recorded at that magnification) stored in the database. In addition, tilt axis angle and offset values that normally are excluded in the model fitting can also be fitted dynamically to assist calibration. After the first half of the tilt-series is recorded, the specimen is returned to the untilted position, re-centered, and the process repeated in the opposite tilt direction. Once the tilt series is completed, the stage is moved to the focus position adjacent to the next target and the entire process repeats until all the targets have been imaged (Fig. 4).
Figure 3. Screenshot of MSI Tomography’s database web interface tool.
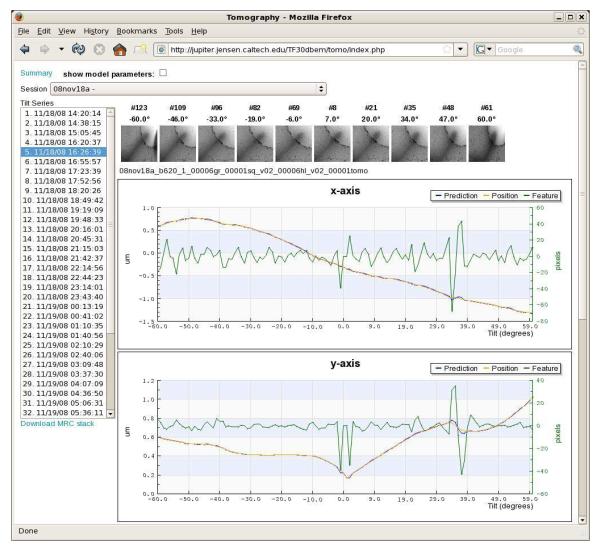
This tool allows users to review previous tilt series or check on the progress of current sessions from any web browser with access to the Leginon webserver. A drop-down list at the top allows the user to select the data collection session of interest (here “08nov18a”). The various tilt series collected during that session then appear as a list on the left. After a specific tilt series is selected (here “11/18/08 16:26:39”), a row of thumbnail images display snapshots of the tilt series at intervals throughout the tilt range to give the observer a visual sense of the target and how well it was tracked. Here, the target was a slender bacterial cell (long grey streak emerging from the bottom left corner of the images) whose tip is suspended over a circular hole in the carbon film. The movement of the specimen and the performance of the tracking algorithm are plotted below the thumbnails. Graphs for z height and image mean value also appear lower on the web page, but are not shown here for lack of space. Links to download an assembled MRC-format image stack (“Download MRC stack”) and display additional graphs of the energy slit and beam intensity change (“Summary”) are also provided.
In the plots, the green “feature” curves show how far away from the center of each image the target appeared (i.e. the tracking errors, in pixels, right vertical axes). The blue “prediction” curves report where the specimen was expected to be within the column as each image was taken, saved during the tilt-series as the total beam shift applied (in microns, left vertical axes). The orange “position” curves show the actual trajectory the specimen traversed (the sum of the beam shifts applied before the image was taken and the actual location of the target observed in the image, in microns, left vertical axes). The x-axes correspond to the tilt angle in degrees. Because the stage is physically re-centered on the target between the first and second halves of the tilt-series and two “untilted” images are recorded, there are actually two “0 plotted next to each other in the center.
In order to understand the relationship of the curves and the order of calculations and events, details of the first few operations shown will be described with reference to the “y-axis” plot, since the changes are large enough there to be followed in the graph. Before the tilt-series is acquired, the target is approximately centered on the CCD using stage shifts. The remaining fine shift needed to precisely re-center the target is done with beam shifts, and that shift is plotted as the first “prediction” point at 0 tilt. In this case the initial beam shift applied in the y-direction was 0.17 microns (blue curve, rightmost of the two adjacent 0° points). This value was considered the “actual” starting position of the specimen in the column as well, so the orange “position” curve begins at the same point. In the first image, the target was assumed to be correctly centered, so the green “feature” curve begins at exactly zero. Before the second image was taken, no predictions were made about how the specimen would move, so no additional beam shifts were applied, and the prediction curve for the 1° image remains flat at 0.17 microns. After the second image was recorded the position of the specimen in the image was measured by cross-correlation, and its deviation from the center (33 pixels) was plotted as the first tracking error (“feature” curve at 1°). The actual specimen position curve was therefore plotted an equivalent distance (0.03 microns) higher (note sign conventions are such that beam shift corrections oppose observed shifts in the images), at 0.2 microns. Given this first shift, a prediction was then made about where the specimen would be after the grid was tilted to 2°. The result was applied as a (modified) beam shift and plotted as the “prediction” (0.22 microns). This prediction proved largely correct, as the target then appeared just 2 pixels above the center of the 2° image (green curve). As a result, the “position” was also plotted as 0.22 microns (orange curve, 2°). Based on this trend, a further beam shift of 0.03 microns was applied before the 3° image was taken (blue curve now at 0.25, 3°), and so forth until the 60° image. The specimen can be seen to have moved quite steadily "up" in they direction, leading to very small tracking errors, until it unexpectedly hooked “down” between 34° and 39°, leading to tracking errors of first 30 pixels in one direction (34° and 35° images) and then 42 pixels in the other (37° image) before the tracking re-stabilized. After the first half of the tilt series was finished, the stage was rotated back to 0° and the target was roughly recentered with stage shifts. The remaining fine shifts needed to precisely recenter the target before the second half of the tilt series appear as the initial beam shifts (0.22 microns, blue and orange curves, leftmost 0° point). Only very slight tracking errors were seen in the second half of the tilt series (negative tilt angles).
Figure 4. Diagram of the workflow for MSI Tomography.
User tasks are shown in blue, automated tasks are shown in green, and completed tasks are shown in purple. User setup usually takes 30-60 minutes. Target selection is semi-automated, and takes one to several hours depending on the nature and number of targets desired. An atlas of the grid is automatically acquired, for instance, and then the user selects a small number of good squares for further inspection. This pattern is repeated at higher magnifications until all the targets are selected and corresponding focus positions are marked. The rest of the process is fully automated. Each tilt series takes 30-60 minutes depending on the number of tilt angles.
There are a few differences between the original UCSF Tomo and its new implementation within Leginon. Perhaps most importantly, because Leginon manages sequential tilt series within a single session and a database is maintained with information from of all previous sessions, previous tracking models can be compared and used as “seeds” in future runs. To correct for the occasionally large stage shifts that can occur when a specimen is highly tilted in a side-entry cryostage, Leginon re-centers targets using iterative stage movements before recording the second half of the tilt-series. Re-centering the target iteratively with stage movements (rather than image and beam shifts) before tilting was also found to make the stage trajectory more consistent. In order to improve cross-correlation performance, images are binned to 512 x 512 pixels and two additional filters are applied: a low-pass filter with a Gaussian kernel of 1.5 and a Wiener filter with an estimated noise 10 times the mean value of the highest 20% of frequencies. An affine transform is used to “untilt” the images along the measured tilt axis. Experience with Leginon has shown that if the same gain reference image is used to normalize two different “raw” images off the CCD, an unhelpful peak can emerge at the origin of their cross-correlation map due to correlations in the gain reference correction itself. As a standard feature, Leginon therefore records multiple dark and bright field reference images and constructs multiple similar, but independent gain reference images, called “channels.” Whenever cross-correlation maps are calculated, different channels are used to correct the images being compared. The gain reference images in Leginon are also not linearly fitted to intensities obtained with increasing exposure times, as they are in UCSF Tomo, but are instead a simple average of a number of images at the same exposure time. Leginon also does not rescale quadrant effects from multi-quadrant cameras like UCSF Tomo. Within the prediction algorithm itself, separate tracking models are used in Leginon in the positive and negative tilt angle ranges to better tolerate differences in goniometer behavior. In order to facilitate recovery from unusual stage movements, a new option for resetting the parameters used in the tracking model at any time during the tilt-series has been included. Finally, while the tilt axis angle and offset are pre-calibrated constants in UCSF Tomo’s stage-movement modeling algorithm, Leginon offers the option of refining these dynamically after each image. When dynamically fitting the tilt axis angle and offset, all the shifts in the tilt series are used to (over-)determine the more complicated prediction model. If, however, dynamic fitting is disabled, only the previous four image shifts are used in the prediction so it can be more sensitive to local variations.
5. Data Archiving
One of the advantages of automation is that it allows individuals and groups to store, organize, and query comprehensive “metadata” about the data collection process as well as the actual images. Leginon, for instance, stores nearly every setting and parameter available about the microscope and the images in a MySQL database. MySQL communication clients are available for a number of platforms and software packages, and tools for interacting with the Leginon database from any web browser with appropriate access have been written in Python, PHP, and Matlab (The MathWorks, Inc.).
As part of this effort, several new web tools have been added to help users monitor tilt-series acquisition and analyze patterns. These are accessed from and organized by a “main” tomography page, which displays all the sessions for which data is available, each of the tilt series in those sessions, and detailed information about whichever tilt series is currently selected (Fig. 3). The information shown includes a set of thumbnail images of the tilt series to verify if the tilt series is progressing correctly; graphs of the actual and predicted stage trajectories in x, y, and z; and the mean counts per image. A link is provided to display the change in energy filter slit position and dose calibration over the entire session. Another link uses a PHP script to dynamically generate an “MRC”-format stack from the individual MRC images stored by Leginon and download it to the users’ workstation.
The persistence of and ease of access to data on almost all aspects of data collection makes the Leginon database a valuable tool not only for development of better methods but also for diagnosing problems with the microscope. It has proven useful, for example, to retrieve and/or graph the x and y displacements measured during the tilt series to evaluate the performance of the trajectory prediction algorithm and test alternative strategies. The trajectory of the specimen also provides insight into the performance of the goniometer. Patterns and shifts can be detected as they gradually or suddenly develop, guiding service and minimizing the time lost to failed data collection when the instrument performance is poor.
6. Example Results
Fully automated, sequential tilt-series acquisition with Leginon has now been performed by two labs, namely the Jensen lab at the California Institute of Technology (http://www.jensenlab.caltech.edu/) and the National Resource for Automated Molecular Microscopy at the Scripps Research Institute (NRAMM, http://nramm.scripps.edu). Most of the tomography data used in Henderson et al., 2007 and in Sharma et al., 2009 were taken with Leginon. At Caltech, Leginon has been used on both an FEI Tecnai T12 and F30 Polara (FEI Company) since early 2006 to record thousands of tilt-series of viruses and cells in vitreous ice. Leginon allowed over 600 tilt series to be attempted on the Caltech Polara in just one month (December 2008). Leginon has collected tilt series with pixel sizes from 2.5-12 angstroms and at 3-12 microns underfocus. Leginon tomography sessions have now run continuously for over 60 hours, including over extended holiday weekends, with the only human interaction necessary being to refill the liquid nitrogen Dewar flask on the microscope every ∼24 hours. Because on the Polara the average time per image of a tilt series is about 30 seconds (not counting the overhead of energy filter adjustment, dose calibration, drift management, and focusing); and tilt series from ±70° at 2° increments (typical for viruses) and ±60° at 1° increments (typical for cells) take 30 minutes and 1 hour, respectively; such multi-day sessions typically produce 50 or more tilt-series (Table 2). Several examples of data collection at Caltech are presented in Table 2 including mean re-centering and tracking errors for each session. Compared to UCSF Tomo, the tilt-series produced by Leginon are of equal quality and take a similar amount of time, but are easier to obtain, since the microscope records one after another through evenings and weekends without user intervention.
Table 2.
Example Leginon tomography session results, parameters and performance For further characterization of Leginon’s ability to re-center targets and UCSF Tomo’s ability to track them during tilt series, please also see Zheng et al., 2004, Zheng et al., 2007, Potter et al., 1999, and Suloway et al., 2005.
| Session name |
Number of tilt series |
Tilt range (°) |
Tilt increment (°) |
Pixel size (nm) |
Defocus (μm) |
Image size (pixels) |
Binning (pixels) |
Time (hours) |
Mean re-centering error (pixels) |
Mean tracking error (pixels) |
|---|---|---|---|---|---|---|---|---|---|---|
| 08sep10a | 71 | -60 to 60 | 1 | 0.96 | -10 | 2048 × 2048 | 2 | ∼32 | 74 ± 54 (n = 65) | 13 ± 26 (n = 7074) |
| 08oct30a | 40 | -60 to 60 | 1 | 0.64 | -12 | 2048 × 2048 | 2 | ∼22 | 164 ± 65 (n = 40) | 13 ± 24 (n = 4880) |
| 09jan04b | 42 | -60 to 60 | 1 | 0.96 | -10 | 2048 × 2048 | 2 | ∼22 | 84 ± 46 (n = 42) | 12 ± 17 (n = 3538) |
Leginon is distributed under the Apache License, Version 2.0 and is available for download from the website http://leginon.org
Acknowledgements
We thank Drs. Bill Tivol, Prabha Dias, Jane Ding, Lu Gan, Ariane Briegel, Elizabeth Wright, Zhou Li and Alasdair McDowall for advice and testing during the development of MSI Tomography. This work was supported in part by NIH grants R01 AI067548 and P50 GM082545 and DOE grant DE-FG02-04ER63785 to GJJ, a Searle Scholar Award to GJJ, the Beckman Institute at Caltech, and gifts to Caltech from the Gordon and Betty Moore Foundation and Agouron Institute. Leginon development at the National Resource for Automated Molecular Microscopy is supported by the National Institutes of Health though the National Center for Research Resources’ P41 program (RR17573 and R01 RR023093).
Footnotes
Publisher's Disclaimer: This is a PDF file of an unedited manuscript that has been accepted for publication. As a service to our customers we are providing this early version of the manuscript. The manuscript will undergo copyediting, typesetting, and review of the resulting proof before it is published in its final citable form. Please note that during the production process errors may be discovered which could affect the content, and all legal disclaimers that apply to the journal pertain.
References
- Briegel A, Ding HJ, Li Z, Werner J, Gitai Z, Dias DP, Jensen RB, Jensen GJ. Location and architecture of the Caulobacter crescentus chemoreceptor array. Mol. Microbiol. 2008;69:30–41. doi: 10.1111/j.1365-2958.2008.06219.x. [DOI] [PMC free article] [PubMed] [Google Scholar]
- DeRosier DJ, Moore PB. Reconstruction of three-dimensional images from electron micrographs of structures with helical symmetry. J. Mol. Biol. 1970;52:355–69. doi: 10.1016/0022-2836(70)90036-7. [DOI] [PubMed] [Google Scholar]
- Hart RG. Electron microscopy of unstained biological material: the polytropic montage. Science. 1968;159:1464–7. doi: 10.1126/science.159.3822.1464. [DOI] [PubMed] [Google Scholar]
- Henderson GP, Gan L, Jensen GJ. 3-D ultrastructure of O. tauri: electron cryotomography of an entire eukaryotic cell. PLoS One. 2007;2:e749. doi: 10.1371/journal.pone.0000749. [DOI] [PMC free article] [PubMed] [Google Scholar]
- Hoppe W, Langer R, Knesch G, Poppe C. Protein-Kristallstrukturanalyse mit Elektronenstrahlen. Naturwissenschaften. 1968;55:333–336. doi: 10.1007/BF00600449. [DOI] [PubMed] [Google Scholar]
- Jensen GJ, Briegel A. How electron cryotomography is opening a new window onto prokaryotic ultrastructure. Curr. Opin. Struct. Biol. 2007;17:260–7. doi: 10.1016/j.sbi.2007.03.002. [DOI] [PubMed] [Google Scholar]
- Koster AJ, van den Bos A, van der Mast KD. An autofocus method for a TEM. Ultramicroscopy. 1987;21:209–222. [Google Scholar]
- Koster AJ, Chen H, Sedat JW, Agard DA. Automated microscopy for electron tomography. Ultramicroscopy. 1992;46:207–27. doi: 10.1016/0304-3991(92)90016-d. [DOI] [PubMed] [Google Scholar]
- Lei J, Frank J. Automated acquisition of cryo-electron micrographs for single particle reconstruction on an FEI Tecnai electron microscope. J. Struct. Biol. 2005;150:69–80. doi: 10.1016/j.jsb.2005.01.002. [DOI] [PubMed] [Google Scholar]
- Li Z, Trimble MJ, Brun YV, Jensen GJ. The structure of FtsZ filaments in vivo suggests a force-generating role in cell division. EMBO J. 2007;26:4694–708. doi: 10.1038/sj.emboj.7601895. [DOI] [PMC free article] [PubMed] [Google Scholar]
- Lučić V, Förster F, Baumeister W. Structural studies by electron tomography: from cells to molecules. Annu. Rev. Biochem. 2005;74:833–65. doi: 10.1146/annurev.biochem.73.011303.074112. [DOI] [PubMed] [Google Scholar]
- Marsh BJ. Lessons from tomographic studies of the mammalian Golgi. Biochim. Biophys. Acta. 2005;1744:273–92. doi: 10.1016/j.bbamcr.2005.04.002. [DOI] [PubMed] [Google Scholar]
- Mastronarde DN. Automated electron microscope tomography using robust prediction of specimen movements. J. Struct. Biol. 2005;152:36–51. doi: 10.1016/j.jsb.2005.07.007. [DOI] [PubMed] [Google Scholar]
- McIntosh R, Nicastro D, Mastronarde D. New views of cells in 3D: an introduction to electron tomography. Trends Cell Biol. 2005;15:43–51. doi: 10.1016/j.tcb.2004.11.009. [DOI] [PubMed] [Google Scholar]
- Murphy GE, Jensen GJ. Electron cryotomography of the E. coli pyruvate and 2-oxoglutarate dehydrogenase complexes. Structure. 2005;13:1765–73. doi: 10.1016/j.str.2005.08.016. [DOI] [PubMed] [Google Scholar]
- Nickell S, Förster F, Linaroudis A, Net WD, Beck F, Hegerl R, Baumeister W, Plitzko JM. TOM software toolbox: acquisition and analysis for electron tomography. J. Struct. Biol. 2005;149:227–34. doi: 10.1016/j.jsb.2004.10.006. [DOI] [PubMed] [Google Scholar]
- Oostergetel GT, Keegstra W, Brisson A. Automation of specimen selection and data acquisition for protein electron crystallography. Ultramicroscopy. 1998;74:47–59. [Google Scholar]
- Potter CS, Chu H, Frey B, Green C, Kisseberth N, Madden TJ, Miller KL, Nahrstedt K, Pulokas J, Reilein A, Tcheng D, Weber D, Carragher B. Leginon: a system for fully automated acquisition of 1000 electron micrographs a day. Ultramicroscopy. 1999;77:153–61. doi: 10.1016/s0304-3991(99)00043-1. [DOI] [PubMed] [Google Scholar]
- Sharma J, Chhabra R, Cheng A, Brownell J, Liu Y, Yan H. Control of self-assembly of DNA tubules through integration of gold nanoparticles. Science. 2009;323:112–6. doi: 10.1126/science.1165831. [DOI] [PMC free article] [PubMed] [Google Scholar]
- Shi J, Williams DR, Stewart PL. A Script-Assisted Microscopy (SAM) package to improve data acquisition rates on FEI Tecnai electron microscopes equipped with Gatan CCD cameras. J. Struct. Biol. 2008;164:166–9. doi: 10.1016/j.jsb.2008.05.011. [DOI] [PMC free article] [PubMed] [Google Scholar]
- Suloway C, Pulokas J, Fellmann D, Cheng A, Guerra F, Quispe J, Stagg S, Potter CS, Carragher B. Automated molecular microscopy: the new Leginon system. J. Struct. Biol. 2005;151:41–60. doi: 10.1016/j.jsb.2005.03.010. [DOI] [PubMed] [Google Scholar]
- Yoshioka C, Pulokas J, Fellmann D, Potter CS, Milligan RA, Carragher B. Automation of random conical tilt and orthogonal tilt data collection using feature-based correlation. J. Struct. Biol. 2007;159:335–46. doi: 10.1016/j.jsb.2007.03.005. [DOI] [PMC free article] [PubMed] [Google Scholar]
- Zhang P, Beatty A, Milne JL, Subramaniam S. Automated data collection with a Tecnai 12 electron microscope: applications for molecular imaging by cryomicroscopy. J. Struct. Biol. 2001;135:251–61. doi: 10.1006/jsbi.2001.4404. [DOI] [PubMed] [Google Scholar]
- Zheng QS, Braunfeld MB, Sedat JW, Agard DA. An improved strategy for automated electron microscopic tomography. J. Struct. Biol. 2004;147:91–101. doi: 10.1016/j.jsb.2004.02.005. [DOI] [PubMed] [Google Scholar]
- Zheng SQ, Keszthelyi B, Branlund E, Lyle JM, Braunfeld MB, Sedat JW, Agard DA. UCSF tomography: an integrated software suite for real-time electron microscopic tomographic data collection, alignment, and reconstruction. J. Struct. Biol. 2007;157:138–47. doi: 10.1016/j.jsb.2006.06.005. [DOI] [PubMed] [Google Scholar]


