Abstract
Purpose
To report a tissue feature-based image registration strategy with explicit inclusion of the differential motions of thoracic structures.
Methods and Materials
The proposed technique started with auto-identification of a number of corresponding points with distinct tissue features. The tissue feature points were found by using the scale-invariant feature transform (SIFT) method. The control point pairs were then sorted into different “colors” according to the organs they reside and used to model the involved organs individually. A thin-plate spline (TPS) method was used to register a structure characterized by the control points with a given “color”. The proposed technique was applied to study a digital phantom case, three lung and three liver cancer patients.
Results
For the phantom case, a comparison with the conventional TPS method showed that the registration accuracy was markedly improved when the differential motions of the lung and chest wall were taken into account. On average, the registration error and the standard deviation (SD) of the 15 points against the known ground truth are reduced from 3.0 mm to 0.5 mm and from 1.5 mm to 0.2 mm, respectively, when the new method was used. Similar level of improvement was achieved for the clinical cases.
Conclusions
The segmented deformable approach provides a natural and logical solution to model the discontinuous organ motions and greatly improves the accuracy and robustness of deformable registration.
Keywords: image-guided radiation therapy, deformable image registration, segmentation
INTRODUCTION
A prerequisite of thoracic radiotherapy planning is the accurate modeling of respiratory motion of thoracic structures(1). Much effort has been devoted to applying various deformable registration models to tackle the problem(2–7). A fundamental deficiency of these approaches is that the differential motion properties of the involved organs are tacitly ignored(8). For example, the two sides of the contact surfaces between the lungs and chest wall behave differently. Recently, some physics-based models have been proposed to describe the respiration motion. Villard et al studied the lung motion based on a continuous mechanics model(9). However, the use of finite element method (FEM) entails a detailed knowledge of the tissues’ mechanical parameters, which are poorly understood. Al-Mayah et al modeled the sliding interaction between the lungs and chest cavities(10). In their work, a single material property was assumed. In reality, the lungs consist of various tissues, such as the trachea, bronchia, and alveoli, etc, which can hardly be uniformly represented by a single material.
In this work we report a new registration strategy with individualized handling of the involved structures. The proposed approach effectively utilizes the inherent tissue feature and affords a natural and logical solution to this difficult problem.
METHODS AND MATERIALS
Background
Let x⃑i and x⃑i′ represent the coordinates of corresponding voxels on the template and target phases, respectively. Suppose that Δx⃑ is the displacement vector between x⃑i and x⃑i′, i.e., x⃑i′ = x⃑i + Δx⃑. The task of four-dimensional computed tomography (4D CT) image registration is to find the displacement vector Δx⃑ for each voxel. To properly model the discontinuity of organ motion at the boundaries of thoracic structures, it is desirable to perform the deformable registration at an individual structure level. For 4D CT, however, region of interest (ROI) segmentation of all phases can be labor intensive and may pose a practical constraint.
Tissue feature identification by using scale-invariant features transform (SIFT) method
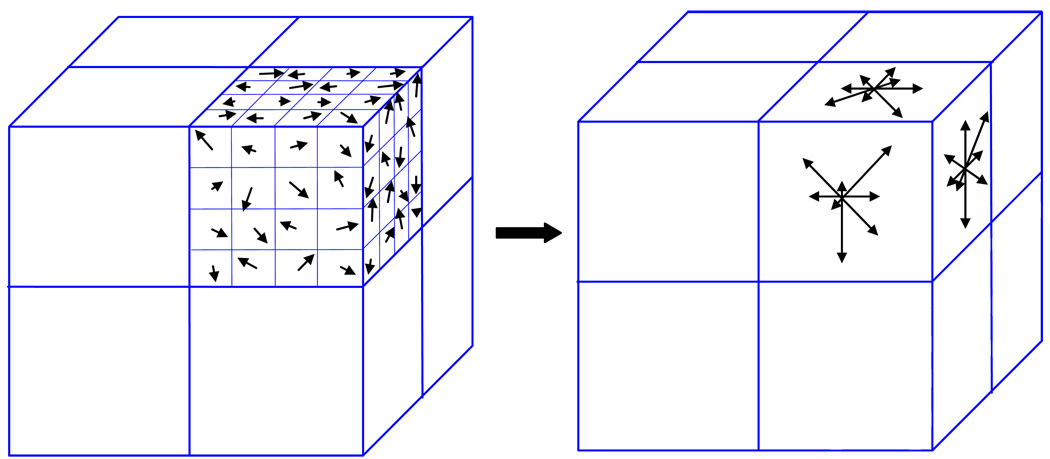
Two important steps in our approach are the identification and association of points with distinct tissue features on two images. This is accomplished by using the SIFT method(11). We extended this approach from two-dimension (2D) to three-dimension (3D). The inherent feature of a point is characterized by using the orientation distribution of intensity gradient vectors in the eight quadrants surrounding the point (containing 8×8×8 voxels). To obtain the histogram for a quadrant (4×4×4 voxels), as illustrated in Fig. 1, the gradient components in three orthogonal directions (x-, y-, z-axis) for each of the 64 voxels in a quadrant were computed. Let I and ∇I represent the intensity and its gradient, the gradient components along x-, y- and z-axis at a voxel (i, j,k) are respectively. For each of the three planes (xy, yz and zx plane), an eight-bin histogram, with the first bin representing the number of voxels whose gradients fall between −22.5° and +22.5°, and so forth, was then constructed. For illustration, the three eight-bin histograms for one of the quadrants are sketched in Fig. 1. A total of 192 vectors were involved for a given point because each quadrant has 24 vectors, with 8 vectors for each plane. The set of 192 vectors characterizes the inherent feature and serves as a signature of the point. The SIFT descriptor is considered as one of the most effective descriptors currently available(12).
Figure 1.
A sketch of orientation histogram in SIFT method.
For a given point, indexed by (i,j,k) in the template image, the least-squares difference of the SIFT descriptor of the point and its potential corresponding point (i′, j′,k′) in the target image, S, was first computed according to
| (1) |
where α indexes the bins of the SIFT histogram. Thereafter two points and in the target phase having the least differences with point (i, j,k) in the template phase were identified. Suppose S1 and S2 are the S values for the two points, and S1<S2. If the ratio κ=S1/S2 is less than 50%, the point that has the least S value is chosen tentatively as the correspondence of the point (i, j,k). Otherwise, no association is made to avoid a potentially wrong correspondence. About 6% of control points are associated based on the κ-ratio. Failure to identify a high fraction of control points may lead to large error of deformable registration, if few control points in each image are identified. The accuracy of the proposed method depends on the number of paired control points. For most cases, 200 paired control points are enough for accurate deformable registration. Commonly more than 3000 control points are auto-identified in each image through parameter adjustment to satisfy the requirement of 200 paired control points. More detailed discussions of the κ-ratio can be found in Ref.13.
Classification of the SIFT-identified control points
The control points auto-identified by the SIFT method were sorted or “colored” according to the organs they reside. It can be assumed that ROI segmentation has already been done on the template phase. This divided the control points on the template phase into different groups. Because the control points on the template and target phases had already been associated by the SIFT, the points on the target phase were “colored” automatically once the sorting on the template phase was done. In this way, the proposed approach eliminates the need for the ROI delineation on the target phases.
A thin-plate spline (TPS) method was employed to establish voxel-to-voxel correspondence of a ROI based on the paired control points. The detailed description of TPS can be found in Refs. 14 and 15.
Performance evaluation
The performance of the proposed technique is demonstrated by using a digital phantom, three lung and three liver cases.
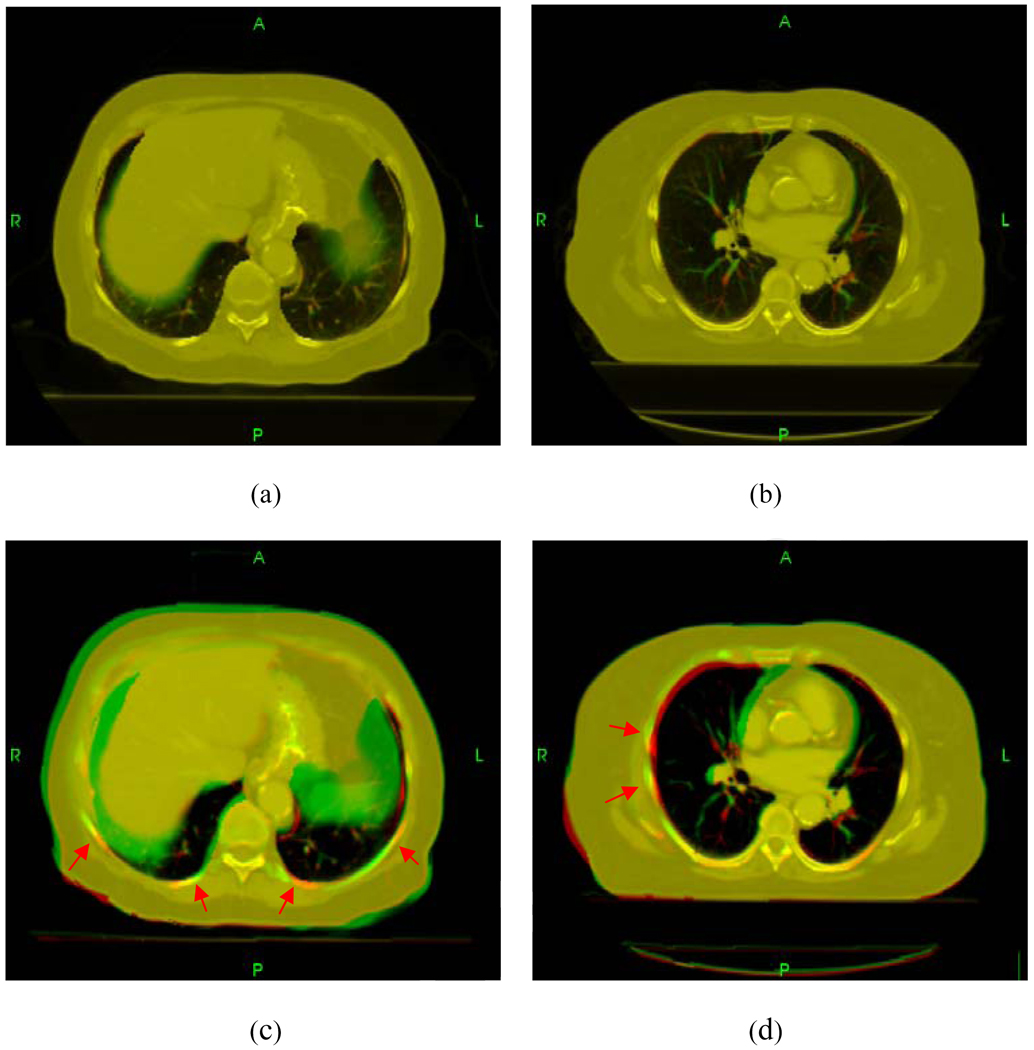
A digital phantom was constructed by using an exhale phase of a patient’s 4D CT image set. To mimic the lung sliding motion against the chest wall, we “stretched” the lungs to generate a hypothetical inhale phase while keeping the chest wall intact. The sliding displacement inside the lungs was equally increased by 0.5 mm per slice starting from the 17th slice from the upper lung along superior/inferior (SI) direction. The original and deformed images are superimposed and shown in Fig. 2a. The proposed and conventional TPS techniques were employed to register the two phases. For fair comparison, the same set of control points identified by SIFT was used in both methods. The conventional registration differs from the proposed one in that the whole image was treated as an entity during the registration calculation.
Figure 2.
Fusion images of the two phases of a digital phantom: before registration (a); after registration using proposed method (b); and after registration using conventional TPS method (c). Unphysical bony structure warping occurs in conventional TPS method as indicated by the red.
Six archived clinical cases were selected to further evaluate the performance of the proposed technique. Each of the patients underwent 4D CT scan with a GE Discovery-ST CT scanner. The collected data were sorted into ten phases.
In the first lung study, the inhale and exhale phases were registered using the two techniques in a similar manner as in the digital phantom study. The registration results and the lung motion behavior were analyzed. For this patient, the phase 1 was also registered to phase 2, 3, …and 10 using the two approaches. The lung contours on the template phase were then mapped to these phases using the obtained deformation fields. The two sets of mapped contours were compared quantitatively with that outlined by the same physician on the target phases. In the second case, the motion behaviors of three representative points located in the upper, middle and lower regions of the lung were investigated. These three points having distinct inherent features were identified visually on all phases as internal fiducial points by an expert in lung anatomy. The motion of the tumor of the third lung patient was studied using two approaches. To quantify the results, the Dice similarity coefficient (DSC) between the mapped and manually tumor outlined contours was calculated(16, 17). The liver motions of the three remaining cases were studied similarly.
RESULTS
Digital phantom experiment
Figure 2b shows the overlay of the template and target images after registration using the proposed approach. For comparison, the resulted of conventional approach, is shown in Fig. 2c. To be quantitative, in Table 1, we list the displacements of 15 representative points obtained using the proposed model together with the known “ground truth” and the results obtained using conventional TPS. In the current implementation, it took about 3 minutes to complete a TPS registration on a PC with a 3GHz CPU once the control points were identified. The identification and association of SIFT points took about 30 seconds.
Table 1.
Displacements of 15 representative points with respect to their original locations at the template phase at different slices.
| Point index | Slice No. | Coordinates of the point (mm) | Known displacement (mm) | Current calculation (mm) | Conventional calculation (mm) |
|---|---|---|---|---|---|
| 1 | 18 | (173.0,223.2,90.0) | (0.0,0.0,1.0) | (0.0,0.0,1.6) | (0.0,1.7,5.0) |
| 2 | 20 | (171.3,219.8,100.0) | (0.0,0.0,2.0) | (0.0,0.0,2.5) | (0.0,1.7,5.0) |
| 3 | 23 | (275.1,199.0,115.0) | (0.0,0.0,3.5) | (0.0,0.0,4.2) | (−1.7,0.0,5.0) |
| 4 | 24 | (263.0,214.6,120.0) | (0.0,0.0,4) | (0.0,0.0,4.6) | (0.0,0.0,5.0) |
| 5 | 28 | (155.7,200.7,140.0) | (0.0,0.0,6.0) | (0.0,0.0,6.4) | (0.0, −1.7,5.0) |
| 6 | 29 | (295.9,164.4,145.0) | (0.0,0.0,6.5) | (0.0,0.0,7.0) | (0.0,0.0,10.0) |
| 7 | 34 | (176.5,174.8,170.0) | (0.0,0.0,9.0) | (0.0,0.0,9.4) | (0.0,0.0,10.0) |
| 8 | 38 | (185.2,160.9,190.0) | (0.0,0.0,11.0) | (0.0,0.0,11.5) | (−1.7,0.0,15.0) |
| 9 | 39 | (176.5,186.9,195.0) | (0.0,0.0,11.5) | (0.0,0.0,12.0) | (0.0,0.0, 15.0) |
| 10 | 40 | (278.6,199.0,200.0) | (0.0,0.0,12.0) | (0.0,0.0,12.6) | (1.7,0.0,15.0) |
| 11 | 43 | (282.1,190.4,215.0) | (0.0,0.0,13.5) | (0.0,0.0,14.1) | (0.0,0.0,15.0) |
| 12 | 43 | (263.0,195.5,215.0) | (0.0,0.0,13.5) | (0.0,0.0,14.1) | (−1.7,0.0,15.0) |
| 13 | 46 | (261.3,180.0,230.0) | (0.0,0.0,15.0) | (0.0,0.0,15.3) | (−1.7,0.0,15.0) |
| 14 | 48 | (282.1,173.0,240.0) | (0.0,0.0,16.0) | (0.0,0.0,16.1) | (0.0, −1.7,20.0) |
| 15 | 52 | (176.5,167.9,260.0) | (0.0,0.0,18.0) | (0.0,0.0,18.1) | (0.0, −1.7,20.0) |
From Table 1 it is clear that the proposed technique models the shear motion of the lungs against the chest wall more adequately and yield improved registration. On average, with the use of the new method, the registration error and the standard deviation (SD) of the 15 points against the known ground truth are reduced from 3.0 mm to 0.5 mm and from 1.5 mm to 0.2 mm, respectively. Because of the segmented treatment of the involved structures, the commonly seen problem of “bone warping” (red arrow in Fig. 2c) is effectively avoided.
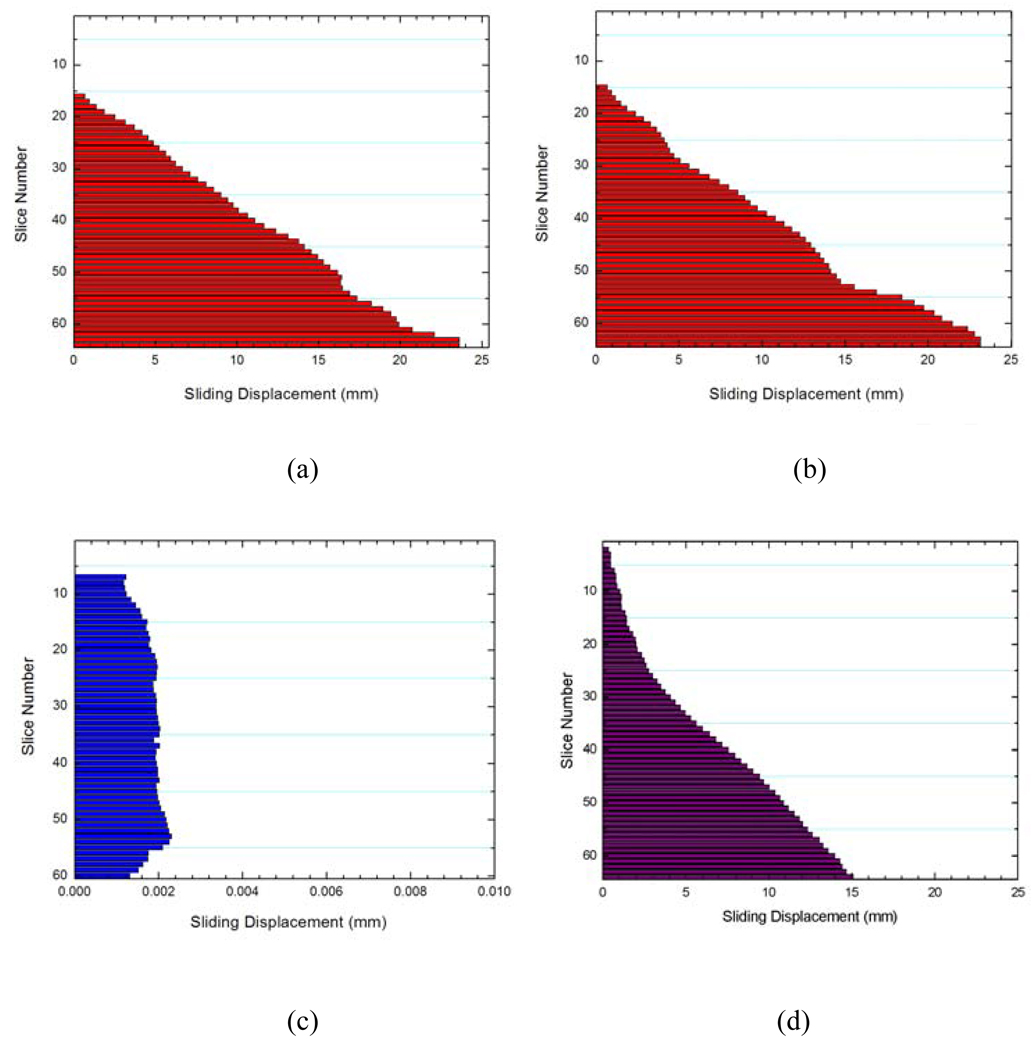
Figure 3 shows the obtained sliding motion of the lungs of different slices using the proposed method (Fig. 3b) and the conventional method Fig. 3c), together with the known displacement (Fig. 3a). The average error between the “ground truth” and the calculated displacement using our method is only 0.5(SD=0.3) mm, whereas it is as large as 1.6(SD=0.5) mm when the conventional method is used.
Figure 3.
Computed sliding motion of the lungs: the “ground truth” displacement introduced in the digital phantom (a); sliding displacement using proposed method (b); and sliding displacement using conventional method (c).
Clinical lung cases
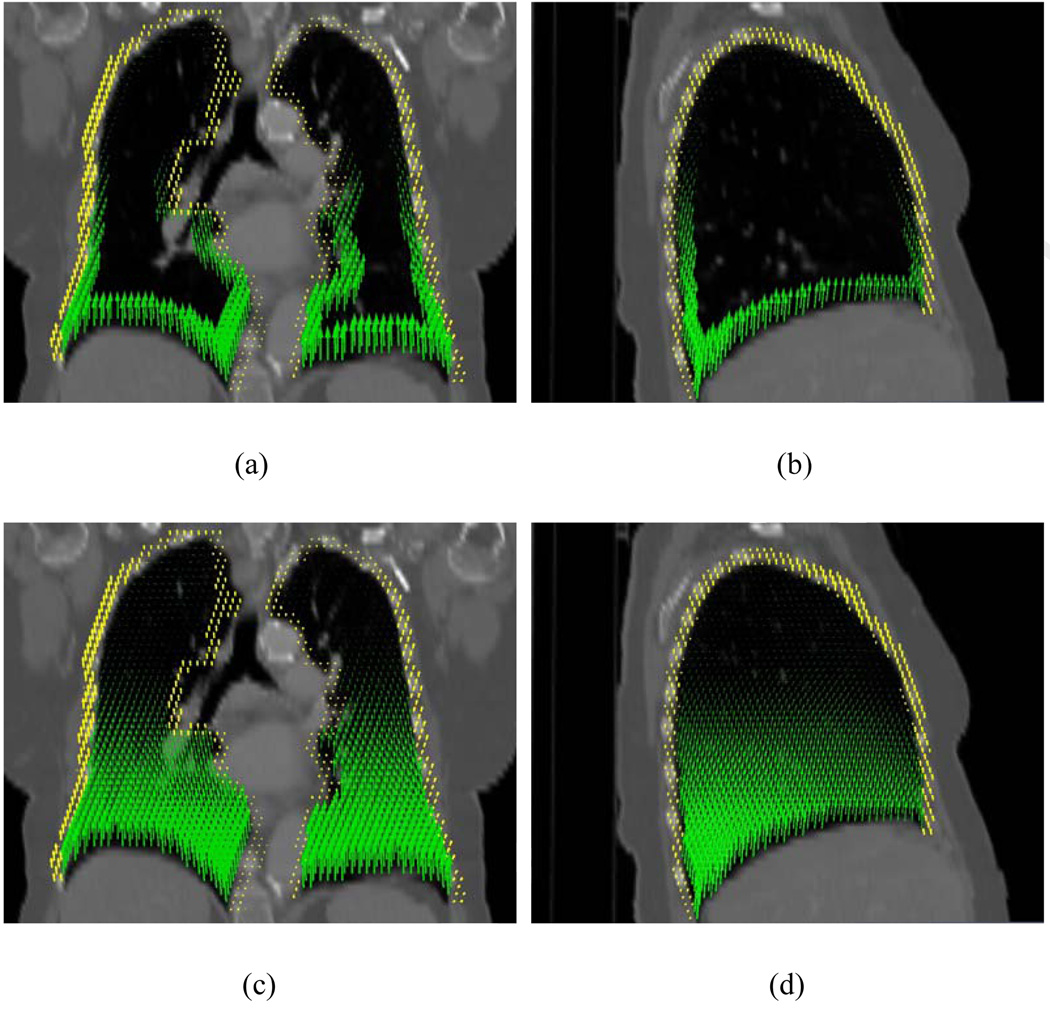
Figure 4 shows the displacements of points in the lungs for the first lung case. The vectors in green and yellow represent the displacement field in the lungs and the chest wall, respectively. Because the chest wall movement is extremely small, for display purpose, the yellow vectors were scaled up by 2500 times. In the inferior regions, the discontinuous displacements on the two sides of the lung surfaces are very pronounced. The sliding displacements of two lungs and the chest wall are plotted in Fig. 5. When using the conventional method, unphysical bony warping appeared in several places (red arrows in Fig. 6).
Figure 4.
Displacement vectors in the peripheral zones of the lungs (a and b) and inside the lungs (c and d). The arrows in these graphs point to the directions of their actual movement when going from inhale to exhale phases. The displacement fields in the lungs and chest wall are represented by green and yellow arrows, respectively.
Figure 5.
Sliding displacements of the left lung (a), right lung (b), and the chest wall (c) using proposed method, as well as the sliding displacements of the lungs and the chest wall using conventional method (d).
Figure 6.
Comparison between the proposed method (top row) and the conventional TPS method (bottom row) for two different axial slices. Unphysical bony structure warping occurs in several regions in conventional TPS registration as indicated by red arrows.
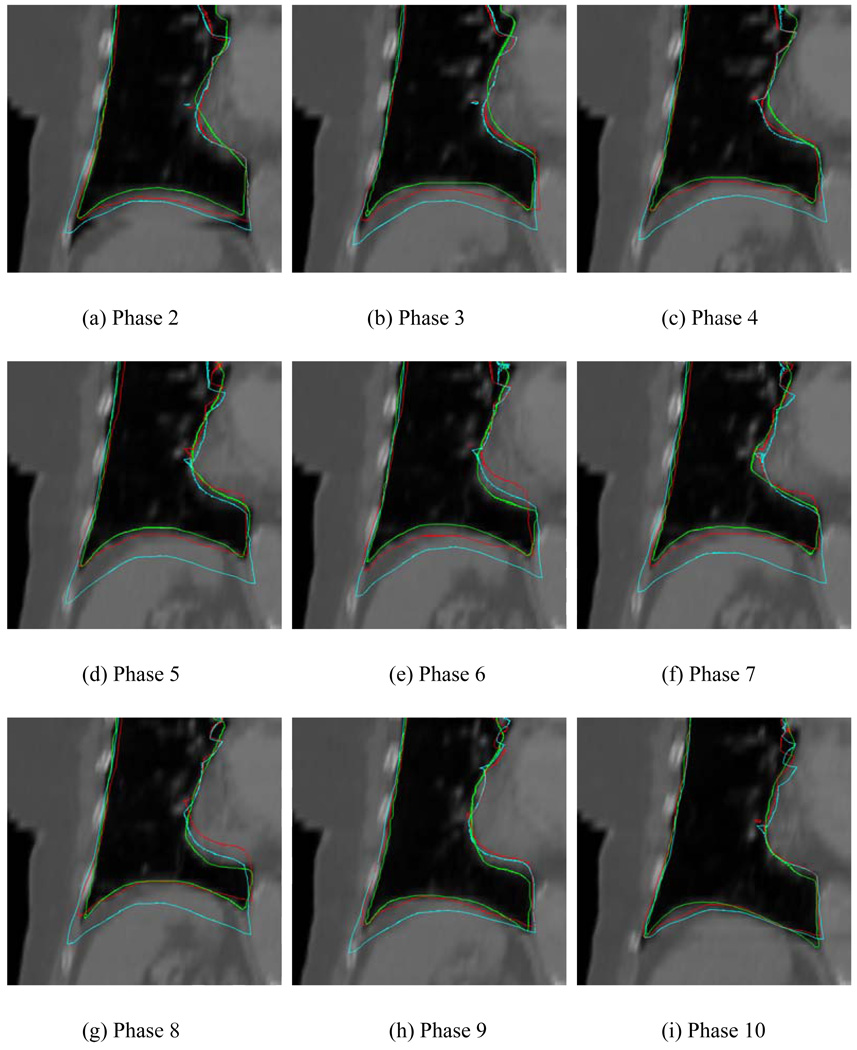
In Fig. 7 we show the mapped contours (red curves) in different phases obtained using the registration matrix between the template phase (phase 1) and the corresponding target phases for the case discussed above. The cyan lines stand for the contours mapped using the conventional method. For comparison, the lungs in the target phases were also manually segmented as shown in Fig. 7 in green. Generally, the diaphragm position changes with the breathing phase. To be quantitative, the SI displacement of the tip of the diaphragm at each phase was computed based on two sets of contours generated by the two registration models. A comparison of the obtained displacement against the value from manual segmentation for the involved phases is summarized in Table 2. The average errors of all phases in our method and the conventional method are 3.3(SD=1.9) mm and 12.1(SD=4.0) mm, respectively. The latter is about 3 times larger than that of the proposed method, emphasizing the importance of organ specific modeling in the thoracic region.
Figure 7.
Contours obtained using different methods on the target phases. The green lines represent the manually segmented contours on the target phases. The red and cyan lines represent the mapped contours derived using the proposed and conventional TPS methods, respectively. The template phase in this figure is phase 1.
Table 2.
Sliding movement of the tip of the diaphragm computed from the proposed and conventional deformable registration methods.
| Phase 2 | Phase 3 | Phase 4 | ||||
|---|---|---|---|---|---|---|
| Distance (mm) |
Error (mm) |
Distance (mm) |
Error (mm) |
Distance (mm) |
Error (mm) |
|
| True value | 13.9 | - | 17.7 | - | 20.4 | - |
| Proposed method | 8.5 | 5.4 | 13.4 | 4.3 | 17.7 | 2.8 |
| Conventional method | 5.7 | 8.2 | 5.7 | 12.0 | 7.8 | 12.6 |
| Phase 5 | Phase 6 | Phase 7 | ||||
|---|---|---|---|---|---|---|
| Distance (mm) |
Error (mm) |
Distance (mm) |
Error (mm) |
Distance (mm) |
Error (mm) |
|
| True value | 23.9 | - | 25.8 | - | 24.5 | - |
| Proposed method | 19.3 | 4.6 | 19.4 | 6.3 | 22.8 | 1.7 |
| Conventional method | 6.7 | 17.2 | 10.6 | 15.2 | 8.7 | 15.9 |
| Phase 8 | Phase 9 | Phase 10 | ||||
|---|---|---|---|---|---|---|
| Distance (mm) |
Error (mm) |
Distance (mm) |
Error (mm) |
Distance (mm) |
Error (mm) |
|
| True value | 25.8 | - | 1.65 | - | 10.9 | - |
| Proposed method | 24.5 | 1.3 | 15.0 | 1.5 | 8.8 | 2.0 |
| Conventional method | 12.1 | 1.37 | 7.0 | 9.5 | 6.0 | 4.8 |
Generally, the TPS registration depends on the number and locations of the control points, especially when the number of points is small. In our work, since a substantial number of control points were involved (there were ~300 control points in the lungs and ~600 points in the chest wall, and these points were distributed more or less uniformly), the results did not change much as the points inside the lungs was reduced even by ~1/3 on a random basis. The overwhelming number of control points in the chest wall region tends to “stretch” the lungs toward superior direction, leading to large inaccuracy in the inferior regions. As we took ~95% of the chest wall points out, the situation was improved and the diaphragm approached to the segmented registration. In the extreme case when all chest wall points were taken out, as expected, the result became identical to that obtained using the proposed approach.
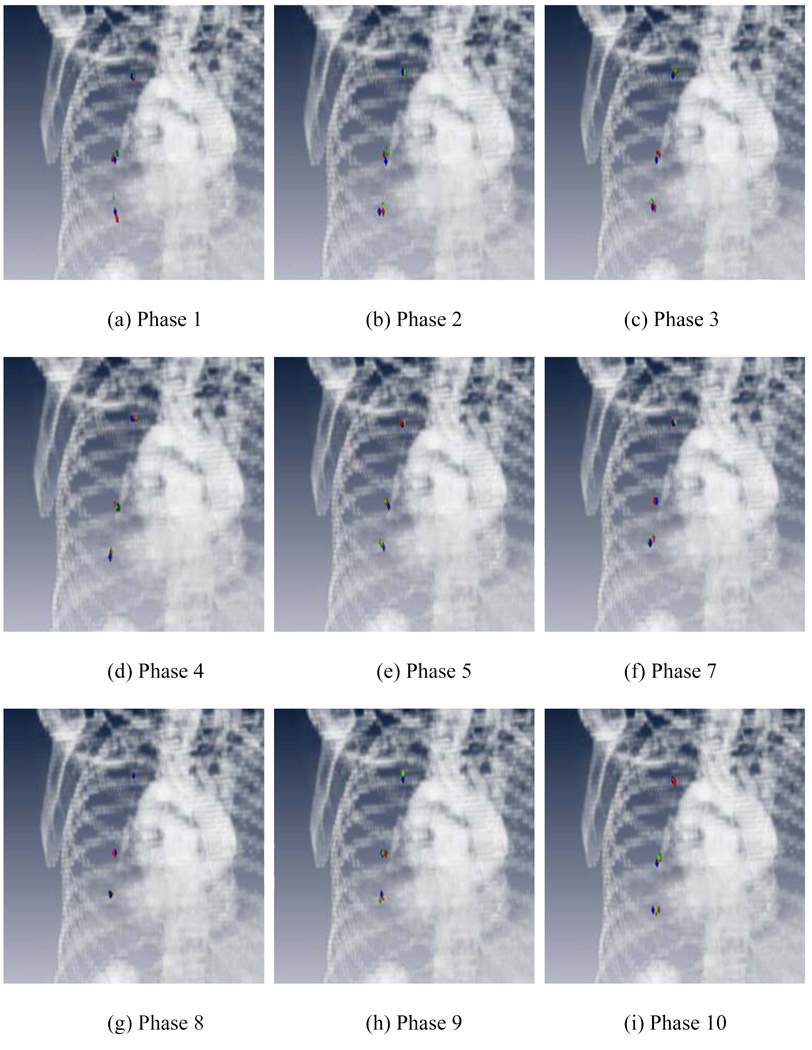
For the 2nd case, we tracked the movements of three representative points with distinct features using different registration methods. It is important to note that these points represent only three out of numerous points inside the lung and, while informative, obtaining the motion trajectories of these three points may not be sufficient to get a full picture of the breathing problem and to resolve the small difference of the internal lung tissue motion at different locations. Figure 8 shows the locations of the three points at each phase resulted from each of the registration methods, along with the “ground truth” (blue points). The template phase in this study is phase 6. The red and green points stand for the results mapped from phase 6 using the proposed and conventional methods, respectively. The coordinates of the points in different phases are listed in Table 3. The average error of our method was 2.3(SD=1.6) mm, whereas the average error of conventional approach was found to be 5.1(SD=3.5) mm.
Figure 8.
Locations of three points with distinct features. The blue points are manually identified on each of the target phases. The red and green points stand for the mapped results by the proposed and conventional methods, respectively. The template phase in this figure is phase 6.
Table 3.
Sliding movement of three points with distinct features for the 2nd patient.
| First point | Ground truth coordinates (mm) | Coordinates obtained using the proposed method (mm) | Error in distance (mm) | Coordinates obtained using the conventional method (mm) | Error in distance (mm) |
|---|---|---|---|---|---|
| Phase 1 | (285.5,167.9,160.0) | (286.0,168.7,165.0) | 1.0 | (282.8,168.7,170.0) | 10.4 |
| Phase 2 | (283.8,167.9,160.0) | (283.6,168.0,165.0) | 0.2 | (282.0,166.4,170.0) | 10.3 |
| Phase 3 | (282.1,166.1,165.0) | 282.8,166.4,165.0) | 0.8 | (282.8,167.2,170.0) | 5.2 |
| Phase 4 | (282.1,166.1,165.0) | (286.0,164.0,165.0) | 4.5 | (283.6,165.6,170.0) | 5.3 |
| Phase 5 | (282.1,167.9 ,165.0) | (284.4,166.4,170.0) | 2.8 | (286.0,164.0,170.0) | 7.4 |
| Phase 7 | (283.8,167.9,170.0) | (286.0,167.2,170.0) | 2.3 | (286.0,171.1,170.0) | 3.9 |
| Phase 8 | (283.8,169.6 ,170.0) | (286.0,168.0,170.0) | 2.7 | (284.4,169.5,170.0) | 0.6 |
| Phase 9 | (285.5,173.0,170.0) | (283.6,169.5,170.0) | 4.0 | (286.0,171.1,170.0) | 2.0 |
| Phase 10 | (283.8,169.6,160.0) | (283.6,167.2,160.0) | 2.4 | (283.6,164.0,165.0) | 7.5 |
| Second point | Ground truth coordinates (mm) | Coordinates obtained using the proposed method (mm) | Distance error (mm) | Coordinates obtained using the conventional method (mm) | Distance error (mm) |
|---|---|---|---|---|---|
| Phase 1 | (275.1,207.7,110.0) | (273.3,209.9,105.0) | 2.9 | (275.7,213.1,125.0) | 16.0 |
| Phase 2 | (278.6,207.7,115.0) | (275.7,209.2,115.0) | 3.3 | (274.1,211.5,120.0) | 7.8 |
| Phase 3 | (275.1,209.4,120.0) | (275.7,209.9,115.0) | 0.8 | (277.3,210.7,120.0) | 2.5 |
| Phase 4 | (276.9,209.4,120.0) | (275.7,209.9,125.0) | 1.3 | (274.1,209.9,125.0) | 5.7 |
| Phase 5 | (275.1,209.4,125.0) | (277.3,209.9,130.0) | 2.2 | (277.3,208.4,130.0) | 5.5 |
| Phase 7 | (276.9,212.8,130.0) | (274.1,212.3,135.0) | 2.8 | (276.5,213.9,130.0) | 1.1 |
| Phase 8 | (276.9,212.8,130.0) | (276.5,213.1,130.0) | 0.5 | (277.3,212.3,130.0) | 0.7 |
| Phase 9 | (275.1,212.8,130.0) | (274.1,211.5,125.0) | 1.7 | (277.3,211.5,125.0) | 5.6 |
| Phase 10 | (276.9,209.4,115.0) | (270.9,213.1,115.0) | 7.0 | (273.3,209.9,110.0) | 6.2 |
| Third point | Ground truth coordinates (mm) | Coordinates obtained using the proposed method (mm) | Distance error (mm) | Coordinates obtained using the conventional method (mm) | Distance error (mm) |
|---|---|---|---|---|---|
| Phase 1 | (249.2,216.3,235.0) | (248.0,215.5,235.0) | 1.5 | (248.0,209.2,235.0) | 7.3 |
| Phase 2 | (250.9,209.4,235.0) | (250.3,209.9,235.0) | 0.8 | (249.6,209.2,230.0) | 5.2 |
| Phase 3 | (250.9,209.4,235.0) | (248.8,209.9,240.0) | 2.2 | (248.0,207.6,240.0) | 6.1 |
| Phase 4 | (250.9,209.4,240.0) | (249.6,209.2,240.0) | 1.4 | (248.8,207.6,240.0) | 2.8 |
| Phase 5 | (250.9,209.4,240.0) | (252.7,206.8,240.0) | 3.2 | (249.6,209.9,240.0) | 1.5 |
| Phase 7 | (250.9,209.4,240.0) | (250.3,210.7,240.0) | 1.5 | (248.8,209.2,240.0) | 2.2 |
| Phase 8 | (249.2,211.1,240.0) | (249.6,209.2,245.0) | 2.0 | (249.6,211.5,240.0) | 0.6 |
| Phase 9 | (250.9,209.4,235.0) | (249.6,210.7,240.0) | 1.9 | (250.3,209.9,240.0) | 5.1 |
| Phase 10 | (249.2,216.3,235.0) | (249.6,210.7,235.0) | 5.6 | (249.6,213.1,235.0) | 3.2 |
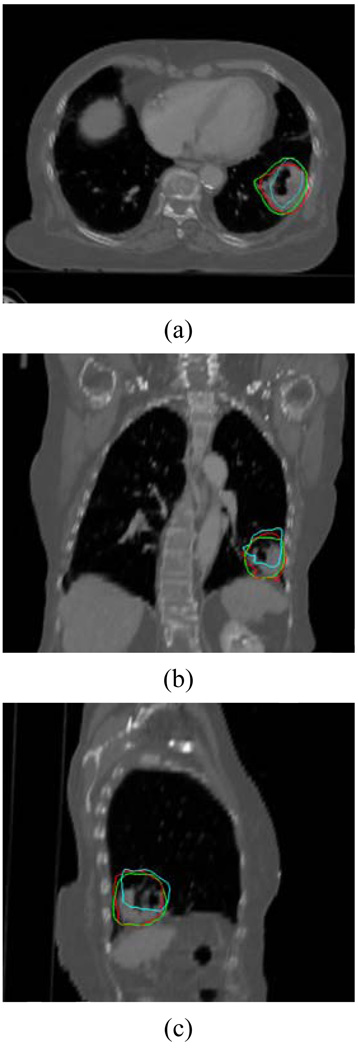
Finally, the proposed technique was applied to study the movement of a lung tumor in the 3rd clinical case (Fig. 9). The green lines represent the physician outlined contours on the target phase. The red and cyan lines represent the mapped contours using the proposed and conventional methods, respectively. The DSC to the physician’s delineations for the two methods were 91.3% and 74.0%, respectively, indicating that our method is better than the conventional method in dealing with the lung deformation.
Figure 9.
Mapping of a lung tumor using the proposed and conventional approaches. The green line represents the manual delineation on the target phase, the red and cyan lines represent the mapped contours from the template phase using the proposed and conventional methods, respectively.
Clinical liver cases
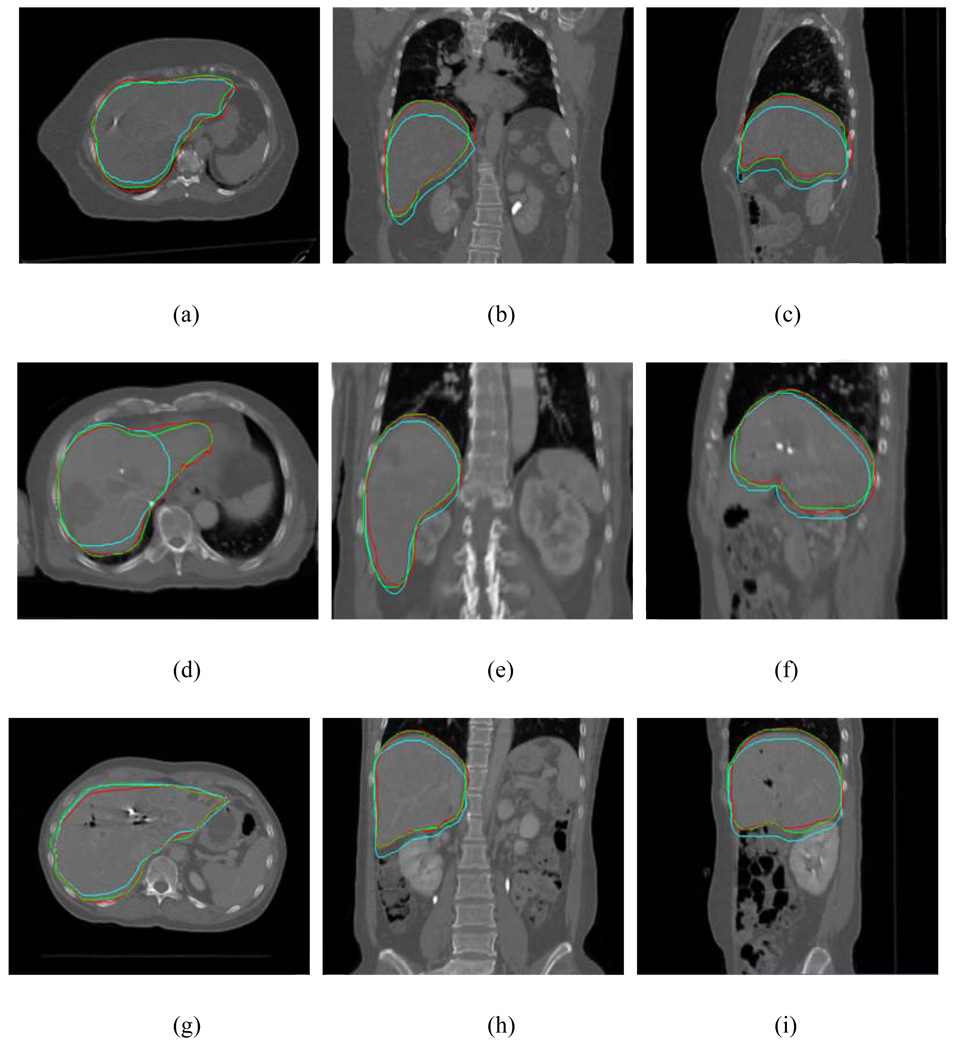
To further illustrate the application of the proposed method and its efficiency, the liver contours on the exhale phase for three cases are shown in Figure 10. Each row displays the results for one of the cases. The mapped contours from the inhale phase using the deformation field were plotted in red, together with the manually outlined contours in green. For comparison, the original contours on the inhale phase were also mapped rigidly to the exhale phase (cyan curves). It is seen from Fig. 10 that the proposed approach is capable of correctly propagating the original contours from the inhale to the exhale phase in all three liver cases.
Figure 10.
Liver contours on the exhale phase for three liver cases. Each row represents the results for a case. The mapped contours using the proposed model are plotted in red together with the manually outlined contour on the exhale phase in green. The original contours mapped from the inhale phase were also mapped rigidly and are shown in cyan.
DISCUSSIONS
Most, if not all, registration algorithms ignore the underlying tissue features but rely on the similarity of image intensity. In a region where distinct image feature exists, we have shown that the features contained in a small control volume encompassing a point can be used as a signature of the point(18). The use of SIFT features(19–21) is an alternative and potentially more advantageous way to partially associate the two input images before deformable registration. The automation of the control point paring makes it ideally suitable for the segmented deformable registration.
Another essential piece of prior knowledge that makes the segmented registration possible is the manually delineated ROI contours. It is important to emphasize that, to “color” the control point pairs, only the template phase needs to be segmented. Because delineation of ROI on the template phase has to be done for treatment planning, this makes practical to carry out deformable registration on an organ specific basis. Overall, the segmented method markedly improves the registration of 4D CT images as compared with the conventional method.
There are three potential sources of inaccuracy in the proposed approach: (i) segmentation of the template image; (ii) automated control-point matching; and (iii) the number and locations of control points. Segmentation “sorts” the SIFT-identified control points into different groups for different organs. Accurate segmentation is an essence for sensible registration. Inaccuracy in segmentation may lead to wrong of the control points and thus erroneous registration. Effectively reducing the errors from the other two sources mentioned above is also critically important for robust registration.
Quantitative validation is a difficult task in deformable registration study because of the general lack of ground truth in clinical situations. Most studies rely on the use of digital or physical phantom(22), or the coincidence measure (such as the DSC) of deformable model-mapped organ contours with the segmentation by an expert(16). In this work we have used both approaches to validate the proposed technique. A virtue of the digital phantom-based approach is that the “ground truth” solutions exist and the transformation matrices are known, thus facilitating the quantitative evaluation of developed registration and contour propagation. On the other hand, physical or digital phantoms have so far not been able to reproduce the full range of imaging and anatomical characteristics. Brock et al have used “internal fiducials” for model validation(23). In their work, the accuracy of the organ deformation was determined by calculating the difference between the actual displacement of the vessel and bronchial bifurcations identified on two images and the displacement predicted by the models. Of course, the precision of selecting the same bifurcation location or other anatomic features on each CT phase should be assessed before their use for validation of a deformable model.
A direct implication of the proposed technique is that it provides more adequate method for describing the discontinuous motion of the involved organs at the boundary regions. The registration of the internal lung regions is also improved through better modeling of the peripheral regions. In general, the motions of the internal points are interrelated to that of the boundary points and it is intuitively perceivable that the improved accuracy in the peripheral zone will be “propagated” to the internal region and lead to better registration. This has been shown in the digital phantom study, and, in part, the three-points study of the 2nd lung patient. A thorough study of the subject is clearly of practical import and should be pursued in the future in the development of robust validation techniques as discussed above.
CONCLUSIONS
Accurate modeling of thoracic organ motions remains elusive because of the lack of an effective mechanism to deal with the discontinuous movements of the involved anatomic structures. In this work, a tissue feature-based image registration strategy with explicit inclusion of the differential motions of thoracic structures has been described. The chief advantages of the technique are that: (i) it allows segmented registration without delineating the target phases; and (ii) it increases the robustness and accuracy by incorporating inherent tissue features. Given the increased interest in 4D thoracic radiation therapy, the deformable registration method described here should find useful application in future clinical practice.
ACKNOWLEDGEMENT
This work was supported in part by grants from National Cancer Institute (1R01 CA98523 and CA104205), the Department of Defense (W81XWH-05-1-0041). We wish to thank Drs. A. Koong, B. Loo, and J. Antony for their useful input in this study, and the two anonymous referees for their constructive comments.
Footnotes
Publisher's Disclaimer: This is a PDF file of an unedited manuscript that has been accepted for publication. As a service to our customers we are providing this early version of the manuscript. The manuscript will undergo copyediting, typesetting, and review of the resulting proof before it is published in its final citable form. Please note that during the production process errors may be discovered which could affect the content, and all legal disclaimers that apply to the journal pertain.
Conflicts of Interest Notification
No actual or potential conflicts of interest exist.
REFERENCES
- 1.Xing L, Thorndyke B, Schreibmann E, et al. Overview of image-guided radiation therapy. Med Dosim. 2006;31:91–112. doi: 10.1016/j.meddos.2005.12.004. [DOI] [PubMed] [Google Scholar]
- 2.Rietzel E, Chen GT, Choi NC, et al. Four-dimensional image-based treatment planning: Target volume segmentation and dose calculation in the presence of respiratory motion. Int J Radiat Oncol Biol Phys. 2005;61:1535–1550. doi: 10.1016/j.ijrobp.2004.11.037. [DOI] [PubMed] [Google Scholar]
- 3.Rietzel E, Pan T, Chen GT. Four-dimensional computed tomography: image formation and clinical protocol. Med Phys. 2005;32:874–889. doi: 10.1118/1.1869852. [DOI] [PubMed] [Google Scholar]
- 4.Schreibmann E, Chen GT, Xing L. Image interpolation in 4D CT using a BSpline deformable registration model. Int J Radiat Oncol Biol Phys. 2006;64:1537–1550. doi: 10.1016/j.ijrobp.2005.11.018. [DOI] [PubMed] [Google Scholar]
- 5.Chao M, Li T, Schreibmann E, et al. Automated contour mapping with a regional deformable model. Int J Radiat Oncol Biol Phys. 2008;70:599–608. doi: 10.1016/j.ijrobp.2007.09.057. [DOI] [PubMed] [Google Scholar]
- 6.Paquin D, Xing L, Levy D. Multiscale Deformable Registration of Noisy Medical Images. Mathematical Biosciences and Engineering. 2008;5:125–144. doi: 10.3934/mbe.2008.5.125. [DOI] [PubMed] [Google Scholar]
- 7.Paquin D, Levy D, Xing L. Hybrid multiscale landmark and deformable image registration. Mathematical Biosciences & Engineering: MBE. 2007;4:711–737. doi: 10.3934/mbe.2007.4.711. [DOI] [PubMed] [Google Scholar]
- 8.Xing L, Siebers J, Keall P. Computational challenges for image-guided radiation therapy: framework and current research. Semin Radiat Oncol. 2007;17:245–257. doi: 10.1016/j.semradonc.2007.07.004. [DOI] [PubMed] [Google Scholar]
- 9.Villard P, Beuve M, Shariat B, et al. Simulation of Lung Behaviour with Finite Elements: Influence of Bio-Mechanical Parameters. Proceedings of the Third International Conference on Medical Information Visualisation_BioMedical Visualisation (MediVis'05).2005. [Google Scholar]
- 10.Al-Mayah A, Moseley J, Brock KK. Contact surface and material nonlinearity modeling of human lungs. Phys Med Biol. 2008;53:305–317. doi: 10.1088/0031-9155/53/1/022. [DOI] [PubMed] [Google Scholar]
- 11.Lowe DG. Object Recognition from Local Scale-Invariant Features. Proc. of the International Conference on Computer Vision; Corfu. 1999. [Google Scholar]
- 12.Mikolajczyk K, Schmid C. A Performance Evaluation of Local Descriptors. IEEE Trans. on Pattern Analysis and Machine Intelligence. 2005;27:1615–1630. doi: 10.1109/TPAMI.2005.188. [DOI] [PubMed] [Google Scholar]
- 13.Xie Y, Chao M, Lee P, et al. Feature-Based Rectal Contour Propagation from Planning CT to Cone Beam CT. Medical Physics. 2008;35:4450–4459. doi: 10.1118/1.2975230. [DOI] [PMC free article] [PubMed] [Google Scholar]
- 14.Bookstein FL. Principal Warps: Thin Plate Splines and the Decomposition of Deformations. IEEE Transactions on Pattern Analysis and Machine Intelligence. 1989;11:567–585. [Google Scholar]
- 15.Lian J, Xing L, Hunjan S, et al. Mapping of the prostate in endorectal coil-based MRI/MRSI and CT: a deformable registration and validation study. Med Phys. 2004;31:3087–3094. doi: 10.1118/1.1806292. [DOI] [PubMed] [Google Scholar]
- 16.Zhang T, Chi Y, Meldolesi E, et al. Automatic delineation of on-line head-and-neck computed tomography images: toward on-line adaptive radiotherapy. Int J Radiat Oncol Biol Phys. 2007;68:522–530. doi: 10.1016/j.ijrobp.2007.01.038. [DOI] [PubMed] [Google Scholar]
- 17.Bharatha A, Hirose M, Hata N, et al. Evaluation of three-dimensional finite element-based deformable registration of pre- and intraoperative prostate imaging. Med Phys. 2001;28:2551–2560. doi: 10.1118/1.1414009. [DOI] [PubMed] [Google Scholar]
- 18.Schreibmann E, Xing L. Image registration with auto-mapped control volumes. Med Phys. 2006;33:1165–1179. doi: 10.1118/1.2184440. [DOI] [PubMed] [Google Scholar]
- 19.Lowe DG. Distinctive Image Features from Scale-Invariant Keypoints. International Journal of Computer Vision. 2004;60:91–110. [Google Scholar]
- 20.Lindeberg T. Feature detection with automatic scale selection. International Journal of Computer Vision. 1998;30:79–116. [Google Scholar]
- 21.Lindeberg T. Edge detection and ridge detection with automatic scale selection. International Journal of Computer Vision. 1998;30:117–154. [Google Scholar]
- 22.Kashani R, Hub M, Balter J, et al. Objective assessment of deformable image registration in radiotherapy: A multi-institution study. Med Phys. 2008;35:5944–5953. doi: 10.1118/1.3013563. [DOI] [PMC free article] [PubMed] [Google Scholar]
- 23.Brock KM, Balter JM, Dawson LA, et al. Automated generation of a four-dimensional model of the liver using warping and mutual information. Med Phys. 2003;30:1128–1133. doi: 10.1118/1.1576781. [DOI] [PubMed] [Google Scholar]


