

Abstract
Introduction
A major predictor of age-related osteoporotic fracture is peak areal bone mineral density (aBMD) which is a highly heritable trait. However, few linkage and association studies have been performed in men to identify the genes contributing to normal variation in aBMD. The aim of this study was to perform a genome wide scan in healthy men to identify quantitative trait loci (QTL) that were significantly linked to aBMD and to test whether any of these might be sex-specific.
Methods
aBMD at the spine and hip were measured in 515 pairs of brothers, aged 18-61 (405 white pairs, 110 black pairs). Linkage analysis in the brother sample was compared with results in a previously published sample of 774 sister pairs to identify sex-specific quantitative trait loci (QTL).
Results
A genome wide scan identified significant QTL (LOD>3.6) for aBMD on chromosomes 4q21 (hip), 7q34 (spine), 14q32 (hip), 19p13 (hip), 21q21 (hip), and 22q13 (hip). Analysis suggested that the QTL on chromosome 7q34, 14q32, and 21q21 were male-specific whereas the others were not sex-specific.
Conclusions
This study demonstrates that six QTL were significantly linked with aBMD in men. One was linked to spine and five were linked to hip. When compared to published data in women from the same geographical region, the QTL on chromosomes 7, 14 and 21 were male-specific. The occurrence of sex-specific genes in humans for aBMD has important implications for the pathogenesis and treatment of osteoporosis.
Keywords: men, sex- specific QTL, genome-wide scan, linkage
Introduction
A major predictor of age-related osteoporotic fracture is peak areal bone mineral density (aBMD) [1]. Men have higher peak aBMD at the hip than women [2] and have about a four times lower incidence of osteoporotic hip fracture [3] than wo men. The heritability of aBMD in men is of similar magnitude as that in women, 75-90% [4]. However, it is not clear whether the genes underlying the normal variance of aBMD in men and women are the same or whether male and female sex-specific genes contribute to variation in aBMD. We previously completed a genome- wide screen in 323 healthy pairs of brothers which identified several quantitative trait loci (QTL) that provided suggestive evidence of linkage to aBMD at hip and spine. This study also provided evidence of male-specific QTL [5]. Other studies in humans also support the presence of sex-specific genes regulating aBMD [6] [7] [8] [9]. Results in both recombinant inbred mice [10] and congenic mice [11] also strongly suggest that many of the genes underlying bone mass are sex-specific. The presence of sex-specific genes implies that there may be sex-specific variation in the response of bone to both environmental factors and to medications aimed at preventing and treating osteoporosis.
One of the challenges in genetic studies is to replicate initial results [12] whilst designing studies that have sufficient power to detect linkage or association. As pairs of brothers have continued to accrue to our sample, a question that arose was whether to pursue replication of the initial suggestive QTL or to perform an analysis of all available pairs in order to maximize the power to detect significant QTL. When considering this dilemma in association studies, it has been recommended that it is more effective to perform a maximally powered initial study than to compromise the power of the study by performing an initial and replication study [13]. We have sought to maximize our power to detect linkage by performing an analysis including all available brothers and utilizing stringent linkage thresholds. This approach also provides the best power to detect male- specific QTL. The aims of this study were to examine, firstly whether we could detect significant QTL linked to aBMD in healthy men, and secondly to test whether some of these QTL were sex-specific.
Materials And Methods
Subjects
Subjects were recruited by advertising. Exclusion criteria included a history of chronic disease, taking medications known to affect bone mass, inability to have BMD measured because of obesity (>136 kg) and the presence of abnormal blood tests assessed by safety biochemistry. No limit was placed on the difference in years between pairs. The studies were performed on the Clinical Research Center at Indiana University Hospital. A blood sample was collected for DNA, health and life style questionnaires were administered, anthropometrics obtained and aBMD measured. In addition, blood was collected for DNA from one or both parents where possible. Informed written consent, approved by Indiana University-Purdue University Indianapolis and Clarian IRB, was obtained from all subjects.
A sample of 774 pairs of healthy premenopausal white and black sister pairs from the same geographical region of the USA as the men was used in joint analyses with brother pairs to detect sex-specific QTL[14]. Recruitment methods and exclusion criteria were the same as for the men except that sisters with an age difference of 10 years or more were excluded. Women on oral contraceptives were included and use of these was examined as a covariate. In 14 of the families studied there were both brother and sister pairs.
Methods
aBMD was measured by DXA (DPXL and Prodigy, Lunar Corp., Madison, WI) at lumbar spine (vertebrae 2 to 4) and hip (femoral neck). Brothers were measured on the same instrument, usually at the same visit. Image analysis was performed using software 4.6/4.7. Coefficient of variation measured in 115 pairs of sisters who had duplicate DXA measures made after they were repositioned on the instrument, was 1.0% for femoral neck. Height and weight were measured with the subject gowned and without shoes using a Harpenden Stadiometer and a Scale-Tronix weighing scale, which were regularly calibrated throughout the study.
DNA and Marker Genotyping
DNA was isolated using standard techniques and stored in a DNA repository. A genome scan was performed at the Center for Inherited Disease Research using automated fluorescent microsatellite analysis in the sample of men as it had been in the sample of women. PCR products were sized on an ABI 3700 sequencer. The marker set used was a modification of the CHLC version 9 marker set with 402 markers, at average spacing of 9cM and average heterozygosity of 0.76 [www.cidr.jhmi.edu]. A total of 251,652 genotypes were produced from 626 samples. The error rate, based on 22,513 paired genotypes from duplicate samples, was 0.05%. The percentage of genotypic data missing was 3.53. The marker genotype data were used to verify full sibling relationships among subjects using the computer programs RELATIVE [15] and RELPAIR [16], and half sibling pairs (n=13) were eliminated from further analysis.
Statistical and Genetic analysis
Comparison between aBMD phenotypes and covariates in white and black groups was performed by Student's t-test, and Pearson's correlation coefficients were computed between spine and hip aBMD for each group.
Stepwise regression analysis was employed on aBMD using height, weight, pack-years of smoking, and age to identify significant covariates with aBMD. Weight and age, which were significant predictors of aBMD (p<0.10) in regression model fitting, were used as covariates in the genetic modeling. Race-specific regression residuals, representing covariate-adjusted aBMD values, were computed and used in all analysis. Genotypic data from the parents were used to improve the ability to accurately estimate marker allele sharing among brother pairs.
Multipoint quantitative linkage analysis was performed for the aBMD phenotypes using the maximum likelihood variance estimation method as implemented in the computer package Mapmaker/SIBS [17]. Chromosomal positions, marker order and map positions were obtained from the Marshfield electronic data base [www.marshmed.org/genetics/]. LOD scores were computed at 1cM intervals along each autosome and the X chromosome. In families with more than two brothers, all possible sibling pairs were used in the analysis. Observed allele frequencies in the individuals genotyped for the genome screen were used. To confirm the robustness of linkage, analyses were also performed using only independent sibling pairs and implementing the more conservative Haseman-Elston regression approach [18].
Evaluation of Sex-Specific QTL
Premenopausal sister pairs (n=774) from the same geographical region in the USA (Indiana) were studied under an identical protocol [14]. A genome wide scan was previously performed by the Center for Inherited Disease Research using an identical panel of microsatellite markers. QTL for peak aBMD were identified using the spine [19] and hip [14] aBMD. Genotypic and phenotypic data from the brother and sister sample were combined to perform a joint linkage analysis in chromosomal regions demonstrating linkage in the brother sample. To correct for aBMD differences between men and women and blacks and whites, race-specific regression residuals were computed separately for each sex and race. These sex- and race-specific residuals, representing the degree to which an individual's aBMD differed from the mean for her/his sex, were employed as the phenotype in the combined male/female linkage analysis.
To test the hypothesis that QTL identified in the brothers' genome screen were sex-specific, the traditional Haseman-Elston regression test for linkage [18] was extended as described previously [5]. Briefly this test involves fitting the model to the sib-pair phenotypic and genotypic data:
In this formula, ‘m’ is the regression slope and ‘c’ is the intercept. The dependent variable is the square of the difference in aBMD between members of the sib-pair. This is regressed on the proportion of alleles shared identical by descent (IBD) by the sibling pair at the marker locus. Pair type indicates whether the sibling pair is a male or female pair. The coefficient ‘b’ is the key addition to this extended model. Under the alternative hypothesis that the QTL has effect in males but not females, the slopes would differ and the estimate of b would be significantly different from zero.
The test for male-specific QTL was performed only at QTL where linkage was detected in brother pairs. Multipoint estimates for IBD were obtained for each sibling pair at the QTL to be tested using the Mapmaker/SIBS software package [17]. The analysis of covariance model, equation 2 described above, is fitted using the generalized linear models procedure in the SAS software package version 9 (2004). A Bonferroni adjustment for multiple comparisons was used to set the significance level of the p-values for the test of sex-specificity, taking the number of independent chromosome regions tested into account.
The test for female-specific QTL was performed in similar fashion to the male-specific test described above. In this case, testing was performed only at chromosomal locations at which linkage signals had been detected in the sample of sister pairs.
Results
The sample of men comprised 852 individuals, 671 white and 181 black (Table 1). Within this sample were 405 white brother pairs from 315 independent sibships, representing 356 independent brother pairs (n-1 method). There were 110 black brother pairs from 85 independent sibships, representing 96 independent brother pairs (n-1 method). DNA was collected from 239 parents.
Table 1.
Comparison of Demographics and Areal Bone Mineral Density in American White and Black Brothers
| Whites | Blacks | ||||
|---|---|---|---|---|---|
| Variable | N | Mean (S.D) (Minimum-Maximum) |
N | Mean (S.D) (Minimum-Maximum) |
p-value |
| Height (cm) | 671 | 178.07 (6.95) (155.40 - 200.90) |
181 | 177.27 (7.07) (161.00 – 197.40) |
0.1710 |
| Weight (kg) | 671 | 87.17 (16.79) (52.60 – 138.30) |
181 | 87.62 (17.52) (55.70 – 137.30) |
0.7476 |
| Age (years) | 671 | 33.65 (10.95) (18.43 – 61.03) |
181 | 35.55 (10.42) 20.01 – 59.47) |
0.0363 |
| Hip BMD (g/cm2) | 671 | 1.0849 (0.1631) (0.7980 – 1.8560) |
181 | 1.1829 (0.1674) (0.7910 – 1.7035) |
<.0001 |
| Spine BMD (g/cm2) | 669 | 1.2713 (0.1631) (0.7980 – 1.8560) |
180 | 1.3550 (0.1934) (0.9130 – 2.0000) |
<.0001 |
There was no difference in mean height or weight between American whites and American blacks but blacks were almost two years older and had higher aBMD at spine and hip than whites (Table 1). The correlation between aBMD at spine and hip was 0.622 for whites, 0.578 for blacks and 0.628 for blacks and whites combined. The heritability of aBMD at the spine and hip were 0.88 and 0.78, respectively.
A genome wide scan identified 6 significant (LOD scores >3.6) QTL for aBMD (Figure 1, Table 2). These QTL were on chromosomes 4q21 (hip), 7q34 (spine), 14q32 (hip), 19p13 (hip), 21q21 (hip), and 22q13 (hip). Three of the QTL, 7q34, 14q32, and 21q21 were identified as being male-specific (p<0.01) (Figure2).
Figure 1.
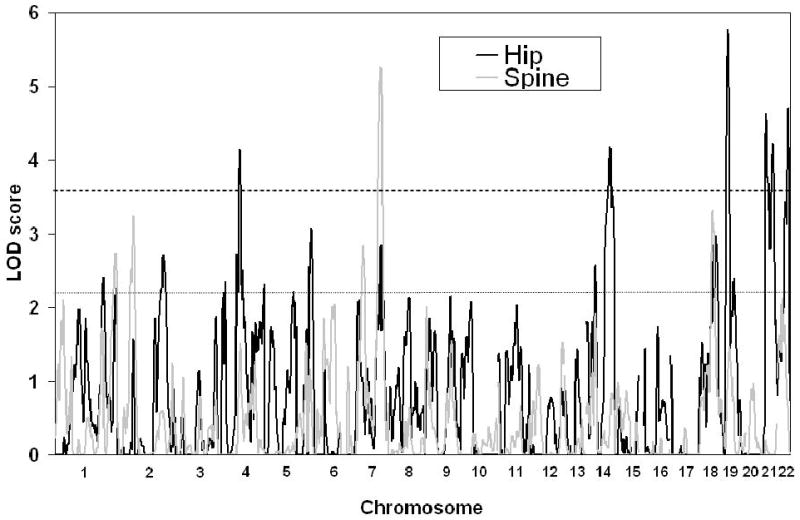
Significant QTL (LOD>3.6, indicated by heavy dotted line) indentified on genome-wide scan for Hip (black) and Spine aBMD (grey). Maximum LOD score is on the y-axis and chromosome number on the x-axis. Suggestive linkage (LOD<2.2) is shown by the fine dotted line
Table 2.
Significant QTL for spine and hip aBMD. The corresponding LOD scores for the same chromosomal regions in a sample of published sisters are also shown [5]. The Marshfield position (cM) for the maximum LOD score is shown in brackets. Male-specific QTL (p-value <0.01) are in bold.
| Men | Women | Sex-specific | ||||
|---|---|---|---|---|---|---|
| Spine | Hip | Spine | Hip | Spine | Hip | |
| chromosome | LOD(cM) | LOD(cM) | LOD | LOD | p-value | p-value |
| 4q21 | 4.14(96) | 1.64 | 0.64 | |||
| 7q34 | 5.26(146) | 2.84(147) | 0.00 | 0.30 | 0.00001 | 0.28 |
| 14q32 | 4.19(119) | 0.00 | 0.002 | |||
| 19p13 | 5.77(21) | 1.15 | 0.02 | |||
| 21q21 | 4.63(7) | 0.18 | 0.006 | |||
| 22q13 | 4.71(52) | 0.25 | 0.39 | |||
Figure 2(A, B, C, D, E, F).
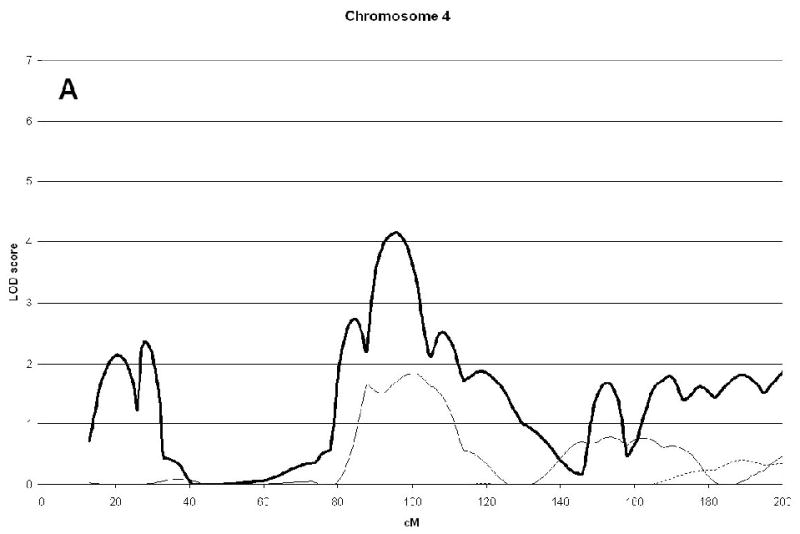
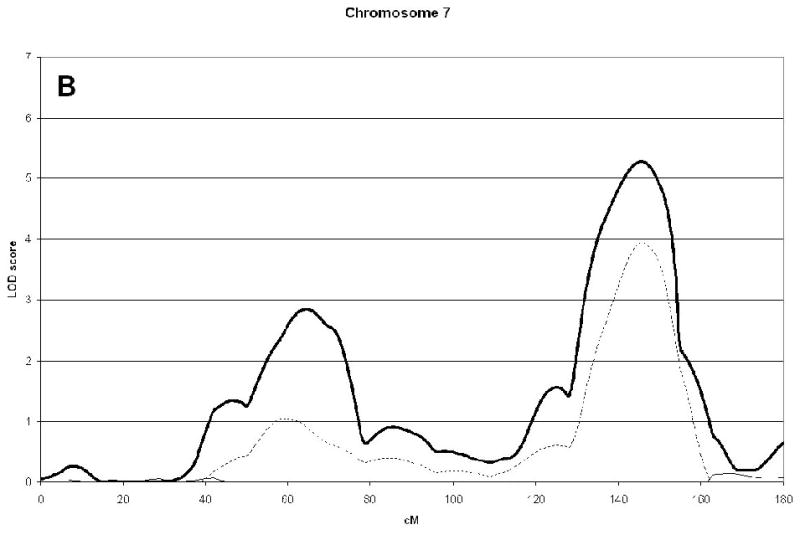
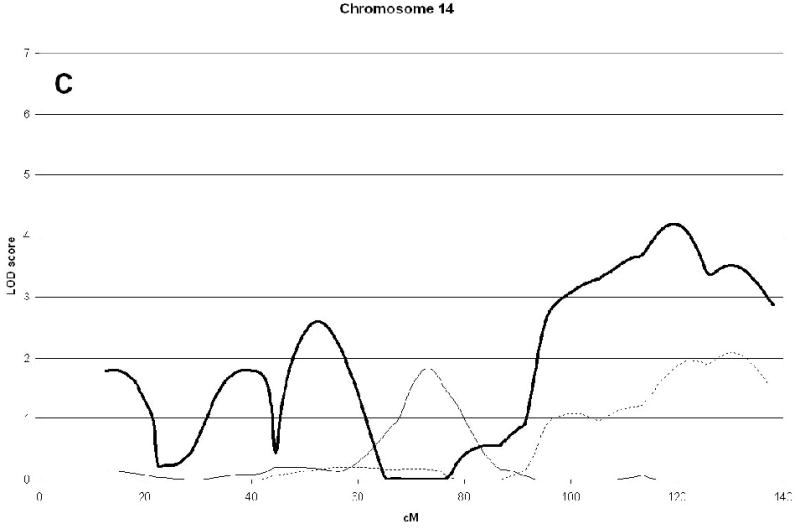
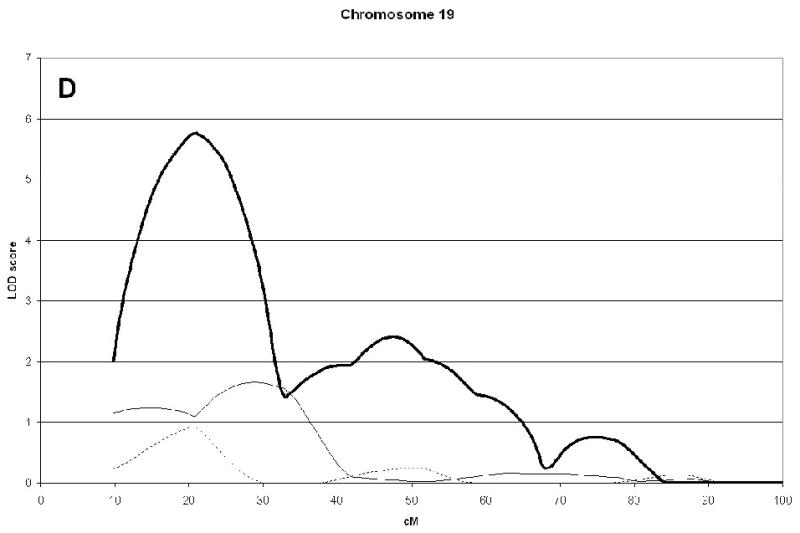
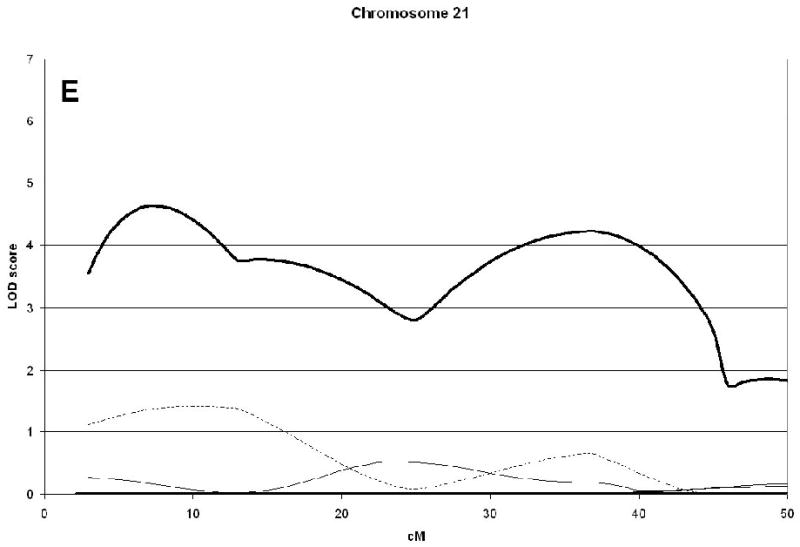
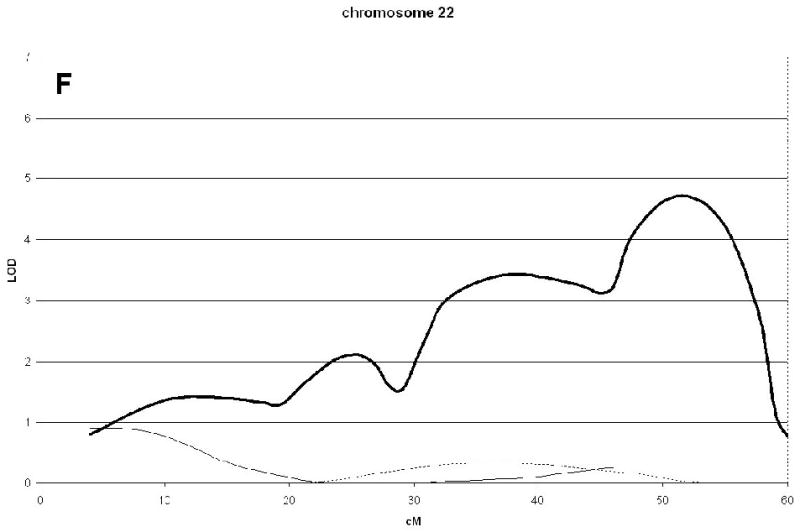
Linkage analysis of spine and hip aBMD in brother and sister pairs. LOD score in brothers shown by thick line, in sisters by thin line, and in male-specific by dotted line. Marshfield sex-averaged cM scale is shown on the x-axis.
Reciprocal analysis of our previously reported aBMD QTL in premenopausal women [19] did not result in the detection of female-specific loci. The chromosome 1q12-23 locus, however, did demonstrate a trend toward female specificity (p=0.02).
Discussion
This genome wide study in a sample of 515 pairs of healthy brothers identified six significant QTL (LOD>3.6) linked to aBMD. Five QTL were at the hip and one was at the spine. The QTL at the spine also had a LOD score at the hip that was of suggestive significance (LOD>2.2). Although there was good correlation between aBMD at spine and hip in men, it is clear from both linkage and association studies that QTL for aBMD may often be site-specific.
Three of the six significant QTL were identified as being sex-specific when compared to a sample of 774 pairs of healthy premenopausal sisters [14] arising from the same population and studied under an identical protocol. The occurrence of sex-specific QTL is well documented [6] [7] [5] [9] [20]. Identification of the genes underlying these QTL has major implications for the development of treatments aimed at prevention and treatment of osteoporosis. Sex-specific QTL for bone mass are well described in mice [10] [11] [21] [20] and rats [22] [23] with some reported to be homologous with bone mass QTL in humans [23]. Notably, two of our male specific QTL, 14q32 and 22q13, were syntenic to rat bone mass QTL [23]. Further, the 22q13 human QTL was syntenic to a QTL for femur structure in rat Chromosome7 that is female-specific [23], indicating that these syntenic QTL may occur both in the same and in the opposite direction for sex-specificity between species. No clear synteny was seen between our male-specific BMD QTL and those described in the mouse, although our chromosome 1 female specific spine BMD QTL [19] was syntenic to a mouse Chromosome 1 BMD QTL [21]. In the baboon there is also evidence that there is a genotype-by-sex effect on serum bone specific alkaline phosphatase levels, a heritable marker of bone formation [24].
As found in most studies in men, aBMD was higher in American blacks than whites. Thus race-specific regression residuals, representing covariate-adjusted BMD values, were used in analysis to allow the combination of the data from the white and brother pairs. If there are race-specific genes for aBMD, these might influence evidence of linkage, computed by LOD score, of specific QTL. In this study there was strong evidence of linkage to 7q34. Although we had detected linkage to this region in our previous sample [5], the QTL was not reported because linkage was due solely to a small number of black brother pairs. However, in this study evidence of linkage to 7q34 was contributed, not only by the larger sample of black brothers, but also by the larger sample of white brothers. This QTL was found to be male-specific in the current analyses, as it was in the previous analysis. The LOD scores of all other QTL identified in the previously published sample did not increase in the current study. These results emphasize the need to aim for maximum power as has been recommended for association studies [13].
In a genome wide screen in a combined sample of Mexican men and women a QTL on chromosome 4p has been shown to be significantly linked to aBMD at midpoint radius, but not at the hip, [25]. Other genome wide studies in families also found suggestive linkage of aBMD to chromosome 4 [26] [27]. On chromosome 7q, a QTL was found to be significantly link to aBMD at the hip in a sample of 317 Amish men [28]. A genome wide scan in a sample of 3,691 men and women identified a significant QTL at 10q21for femoral neck aBMD in men younger than aged 50 years and suggestive QTL at 18p11 and 20q13 for lumbar spine aBMD in women younger than aged 50 years [8]. A genome wide scan identified a region on chromosome 14q linked to hip aBMD in women [14]. This region was further supported in a meta-analysis of nine genome wide scans [9]. Analyses of 14q32.2 in a case control study with high and low hip aBMD also suggested linkage to this region [29]. This chromosome 14q 32.2 is of particular interest because it was identified as sex-specific and encompasses the estrogen receptor beta gene which has been shown to be associated with aBMD [30] [31]. However, in our association study we concluded that there were other genes contributing to aBMD [31]. In a subgroup analysis a QTL linked to spine aBMD, but not hip, was found in Amish men [28].
This study had a number of strengths. The sample size of 515 brother pairs, involving 852 individuals, was relatively large for a linkage study of bone density in men. Stringent thresholds for linkage, LOD scores greater than 3.6, and sex-specificity, p values less than 0.01, were utilized to minimize false positive results. When using samples of different race, if the same loci but not the same sequence variation, contributes to the phenotypic variability in the trait, linkage approaches will have greater power to detect the locus then will association methods, which rely common variants and linkage disequilibrium. Finally, the focus on peak bone mass in healthy men helped to avoid genes regulating aBMD loss. There are also some weaknesses to the study design. As in any linkage study false positive results can occur due to several factors, including insufficient sample size or marker informativeness, and false negative results can occur if substantial locus heterogeneity is present As with all linkage results, our findings must be corroborated in an independent sample of similar men using the same aBMD phenotypes [12].
In conclusion, in a sample of healthy brother pairs we have identified 6 QTL with significant linkage to aBMD at the hip and/or spine. Three of these are male-specific. The occurrence of male-specific genes regulating variation of aBMD in the normal population has major implications for finding genes underlying osteoporosis in both men and women
Acknowledgments
This work was supported by NIH Grants, P01 AG-18397, UL1RR025761-01
We gratefully acknowledge the brothers and parents who participated in this study, as well as the study coordinators, without whom this work could not have been accomplished.
Footnotes
Publisher's Disclaimer: This is a PDF file of an unedited manuscript that has been accepted for publication. As a service to our customers we are providing this early version of the manuscript. The manuscript will undergo copyediting, typesetting, and review of the resulting proof before it is published in its final citable form. Please note that during the production process errors may be discovered which could affect the content, and all legal disclaimers that apply to the journal pertain.
Contributor Information
Munro Peacock, Email: mpeacock@iupui.edu.
Daniel L. Koller, Email: dlkoller@iupui.edu.
Siu Hui, Email: shui@iupui.edu.
Tatiana Foroud, Email: tforoud@iupui.edu.
Michael J. Econs, Email: mecons@iupui.edu.
Reference List
- 1.Riis BJ, Hansen MA, Jensen AM, Overgaard K, Christiansen C. Low bone mass and fast rate of bone loss at menopause: Equal risk factors for future fracture: A 15-year follow- up study. Bone. 1996;19:9–12. doi: 10.1016/8756-3282(96)00102-0. [DOI] [PubMed] [Google Scholar]
- 2.Looker AC, Wahner HW, Dunn WL, Calvo MS, Harris TB, Heyse SP, Johnston CC, Jr, Lindsay RL. Proximal femur bone mineral levels of US adults. Osteoporos Int. 1995;5:389–409. doi: 10.1007/BF01622262. [DOI] [PubMed] [Google Scholar]
- 3.Kellie SE, Brody JA. Sex-specific and race-specific hip fracture rates. Am J Public Health. 1990;80:326–8. doi: 10.2105/ajph.80.3.326. [DOI] [PMC free article] [PubMed] [Google Scholar]
- 4.Peacock M, Turner CH, Econs MJ, Foroud T. Genetics of Osteoporosis. Endo Rev. 2002;23:303–26. doi: 10.1210/edrv.23.3.0464. [DOI] [PubMed] [Google Scholar]
- 5.Peacock M, Koller DL, Fishburn TM, Krishnan S, Lai D, Hui S, Johnston CC, Foroud T, Econs MJ. Sex-specific and non sex-specific quantitative trait loci contribute to normal variation in bone mineral density in men. J Clin Endo Metab. 2005;90:3060–6. doi: 10.1210/jc.2004-2143. [DOI] [PubMed] [Google Scholar]
- 6.Duncan EL, Cardon LR, Sinsheimer JS, Wass JA, Brown MA. Site and gender specificity of inheritance of bone mineral density. J Bone Miner Res. 2003;18:1531–8. doi: 10.1359/jbmr.2003.18.8.1531. [DOI] [PubMed] [Google Scholar]
- 7.Van Pottelbergh I, Goemaere S, Zmierczak H, De Bacquer D, Kaufman JM. Deficient acquisition of bone during maturation underlies idiopathic osteoporosis in men: evidence from a three-generation family study. J Bone Miner Res. 2003;18:303–11. doi: 10.1359/jbmr.2003.18.2.303. [DOI] [PubMed] [Google Scholar]
- 8.Ralston SH, Galwey N, Mackay I, Albagha OM, Cardon L, Compston JE, Cooper C, Duncan E, Keen R, Langdahl B, McLellan A, O'Riordan J, Pols HA, Reid DM, Uitterlinden AG, Wass J, Bennett ST. Loci for regulation of bone mineral density in men and women identified by genome wide linkage scan: the FAMOS study. Hum Mol Genet. 2005;14:943–51. doi: 10.1093/hmg/ddi088. [DOI] [PubMed] [Google Scholar]
- 9.Ioannidis JP, Ng MY, Sham PC, Zintzaras E, Lewis CM, Deng HW, Econs MJ, Karasik D, Devoto M, Kammerer CM, Spector T, Andrew T, Cupples LA, Duncan EL, Foroud T, Kiel DP, Koller D, Langdahl B, Mitchell BD, Peacock M, Recker R, Shen H, Sol-Church K, Spotila LD, Uitterlinden AG, Wilson SG, Kung AW, Ralston SH. Meta-analysis of genome-wide scans provides evidence for sex- and site-specific regulation of bone mass. J Bone Miner Res. 2007;22:173–83. doi: 10.1359/jbmr.060806. [DOI] [PMC free article] [PubMed] [Google Scholar]
- 10.Orwoll ES, Belknap JK, Klein RF. Gender specificity in the genetic determinants of peak bone mass 1. J Bone Miner Res. 2001;16:1962–71. doi: 10.1359/jbmr.2001.16.11.1962. [DOI] [PubMed] [Google Scholar]
- 11.Turner CH, Sun Q, Schriefer J, Pitner N, Price R, Bouxsein ML, Rosen CJ, Donahue LR, Shultz KL, Beamer WG. Congenic mice reveal sex-specific genetic regulation of femoral structure and strength. Calcif Tissue Int. 2003;73:297–303. doi: 10.1007/s00223-002-1062-1. [DOI] [PubMed] [Google Scholar]
- 12.Vieland VJ. The replication requirement. Nat Genet. 2001;29:244–5. doi: 10.1038/ng1101-244. [DOI] [PubMed] [Google Scholar]
- 13.Skol AD, Scott LJ, Abecasis GR, Boehnke M. Joint analysis is more efficient than replication-based analysis for two-stage genome-wide association studies. Nat Genet. 2006;38:209–13. doi: 10.1038/ng1706. [DOI] [PubMed] [Google Scholar]
- 14.Peacock M, Koller DL, Hui S, Johnston CC, Foroud T, Econs MJ. Peak bone mineral density at the hip is linked to chromosomes 14q and 15q. Osteoporos Int. 2004;15:489–96. doi: 10.1007/s00198-003-1560-7. [DOI] [PubMed] [Google Scholar]
- 15.Goring HH, Ott J. Relationship estimation in affected sib pair analysis of late-onset diseases. Eur J Hum Genet. 1997;5:69–77. [PubMed] [Google Scholar]
- 16.Boehnke M, Cox NJ. Accurate inference of relationships in sib-pair linkage studies. Am J Hum Genet. 1997;61:423–9. doi: 10.1086/514862. [DOI] [PMC free article] [PubMed] [Google Scholar]
- 17.Kruglyak L, Lander ES. Complete multipoint sib-pair analysis of qualitative and quantitative traits. Am J Hum Genet. 1995;57:439–54. [PMC free article] [PubMed] [Google Scholar]
- 18.Haseman JK, Elston RC. The investigation of linkage between a quantitative trait and a marker locus. Behav Genet. 1972;2:3–19. doi: 10.1007/BF01066731. [DOI] [PubMed] [Google Scholar]
- 19.Econs MJ, Koller DL, Hui S, Conneally PM, Johnston CC, Peacock M, Foroud T. Confirmation Linkage to Chromosome 1q for Peak Vertebral Bone Mineral Density in Premenopausal White Women. The American Journal of Human Genetics. 2004;74:223–228. doi: 10.1086/381401. Ref Type: Journal (Full) [DOI] [PMC free article] [PubMed] [Google Scholar]
- 20.Karasik D, Ferrari SL. Contribution of gender-specific genetic factors to osteoporosis risk. Ann Hum Genet. 2008;72:696–714. doi: 10.1111/j.1469-1809.2008.00447.x. [DOI] [PubMed] [Google Scholar]
- 21.Edderkaoui B, Baylink DJ, Beamer WG, Shultz KL, Wergedal JE, Mohan S. Genetic regulation of femoral bone mineral density: complexity of sex effect in chromosome 1 revealed by congenic sublines of mice. Bone. 2007;41:340–5. doi: 10.1016/j.bone.2007.05.013. [DOI] [PubMed] [Google Scholar]
- 22.Sun Q, Alam I, Liu L, Koller DL, Carr LG, Econs MJ, Foroud T, Turner CH. Genetic loci affecting bone structure and strength in inbred COP and DA rats. Bone. 2008;42:547–53. doi: 10.1016/j.bone.2007.11.004. [DOI] [PMC free article] [PubMed] [Google Scholar]
- 23.Koller DL, Liu L, Alam I, Sun Q, Econs MJ, Foroud T, Turner CH. Linkage screen for BMD phenotypes in male and female COP and DA rat strains. J Bone Miner Res. 2008;23:1382–8. doi: 10.1359/JBMR.080401. [DOI] [PMC free article] [PubMed] [Google Scholar]
- 24.Havill LM, Mahaney MC, Rogers J. Genotype-by-sex and environment-by-sex interactions influence variation in serum levels of bone-specific alkaline phosphatase in adult baboons (Papio hamadryas) Bone. 2004;35:198–203. doi: 10.1016/j.bone.2004.02.022. [DOI] [PubMed] [Google Scholar]
- 25.Kammerer CM, Schneider JL, Cole SA, Hixson JE, Samollow PB, O'Connell JR, Perez R, Dyer TD, Almasy L, Blangero J, Bauer RL, Mitchell BD. Quantitative trait loci on chromosomes 2p, 4p, and 13q influence bone mineral density of the forearm and hip in Mexican Americans. J Bone Miner Res. 2003;18:2245–52. doi: 10.1359/jbmr.2003.18.12.2245. [DOI] [PubMed] [Google Scholar]
- 26.Devoto M, Shimoya K, Caminis J, Ott J, Tenenhouse A, Whyte MP, Sereda L, Hall S, Considine E, Williams CJ, Tromp G, Kuivaniemi H, la-Kokko L, Prockop DJ, Spotila LD. First-stage autosomal genome screen in extended pedigrees suggests genes predisposing to low bone mineral density on chromosomes 1p, 2p and 4q. Eur J Hum Genet. 1998;6:151–7. doi: 10.1038/sj.ejhg.5200169. [DOI] [PubMed] [Google Scholar]
- 27.Deng HW, Xu FH, Huang QY, Shen H, Deng H, Conway T, Liu YJ, Liu YZ, Li JL, Zhang HT, Davies KM, Recker RR. A whole-genome linkage scan suggests several genomic regions potentially containing quantitative trait Loci for osteoporosis. J Clin Endocrinol Metab. 2002;87:5151–9. doi: 10.1210/jc.2002-020474. [DOI] [PubMed] [Google Scholar]
- 28.Streeten EA, McBride DJ, Pollin TI, Ryan K, Shapiro J, Ott S, Mitchell BD, Shuldiner AR, O'Connell JR. Quantitative trait loci for BMD identified by autosome-wide linkage scan to chromosomes 7q and 21q in men from the Amish Family Osteoporosis Study. J Bone Miner Res. 2006;21:1433–42. doi: 10.1359/jbmr.060602. [DOI] [PubMed] [Google Scholar]
- 29.Cheung CL, Sham PC, Chan V, Paterson AD, Luk KD, Kung AW. Identification of LTBP2 on chromosome 14q as a novel candidate gene for bone mineral density variation and fracture risk association. J Clin Endocrinol Metab. 2008;93:4448–55. doi: 10.1210/jc.2007-2836. [DOI] [PubMed] [Google Scholar]
- 30.Ogawa S, Hosoi T, Shiraki M, Orimo H, Emi M, Muramatsu M, Ouchi Y, Inoue S. Association of estrogen receptor beta gene polymorphism with bone mineral density. Biochem Biophys Res Commun. 2000;269:537–41. doi: 10.1006/bbrc.2000.2285. [DOI] [PubMed] [Google Scholar]
- 31.Ichikawa S, Koller DL, Peacock M, Johnson ML, Lai D, Hui SL, Johnston CC, Foroud TM, Econs MJ. Polymorphisms in the Estrogen Receptor {beta}} (ESR2) Gene are Associated with Bone Mineral Density in Caucasian Men and Women. J Clin Endocrinol Metab. 2005 doi: 10.1210/jc.2004-2253. [DOI] [PMC free article] [PubMed] [Google Scholar]