

Abstract
Nasopharyngeal carcinoma (NPC) is a multifactorial malignancy closely associated with genetic factors and Epstein-Barr virus infection. To identify the common genetic variants linked to NPC susceptibility, we conducted a genome-wide association study (GWAS) in 277 NPC patients and 285 healthy controls within the Taiwanese population, analyzing 480,365 single-nucleotide polymorphisms (SNPs). Twelve statistically significant SNPs were identified and mapped to chromosome 6p21.3. Associations were replicated in two independent sets of case-control samples. Two of the most significant SNPs (rs2517713 and rs2975042; pcombined = 3.9 × 10⁻²⁰ and 1.6 × 10⁻¹⁹, respectively) were located in the HLA-A gene. Moreover, we detected significant associations between NPC and two genes: specifically, gamma aminobutyric acid b receptor 1 (GABBR1) (rs29232; pcombined = 8.97 × 10⁻¹⁷) and HLA-F (rs3129055 and rs9258122; pcombined = 7.36 × 10⁻¹¹ and 3.33 × 10⁻¹⁰, respectively). Notably, the association of rs29232 remained significant (residual p < 5 × 10⁻⁴) after adjustment for age, gender, and HLA-related SNPs. Furthermore, higher GABAB receptor 1 expression levels can be found in the tumor cells in comparison to the adjacent epithelial cells (p < 0.001) in NPC biopsies, implying a biological role of GABBR1 in NPC carcinogenesis. To our knowledge, it is the first GWAS report of NPC showing that multiple loci (HLA-A, HLA-F, and GABBR1) within chromosome 6p21.3 are associated with NPC. Although some of these relationships may be attributed to linkage disequilibrium between the loci, the findings clearly provide a fresh direction for the study of NPC development.
Introduction
Nasopharyngeal carcinoma (NPC [MIM 161550]), arising in the epithelium of the nasopharynx, is a multifactorial malignancy associated with both genetic and environmental factors. For example, NPC incidence exhibits remarkable geographic and ethnic distribution; it is more prominent in the southeast Asian regions, including southern China, Hong Kong, and Taiwan, where the annual incidence rate is approximately 25-fold higher than that in the Western world.1 Moreover, NPC is consistently associated with Epstein-Barr virus (EBV) infection,2 and the clonal EBV DNA sequence can be detected in tumor cells of patients in endemic areas. Nevertheless, elevated NPC risk associated with EBV infection is largely confined to individuals of southern Chinese origin.3 These findings suggest that genetic factors act alone or via interactions with environmental factors, such as EBV, to regulate NPC tumor formation and progression.4–6
Association studies within the NPC endemic population disclose that tumor susceptibility is associated with HLA types.7 Increased risk of NPC was observed in individuals with the HLA-A2 allele, particularly HLA-A∗0207.8 Other variants linked to NPC include those in DNA repair genes, such as X-ray repair cross-complementing group 1 (XRCC1 [MIM 194360]) and 8-oxoguanine glycosylase 1 (hOGG1 [MIM 601982]),9 as well as cytochrome P450 2E1 (CYP2E1 [MIM 124040])10 and glutathione S-transferase M1 (GSTM1 [MIM 138350]), which function in the metabolism or detoxification of nitrosamines and related carcinogens.11 However, some of these reported associations are not replicated in NPC patients within the Taiwanese population.12
Previous analyses on NPC susceptibility genes were performed via linkage studies or candidate-gene approaches. Here, we conduct a genome-wide association study (GWAS) to comprehensively examine the entire genome with increased resolution and power. We report multiple NPC-associated loci in the major histocompatibility complex (MHC) region and replication of these findings in two independent sets of case-control samples. After adjustment by age, gender and other significant SNPs, our results clearly suggest that in addition to the HLA-A gene, GABBR1 (MIM 603540) plays a role in the etiology of NPC.
Subjects and Methods
Study Subjects
Between August 1983 and March 2008, a cohort consisting of 4802 NPC patients from the northern parts of Taiwan, including Taipei, Keelung, Taoyuan, Hsinchu, and Miaoli areas, was recruited upon initial diagnosis at the Chang Gung Memorial Hospital (CGMH) at Linkou (Taoyuan County, Taiwan). Among these patients, 3493 were excluded because of the following reasons: lack of biopsy at CGMH (1573 cases); nontreatment at the Department of Radiation Oncology, CGMH at Linkou (619 cases); or refusal to donate blood (1301 cases). All samples (n = 918) were randomly selected from 1309 cases and categorized into three stages. Histological classification was performed according to the World Health Organization (WHO) criteria,13 and pathology records were reviewed for confirmation of NPC diagnosis. Additionally, stage, treatment, follow-up status, and limited information on family history were collected from hospital tumor registries and medical charts.
Healthy controls were recruited from local residents of Taoyuan County through a project designated “Integrated Delivery System of Health Screening, Taoyuan, Taiwan” by Chang Gung University, CGMH, and the Health Bureau of Taoyuan County, Taiwan. In total, 11,196 samples (8077 males and 6119 females) were collected from May 2007 to Dec 2007. Control samples were randomly selected according to male/female ratio and age distribution. Controls affected by any type of cancer and with a personal family history of NPC were excluded. All cases and controls were of a homogeneous Han Chinese origin.
In brief, the first group comprised 288 NPC cases (214 male and 74 female) and 297 controls (199 males and 98 females). Three hundred and thirty-nine NPC patients (232 males and 107 females) and 696 controls (544 males and 152 females) were included in stage II genotyping. The third independent sample group consisted of 296 cases (232 males and 64 females) and 944 controls (657 males and 287 females).
This study was reviewed and approved by the institutional review board and ethics committee of CGMH. Informed consent was obtained from all study participants. Demographics of the case and control samples for statistical analyses are provided in Table S1, available online.
Genotyping
Illumina Infinium Genotyping
Blood samples were collected at the time of enrollment, and genomic DNA was obtained with the use of a DNA isolation kit (Qiagen, Valencia, CA, USA). The quality and concentration of genomic DNA for each sample fulfilled the requirements for GWAS recommended for the Illumina Infinium platform. Genome-wide genotyping experiments using 600 Hap550v3_A BeadChips were outsourced to the Illumina-certified service provider, Genizon Biosciences (Genizon BioSciences, Canada).
ABI TaqMan Genotyping
ABI TaqMan technology was used for determining the genotype of target SNPs in stage II and III experiments. Candidate SNPs were examined with the use of a commercially available TaqMan SNP genotyping assay kit and GeneAmp PCR System 9700 (Applied Biosystems, Foster City, CA, USA), in accordance with the manufacturer's instructions. The sequence detection software provided by ABI was used for genotyping analysis. Two template-free controls and six DNA samples of known genotype were included in each plate as negative and positive controls, respectively.
So that genotyping quality was ensured, duplicate samples were included at different stages and the laboratory technicians were blind to the affection status and quality control samples. For the Illumina Infinium platform, in addition to the four CEPH controls included in each 96-well plate provided by the genotyping service provider, 15 out of 585 samples were genotyped twice. The concordance rate for duplicated genotyping was 99.99%. For the ABI TaqMan platform, 40 samples were genotyped twice in stage II and III experiments. The concordance rate for duplicated genotyping was 100%. The concordance rate for the 33 duplicated samples was 98.65% for genotyping controls between the Infinium and TaqMan platforms.
Sample Quality Control
Genotyping was attempted on 288 cases and 297 controls. In total, 23 samples failed the quality control assessments and were thus removed. Two samples (one case and one control) were not assessed because of their low call rate (< 99%). One case that did not match the gender predicted via the gender estimation function of BeadStudio was removed. Population stratification within samples was tested via the PLINK tool (v1.04).14 Pairwise identity-by-state (IBS) distances were calculated for examination of the existence of group differences. The permutation test for IBS differences between groups suggests that study samples came from the same group (data not shown). We also used genotype similarities implemented in PLINK to identify individuals deviating by more than four standard deviations (SD) from other study subjects. Two case samples regarded as genetic outliers were excluded from the following statistical analyses. Furthermore, cryptic relatedness between study participants was examined by estimating IBD. Pairs of DNA samples showing PI-HAT > 0.2 (estimated proportion of IBD alleles) were individually inspected, and five controls and one case were excluded. Next, we used the inbreeding coefficient (F), which compares the observed versus expected number of homozygous genotypes within an individual, to test whether genotyping contamination or extreme outbreeding exists in our samples. No samples were excluded for this test (cutoff F < −0.1), because the results of contamination evaluation were negative. Lastly, we computed the principal components to adjust for population stratification, using the EIGENSOFT package.15 Six cases and six controls were removed as outliers, because they exceeded 6 SD along one of the six top principal components. After outliers were excluded, case and control individuals largely overlapped and were distributed in a similar pattern, indicating that cases and controls were from the same population.
SNP Quality Control
For Illumina BeadChip genotyping, preliminary SNP quality control was assessed by the genotyping service provider, including call frequency (< 0.98), cluster separation (< 0.27), heterozygosity cluster intensity mean (< 0.15), allelic intensity ratio for SNPs on chromosome X in males (< 0.005), SNPs with one or more parent-child non-Mendelian error or replication errors (≥ 1), and Hardy-Weinberg equilibrium (HWE) (< 0.0005). Among the 561,466 SNPs, 7864 were rejected. Furthermore, 7347 SNPs with heterozygous haploid genotypes and 80,910 SNPs with minor allele frequency (MAF) < 1% were excluded. As a result, 480,365 SNPs were included for further statistical analysis.
In stage II and III experiments, the average call rate per sample was > 98% and the average call rate per SNP was > 98%. We eliminated three SNPs with HWE < 0.005 or MAF < 0.01 in stage II experiments and 12 such SNPs in stage III experiments, leaving 34 stage II and 39 stage III SNPs for statistical analysis.
Association and Statistical Analysis
Single-SNP Analysis
For the initial scan, we analyzed each single locus via allelic-based logistic regression with an additive logistic model to obtain the p value, odds ratio (OR), and 95% confidence interval (CI) in PLINK. Both age and gender were included as covariates in the logistic regression analysis. To address the issue of multiple testing, we performed an adaptive permutation test of case-control status and analysis 10,000 times. All association data were calculated with PLINK, with the exception of those in Figure S3, which were calculated with HelixTree software v 6.4.2, (Golden Helix, Bozeman, MT, USA). After an initial genotyping quality check, a quantile-quantile plot (Q-Q plot) of the chi-square statistic values (with the use of the inverse chi-square distribution with one degree of freedom [df]) against their expectations under the null hypothesis was used for estimating a lambda (λ) inflation factor that indicates whether systematic bias is present. The Q-Q plot and λ value were calculated with the snpMatrix of R package version 2.8.0.16 We applied the 0.025 and 0.975 quantiles of beta approximation for distribution of the statistic under the null hypothesis of independence to obtain pointwise confidence bounds (Figure S2). The genomic control parameter λ value was 1.039362, suggesting the absence of major population structure associated with case-control status.
Haplotype Analysis
In addition to single-SNP analysis, we performed allelic-based logistic regression analysis with the use of HelixTree software, followed by genome-wide haplotype analysis with the use of a haplotype trend regression algorithm fitted to a model of additive effects of haplotypes. Analyses were performed with the use of sliding window sizes of 5, 9, and 13 contiguous markers. Haplotype frequencies for each individual were estimated with the use of an expectation-maximization (EM) algorithm. The minimum haplotype frequency was set at 0.01, and haplotypes with frequencies below this threshold were binned together into a combined group.
Multivariate and Stepwise Logistic Regression Analysis
For examination of the residual effect of one SNP after adjustment with another SNP, multivariate logistic regression analyses between 12 significant SNPs located at chromosome 6p21.3 in a combined data set (stage I + stage II) were performed in PLINK, and age and gender were introduced as covariates. The same approach was performed for examination of the residual effect of 12 significant SNPs, with HLA-A∗0207/0215N and HLA-A∗110101/1121N alleles used as covariates. Stepwise logistic regression analysis, including HLA-A∗0207/0215N, HLA-A∗110101/1121N, age, gender, and 12 significant SNPs used as explanatory variables, was performed with SAS software v 9.0 (SAS Institute, Gary, NC, USA).
Linkage Disequilibrium Analysis
Genotyping results of 285 healthy control samples were used in the stage I experiment for calculating linkage disequilibrium (LD) between the “associated” SNPs. The region of chromosome 6p21 was examined with the Haploview package17 for patterns of LD and identification of haplotype blocks.
Imputation
Imputation for selection of SNPs in the stage III experiment was performed with the use of IMPUTE v0.3.2,18 based on HapMap Phase II haplotypes, and was further evaluated with SNPTEST (v1.1.4).19
Resequencing of the GABBR1 Flanking Region
Thirty-seven NPC samples with high-risk haplotypes, as well as 48 healthy controls, were selected for resequencing with a view to fine-mapping the GABBR1 flanking region. Primers were designed for amplification of a 45.9 kb genomic region covering the upstream, coding, and downstream regions of the GABBR1 gene. Sequences were derived by direct sequencing of PCR products with the ABI 3730 DNA analyzer, in accordance with the manufacturer's protocols. Bidirectionally sequenced trace files were analyzed with Mutation Surveyor v3.13 (SoftGenetics, PA, USA). Variants with MAF >1% were scored for chi-square analysis (Figure S4). Four SNPs (ss120095059, ss120095075, ss120095079, and ss120095083) identified with the aid of resequencing have now been submitted to NCBI dbSNP.
Expression Analyses
Immunohistochemical Staining
Immunohistochemical staining procedures were performed as described previously.20 A GABAB receptor 1 monoclonal antibody (raised against a peptide shared by GABAB R1a and GABAB R1b, and therefore recognizing both isoforms; clone 2D7, Abnova, Taipei, Taiwan) and a GAD67 rabbit polyclonal antibody (RB-10251, Thermo Fisher Scientific, Cheshire, UK) were used. Images of stained slides were obtained via the ScanScope CT automated slide scanning system (Aperio Technologies, Vista, CA, USA) and evaluated by experienced pathologists. The intensity of GABAB receptor 1 signal in tumor cells and adjacent epithelial cells in each biopsy sample was compared with the Wilcoxon signed-ranks test in the SPSS software version 13.0 (SPSS, Chicago, IL, USA).
EBER In Situ Hybridization
In situ hybridization (ISH) for detecting EBV-encoded RNA transcripts (EBERs) was performed with the use of the EBV Probe ISH Kit (Novocastra, Newcastle, UK), in accordance with the manufacturer's instructions.
Cell Culture
BM1 was cultured in DMEM containing 10% fetal bovine serum (FBS). The NPC (HK1) and normal nasopharyngeal epithelial (NP69) cell lines were kindly provided by Sai-Wah Tsao (Department of Anatomy, University of Hong Kong, P.R. China). HK1 was maintained in RPMI 1640 containing 10% FBS, and NP69 was cultured in defined keratinocyte-SFM medium (Invitrogen, Carlsbad, CA, USA). All cells were cultured at 37°C in a 5% CO2 incubator.
RNA Extraction and Reverse Transcription-Polymerase Chain Reaction
Total RNA extraction, reverse transcription-polymerase chain reaction (RT-PCR), and real-time PCR reactions were performed as described previously.21 For the real-time PCR experiment, the GABBR1 gene-specific primers (RT-F, 5′-GCTGGGAAGAACATGCTATC-3′; and RT-R, 5′-CTTCAAGCCAGGTACGAACT-3′) were used, and GAPDH was employed as an internal control.
Immunoblotting
Immunoblotting for detection of GABAB receptor 1 protein was performed as described previously,21 with the use of a GABAB receptor 1 monoclonal antibody (clone 2D7, Abnova, Taipei, Taiwan).
Sequence-Based HLA Typing
A total of 244 NPC cases and 228 controls were randomly selected from the stage I GWAS sample. HLA-A alleles were typed by directly sequencing the region covering exons 2 and 3 of the HLA-A gene.22 All sequences were assembled and compared with the NCBI dbMHC database23 for identification of the HLA-A genotype. Because polymorphisms outside exons 2 and 3 were not analyzed, some groups of alleles with sequence differences in the other exons could not be determined in this study. In such cases, an abbreviation of some allele group was assigned, on the basis of the IMGT/HLA Ambiguous Allele Combinations File24 (release 2.25.2, 4/17/2009). Statistical analysis was performed with the use of the R script. Allele frequencies were computed between cases and controls and accessed with the chi-square test (df = 1) or Fisher's exact test at an expected cell count of < 5. All statistical tests were two-sided.
Results
Genome-wide Screening of NPC-Associated SNP Markers
We initially genotyped 561,466 SNPs in 288 NPC cases and 297 healthy controls (stage I; Table S1) collected from the CGMH at Linkou, Taoyuan, and community hospitals of Taoyuan County. Stringent quality control criteria were applied to all of the samples and SNP markers tested. A total of 11 cases and 12 controls were removed because of low call rates (< 99%), identity problems, and failure in IBD or principle components analysis (PCA) genetic-outlier tests. In terms of SNP markers, 81,101 SNPs were eliminated after a series of quality control steps (Figure S1). The final GWA analysis was performed on 480,365 SNPs in 277 cases and 285 controls. Disease association was systematically tested across the genome with the logistic regression module in PLINK (see Subjects and Methods), and several putative association regions for NPC were detected. The distribution of p values was similar to the expected distribution (the estimated genomic control parameter was 1.039), implying no systematic increase in false-positive findings as a result of population stratification or other sources of bias (Figure S2). Furthermore, we assessed the significance level of SNPs by using 10,000 permutations. Among the 480,365 SNPs, 15 significant SNP markers, located at chromosomes 6, 13, and 20, with nominal p values (adjusted for age and gender) of < 5 × 10⁻⁵, were identified (Figure 1 and Table S2).
Figure 1.
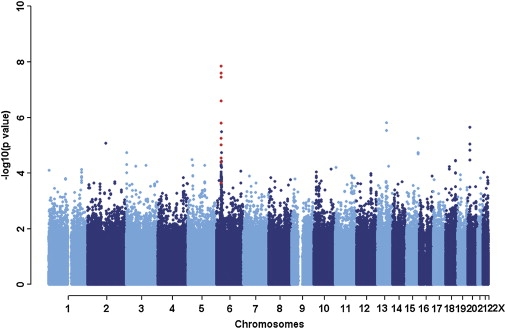
Summary of GWAS Results, Based on Chromosome
Associations with NPC were determined for 480,365 SNPs among 277 cases and 285 controls. The x axis represents the position on each chromosome from the p terminus to the q terminus, and the y axis depicts p values on a minus logarithmic scale. Analysis was adjusted for age and gender with the use of a logistic regression model. Chromosomes are shown in alternating colors for clarity. Red dots indicate SNPs with significant p values in the combined data from three stages (Table 1). Data on the X chromosome are not presented, due to gender adjustment during statistical analysis.
For further evaluation of GWAS data, genome-wide single-marker analysis was performed with HelixTree software. Similar to the results obtained with PLINK, SNP markers close to the GABBR1, HLA-A (MIM 142800), and HLA complex group 9 (HCG9) genes were significant. In addition, haplotype analysis revealed significant associations in the same chromosome 6p21.3 region (Figure S3), further supporting our single-SNP association results. Two additional regions in close proximity to HLA-F (MIM 143110), flotillin 1 (FLOT [MIM 606998]), and immediate early response 3 (IER3 [MIM 602996]) genes, which exhibited low significance in single-SNP analysis, were statistically significant in haplotype analysis (Table S2).
Validation of Significant Markers in the Second Group of Case-Control Samples
To validate the GWAS findings, we genotyped 33 SNPs with the most significant p values (15 from single-marker analysis and 18 from haplotype analysis; Table S2) in an independent set of case-control samples (stage II), including 339 NPC cases and 696 controls, using the TaqMan assay. Twelve out of 33 SNPs were significantly linked to NPC susceptibility (with pcombined I+II < 5 × 10⁻⁵) and mapped to a 430 kb region containing the GABBR1, HLA-F, HLA-A, and HCG9 genes on chromosome 6p21.3 (rs2267633–rs16896923) (Figure 2 and Table 1). One of the most significant SNPs (rs29232; (pcombined I + II = 9.60 × 10⁻¹², OR =1.71, 95% CI =1.46∼1.99) and three other markers (rs29230, rs2076483, and rs2267633) were located close to or within the GABBR1 gene. Two other strongly associated markers, rs2517713 and rs2975042 (Pcombined I+II = 5.54 × 10⁻¹² and 1.57 × 10⁻¹¹, respectively), were located downstream of the HLA-A gene. Two associated SNPs (rs3129055 and rs9258122) were identified in the upstream regulatory region of the HLA-F gene, and four (rs9260734, rs3869062, rs5009448, and rs16896923) were identified in the HCG9 gene region. Our results show that (1) the four associated SNPs in the HCG9 gene are in strong LD (r2 = 0.8; Table S3) with those located in the HLA-A gene, (2) no residual effects of SNPs of HCG9 are detected after adjustment with SNPs in HLA-A genes (Table 2), and (3) the HLA-A gene is closely associated with NPC susceptibility.7,25 Thus, we conclude that the association signals observed in the HCG9 gene are primarily due to the effects of HLA-A.
Figure 2.
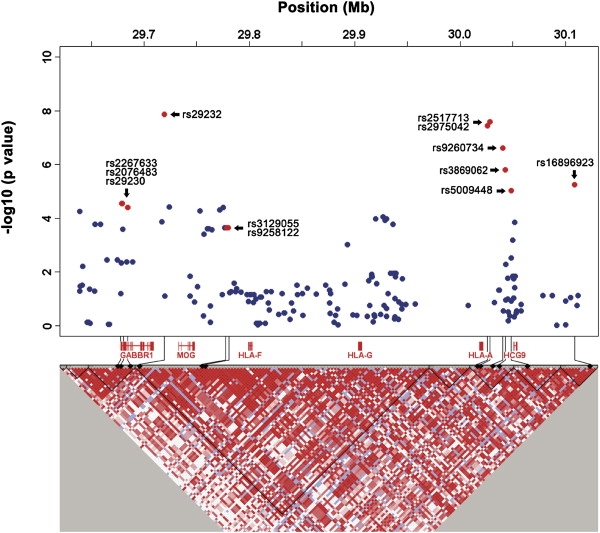
Association Analyses of SNPs at Chromosome 6p21.3
Top: Blue dots indicate the p values for association testing drawn from first-stage GWAS on a minus logarithmic scale. Red dots depict SNPs with significant p values in combined (three stages) data. Bottom: Detailed LD structure depicted in HaploView. Analysis was adjusted for age and gender with the use of a logistic regression model. The corresponding location of genes is shown below. Pairwise linkage disequilibrium estimated in 285 control samples depicted in HaploView is shown at the bottom. Increasing intensities of red represent higher r2 values.
Table 1.
Significant SNPs Identified through GWAS and Located at Chromosome 6p21.3
| SNPa | Chr. | Risk Allele | Risk Allele Freq.b |
OR (95% CI)b | Stage I p Value | Stage II p Value | Stage III p Value | Combined p Value | Nearest Gene | |
|---|---|---|---|---|---|---|---|---|---|---|
| Case | Control | |||||||||
| rs2517713 | 6 | A | 0.763 | 0.622 | 1.88 (1.65–2.15) | 3.56E−08∗∗∗ | 2.61E−05∗∗∗ | 4.07E−10∗∗∗ | 3.90E−20∗∗∗ | HLA-A |
| rs2975042 | 6 | A | 0.759 | 0.621 | 1.86 (1.63–2.13) | 2.54E−08∗∗∗ | 9.21E−05∗∗∗ | 7.78E−10∗∗∗ | 1.60E−19∗∗∗ | HLA-A |
| rs9260734 | 6 | G | 0.782 | 0.658 | 1.85 (1.61–2.12) | 2.49E−07∗∗∗ | 6.29E−04∗∗ | 6.14E−10∗∗∗ | 6.77E−18∗∗∗ | HCG9 |
| rs29232 | 6 | A | 0.586 | 0.456 | 1.67 (1.48–1.88) | 1.39E−08∗∗∗ | 4.52E−05∗∗∗ | 1.34E−07∗∗∗ | 8.97E−17∗∗∗ | GABBR1 |
| rs3869062 | 6 | A | 0.792 | 0.683 | 1.78 (1.55–2.05) | 1.58E−06∗∗∗ | 8.13E−04∗∗ | 6.47E−09∗∗∗ | 8.68E−16∗∗∗ | HCG9 |
| rs5009448 | 6 | G | 0.750 | 0.637 | 1.72 (1.51–1.96) | 9.41E−06∗∗∗ | 6.44E−04∗∗ | 1.38E−09∗∗∗ | 1.30E−15∗∗∗ | HCG9 |
| rs3129055 | 6 | G | 0.406 | 0.312 | 1.51 (1.34–1.71) | 2.24E−04∗∗ | 6.28E−03∗ | 1.59E−06 ∗∗∗ | 7.36E−11∗∗∗ | HLA-F |
| rs9258122 | 6 | A | 0.406 | 0.315 | 1.49 (1.32–1.69) | 2.24E−04∗∗ | 2.02E−02∗ | 7.32E−07 ∗∗∗ | 3.33E−10∗∗∗ | HLA-F |
| rs16896923 | 6 | A | 0.850 | 0.768 | 1.66 (1.42–1.94) | 5.63E−06∗∗∗ | 2.29E−03∗ | 2.66E−05 ∗∗∗ | 2.49E−10∗∗∗ | HCG9 |
| rs2267633 | 6 | A | 0.821 | 0.741 | 1.57 (1.36–1.82) | 2.86E−05∗∗∗ | 4.17E−02 | 2.82E−05 ∗∗∗ | 1.28E−09∗∗∗ | GABBR1 |
| rs2076483 | 6 | A | 0.821 | 0.741 | 1.57 (1.36–1.82) | 2.86E−05∗∗∗ | 3.85E−02 | 3.13E−05 ∗∗∗ | 1.49E−09∗∗∗ | GABBR1 |
| rs29230 | 6 | A | 0.819 | 0.743 | 1.56 (1.34–1.80) | 3.99E−05∗∗ | 5.76E−02 | 4.03E−05 ∗∗∗ | 4.77E−09∗∗∗ | GABBR1 |
Significant SNPs identified from GWAS (stage I) and validated by two independent sets of case-control samples (stage II and III). Analysis was adjusted for age and gender with the use of a logistic regression model.
Risk allele frequencies and odds ratios (OR) were calculated on the basis of combined samples.
Permuted p value < 0.01. All permuted p values were computed with 10,000 permutations. For detailed information on assays, see Tables S2 and S7.
Permuted p value < 0.001. All permuted p values were computed with 10,000 permutations. For detailed information on assays, see Tables S2 and S7.
Permuted p value < 0.0001. All permuted p values were computed with 10,000 permutations. For detailed information on assays, see Tables S2 and S7.
Table 2.
Multivariate Logistic Regression Analysis for Significant SNPs at Chromosome 6p21.3
aMultivariate logistic analysis was performed. We used the combined stage I and stage II data sets in PLINK were used to examine the residual effects of SNP 1 while using SNP 2 as a covariate, and we adjusted the results for age and gender. SNPs with an adjusted p value < 0.01 are highlighted in bold.
Validation of Genetic Variations in the GABBR1 Gene in Relation to NPC Susceptibility
To our knowledge, this is the first study to show an association between the genetic variants of the GABBR1 gene and NPC. SNP rs29232 is located at the upstream regulatory region (−10571) of GABBR1 or ∼306 kb telomeric to the two significant markers found in the HLA-A gene. In contrast to HCG9, rs29232 was in moderate LD (r2 = 0.3) with SNPs located in HLA-A, ascertained on the basis of the LD map built from the 285 control samples in stage I analysis (Table S3). To investigate whether the association detected with the GABBR1 gene is independent of HLA-A signals, we carried out multivariate logistic regression analysis, using other significant SNPs as covariates. After adjustment for significant SNPs close to the HLA-A gene (rs2975042 and rs2517713), only rs29232 SNP in the GABBR1 gene retained significance (pcombined I + II = 3.52 × 10⁻⁴ and 1.41 × 10⁻³; Table 2), and vice versa (pcombined I + II = 5.72 × 10⁻⁴ and 2.57 × 10⁻⁴).
We also performed a sequence-based typing approach to determine the HLA-A allele in our samples used in the stage I (GWAS) experiment (228 controls and 244 cases; see Table S4), with a view to interpreting our findings in the light of HLA typing information. Similar to previous findings,8 the allele frequency of A∗0207/0215N was significantly higher (p = 2.28 × 10⁻⁶) in NPC patients in comparison to controls, whereas the frequency of A∗110101/1121N was markedly lower in NPC patients (p = 1.88 × 10⁻³). Accordingly, we included age, gender, A∗0207/0215N, and/or A∗110101/1121N as covariates for multivariate logistic regression analysis. Association of rs29232, rs2517713, and rs2975042 with NPC susceptibility remained significant (p < 5 × 10⁻⁴), even when conditioned by A∗0207/0215N, A∗110101/1121N, or both (Table S5). Stepwise logistic regression analysis26 was also performed in the same data set by including age, gender, A∗0207/0215N, A∗110101/1121N, and 12 significant SNPs as explanatory variables. As shown in Table S6, the final model included A∗0207/0215N, rs2975042 (HLA-A), rs3129055 (HLA-F), gender, and rs29232 (GABBR1), suggesting that rs29232 is independent of HLA-A effects. On the basis of these results, we suggest that the HLA-A gene alone does not fully account for the association between NPC and the MHC region on chromosome 6. In keeping with a previous linkage study implying that an unknown gene closely linked to the HLA locus confers increased risk of NPC,27 our data further suggest that genetic variants in or close to the GABBR1 gene are potential risk variants.
Fine Mapping of GABBR1 by Resequencing and Identification of Additional Significant SNPs
Given the detection of a very strong signal (rs29232) upstream of GABBR1, genomic regions encompassing the regulatory and coding regions of GABBR1 in 37 NPC cases with high-risk haplotypes (identified from GWAS) and 48 randomly selected controls were resequenced for identification of the mutations and variants associated with NPC susceptibility. No mutations were detected in the resequencing region (data not shown), and 22 additional significant SNPs were individually identified in the upstream, intron, and downstream regions (p < 5 × 10⁻⁷, chi-square test), as shown in Figure S4.
Further Validation of Significant SNPs with a Third Group of Samples
To further validate our results in the Taiwanese population and fine map the 6p21.3 region, we examined 51 SNPs that were: (1) significant in combined data of stage I and stage II experiments, (2) identified from GABBR1 gene region resequencing; and (3) potentially functional, in that they were selected by imputation and found to be located in loci including GABBR1, HLA-F, and HLA-A/HCG-9 (see Subjects and Methods), in the third independent group consisting of 296 cases and 944 controls (stage III). Twelve SNPs were excluded from subsequent analysis as a result of failure of the quality control check. As shown in Table 1 and Table S7, 23 among the 39 SNPs were significant, with a p value < 5 × 10⁻⁵. Among these SNPs, nine were located in GABBR1, six in HLA-F, and eight in the HLA-A/HCG9 gene regions. More importantly, the observed association of the 12 SNPs identified in GWAS was replicated. The issue of whether these variants can modulate GABBR1 expression levels or alternative splicing requires further investigation. Collectively, the stage III genotyping results further support the theory that genetic variants located in the GABBR1, HLA-F, and HLA-A/HCG9 loci are strongly associated with NPC susceptibility.
Expression of GABAB Receptor 1 and GABA Biosynthetic Enzyme, GAD, in NPC Tumor Cells
GWAS and replication results indicate that GABBR1 is a potential susceptibility gene for NPC. This prompted us to investigate the plausibility that this gene is biologically related to NPC risk. GABBR1 encodes a protein denoted GABAB receptor 1, a G protein-coupled receptor that forms a heterodimer with GABAB receptor 2, triggering downstream signaling events in response to binding of the ligand, gamma-aminobutyric acid (GABA). The GABAergic system possibly plays a role in proliferation, differentiation, and migration of cancer cells.28 Expression levels of GABA and its biosynthetic enzyme, GAD67, are significantly increased in several neoplastic tissues, such as colorectal carcinoma,29 breast cancer,30 gastric cancer,31 and prostate cancer.32 However, similar analyses have not been performed in NPC. Accordingly, the expression and distribution of GABAB receptor 1 protein and glutamate decarboxylase (GAD67) were evaluated in 146 NPC biopsies randomly selected from the CGMH tumor bank with the use of immunohistochemical staining. Positive signals of the GABAB receptor 1 protein were detected in more than 77% (113 out of 146) of the biopsies tested. GABAB receptor 1 protein was identified in NPC tumor cells, as observed from EBV-encoded RNAs (EBERs; Figure 3B). Adjacent normal nasopharynx epithelial cells were identified in 100 of 146 NPC biopsies, and GABAB receptor 1 protein 1 was detected in 71 cases (71%). The intensity of the GABAB receptor 1 signal in tumor cells was significantly higher than that detected in adjacent normal epithelial cells (p < 0.001; details shown in Table S8). Interestingly, we found that infiltrated leukocytes and endothelial cells also express GABAB receptor 1 protein (Figures 3C and 3D). Notably, GAD67 was also detected in tumor cells (Figure S5), indicating that NPC tumor cells secrete GABA, which may exert its effects on tumor cells via the autocrine pathway or on surrounding cells via the paracrine pathway.
Figure 3.
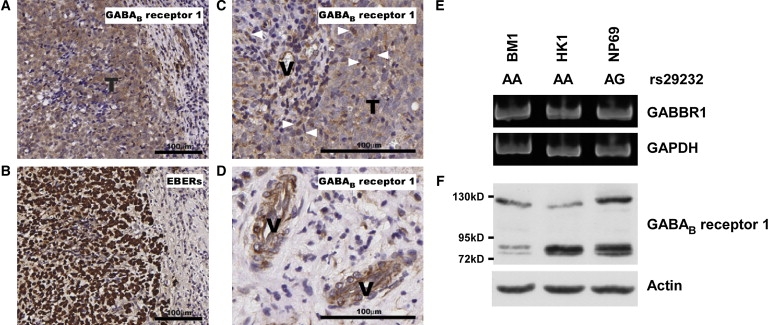
GABAB Receptor 1 Protein Expression in NPC Tumor Cells
GABAB receptor 1 protein was detected in NPC tumor cells (A), infiltrating leukocytes (C, indicated by arrowheads), and endothelial cells (D, indicated by “V”) by immunohistochemical staining. Distribution of NPC tumor cells is depicted with positive nuclear EBER signals (B). Expression of GABBR1 transcripts (E) and protein (F) was detected in NPC cell lines and in the normal nasopharyngeal epithelial cell line, NP69.
NPC Tumor Cell Lines Express GABAB Receptor 1 Protein
We also examined the GABBR1 transcript and protein levels in NPC cell lines and in an immortalized nasopharyngeal epithelial cell line (NP69), using RT-PCR (Figure 3E) and immunolotting (Figure 3F). One NPC cell line (BM1) was established from NPC patients from Taiwan and the other (HK1) from NPC patients from Hong Kong. Both cell lines expressed GABBR1 transcripts and protein. BM1 and HK1 cells contained the AA genotype at rs29232, whereas NP69 carried the AG genotype. Although the relationship between risk allele “A” of rs29232 and gene expression levels remains to be elucidated, we speculate that GABAergic systems are involved in NPC tumor cell proliferation, angiogenesis, or immunomodulation processes. Further investigation is essential for clear establishment of the relationship between GABBR1 and NPC development.
Discussion
We applied the GWA approach to identify loci associated with NPC within the Taiwanese population. Initially, we identified 33 NPC-associated genetic variants by using a relatively small case-control set, and we replicated the findings in a second independent case-control set of samples. Loci within three different genes (GABBR1, HLA-F, and HLA-A) in the chromosome 6p21.3 region were associated with NPC susceptibility. The contribution of each locus was examined by multivariate and stepwise logistic regression analyses, which showed that GABBR1 is an independent risk factor. In view of this finding, we resequenced the GABBR1 gene region, revealing 22 additional NPC-associated SNPs. The putative associations of these SNPs, as well as those identified via imputation methods, were further validated in a third independent case-control set. Finally, we evaluated the expression levels of GABBR1 in NPC biopsies and cell lines, and we detected GABAB receptor 1 protein in these samples.
The chromosome 6p21.3 region was previously mapped as a NPC-susceptibility locus via the positional cloning approach,33 and a region 132 kb in length covering the HLA-A, HLA-B, HLA-C, and HLA-E loci is implicated in NPC susceptibility in the Taiwanese population.34 In this study, we employed a high-resolution SNP array platform encompassing the entire genome, confirmed the association of this chromosomal region with NPC, and identified specific SNPs within the HLA-A, HLA-F, and GABBR1 loci as potentially important risk determinants.
Some NPC-associated risk loci identified in this study were located in genes, such as HLA-A and HCG9, that are reportedly associated with the development of EBV-associated Hodgkin lymphoma (HL [MIM 236000])35 and infectious mononucleosis (IM) after primary EBV infection.36 These variants possibly alter disease progression after EBV infection, thereby modulating EBV-related NPC risk.37
In addition to the HLA-A locus, HLA-F was associated with NPC risk. The HLA-F protein is primarily retained intracellularly in untransformed B cells but, intriguingly, can be detected on the surface of EBV-transformed B lymphoblastoid cell lines from the same individuals,38 implying a role of viral infection or transformation in releasing HLA-F from the endoplasmic reticulum and Golgi. A genome-wide gene expression profiling experiment has revealed that downregulation of HLA-A, HCG9, and HLA-F is correlated with EBV-encoded EBNA1 expression,39 further suggesting a potential association between these HLA gene products and EBV infection.
Notably, we identified and confirmed an association in the GABBR1 gene in close proximity to a previously reported NPC-susceptible microsatellite marker, D6S1624.40 The MHC region is characterized by extensive LD and high polymorphisms. Because of the strong LD of the entire HLA region, it is difficult to ascertain whether the association in GABBR1 is completely independent of those identified in the HLA-A loci or whether any associated locus is a functional determinant of NPC risk. However, data from stepwise or multivariate logistic regression analyses (Table 2, Tables S5 and S6), resequencing-based discovery of additional NPC-associated SNPs in GABBR1 (Table S7), and GABAB receptor 1 protein expression data from NPC biopsies and cell lines support the theory that GABBR1 plays a functional role in the etiology of NPC.
There are some limitations to the interpretation of data obtained in this study. GWAS generally suffers from diminished power as a result of the need to correct for multiple comparisons when assessing statistical significance. We applied staged analysis with sequential replications to mitigate this problem. Nevertheless, our initial case-control sample was relatively small. Although we are able to identify a number of highly significant associations (e.g., p < 10−5) and replicate them in independent case-control sets, it is possible that some SNP associations with larger p values, particularly those with larger effect sizes, are of greater biological importance than those identified here. Therefore, genetic variants with marginal p values (e.g., 10−4 to 10−5) are considered potential functional determinants and should be further explored to obtain insights into the molecular mechanisms underlying NPC carcinogenesis. Future challenges include determination of the molecular characteristics of the variants and their mechanistic roles in NPC susceptibility. Another limitation of this study is the lack of individual environmental exposure data. This deficiency may have decreased our sensitivity in detecting genetic associations, given that we were unable to adjust for major environmental risk factors, and may have precluded our ability to address questions related to gene-environment interactions. Further large-scale, population-based genetic epidemiologic studies of NPC with detailed individual risk factor information, particularly EBV antibody titers, are essential for assessing and characterizing the relative importance of genetic and environmental risk factors in NPC susceptibility.
Supplemental Data
Supplemental Data include five figures and eight tables and can be found with this article online at http://www.ajhg.org/.
Supplemental Data
Web Resources
The URLs for data presented herein are as follows:
NCBI dbMHC, http://www.ncbi.nlm.nih.gov/gv/mhc/main.cgi?cmd=init
NCBI dbSNP, http://www.ncbi.nlm.nih.gov/SNP/
Online Mendelian Inheritance in Man (OMIM), http://www.ncbi.nlm.nih.gov/Omim/
Accession Numbers
The NCBI dbSNP accession numbers for the SNPs reported in this paper are ss120095059, ss120095075, ss120095079, and ss120095083.
Acknowledgments
We thank all of the individuals who participated in the study, as well as our colleagues in the Molecular Epidemiology Core and Biostatistics Core of Chang Gung Molecular Medicine Research Center. We are additionally grateful to Bruno Paquin (Genizon Biosciences, Quebec, Canada) for suggestions on data analysis and to P.C. Huang (Department of Biochemistry and Molecular Biology, Johns Hopkins University, Baltimore, MD, USA), Kung-Yee Liang (Department of Biostatistics, Bloomberg School of Public Health, Johns Hopkins University, Baltimore, MD, USA), and Cathy S.J. Fann (Institute of Biomedical Sciences, Academic Sinica, Taipei, Taiwan) for critical reading of the manuscript. The study is supported by grants from the Ministry of Education (to Chang Gung University), the National Science Council (NSC 94-2314-B-182A-188, 94-3112-B-182-005, 95-2320-B-182-001, and 97-3112-B-182-008) and Chang Gung Memorial Hospital (CMRPD150961 and CMRPG360221), Taiwan. Y.Y.S. was previously supported by an RO3 (CA123620) grant from National Cancer Institute and the Department of Epidemiology, Bloomberg School of Public Health, Johns Hopkins University, USA. This work was performed before Y.Y.S. moved to the Institute of Mental Health of the National Institutes of Health, USA.
References
- 1.Cancer Incidence in Five Continents (1997) Vol. VII. J. Ferlay, R.J. Black, S.L. Whelan, D.M. Parkin, eds. (Lyon, France: IARC Sci. Publ.) i–xxxiv, 1–1240. [PubMed]
- 2.zur Hausen H., Schulte-Holthausen H., Klein G., Henle W., Henle G., Clifford P., Santesson L. EBV DNA in biopsies of Burkitt tumours and anaplastic carcinomas of the nasopharynx. Nature. 1970;228:1056–1058. doi: 10.1038/2281056a0. [DOI] [PubMed] [Google Scholar]
- 3.Buell P. The effect of migration on the risk of nasopharyngeal cancer among Chinese. Cancer Res. 1974;34:1189–1191. [PubMed] [Google Scholar]
- 4.Marks J.E., Phillips J.L., Menck H.R. The National Cancer Data Base report on the relationship of race and national origin to the histology of nasopharyngeal carcinoma. Cancer. 1998;83:582–588. doi: 10.1002/(sici)1097-0142(19980801)83:3<582::aid-cncr29>3.0.co;2-r. [DOI] [PubMed] [Google Scholar]
- 5.Su C.K., Wang C.C. Prognostic value of Chinese race in nasopharyngeal cancer. Int. J. Radiat. Oncol. Biol. Phys. 2002;54:752–758. doi: 10.1016/s0360-3016(02)02969-3. [DOI] [PubMed] [Google Scholar]
- 6.Wei W.I., Sham J.S. Nasopharyngeal carcinoma. Lancet. 2005;365:2041–2054. doi: 10.1016/S0140-6736(05)66698-6. [DOI] [PubMed] [Google Scholar]
- 7.Simons M.J., Wee G.B., Chan S.H., Shanmugaratnam K., Day N.E., de-The G. Immunogenetic aspects of nasopharyngeal carcinoma (NPC) III. HL-a type as a genetic marker of NPC predisposition to test the hypothesis that Epstein-Barr virus is an etiological factor in NPC. IARC Sci. Publ. 1975;11:249–258. [PubMed] [Google Scholar]
- 8.Hildesheim A., Apple R.J., Chen C.J., Wang S.S., Cheng Y.J., Klitz W., Mack S.J., Chen I.H., Hsu M.M., Yang C.S. Association of HLA class I and II alleles and extended haplotypes with nasopharyngeal carcinoma in Taiwan. J. Natl. Cancer Inst. 2002;94:1780–1789. doi: 10.1093/jnci/94.23.1780. [DOI] [PubMed] [Google Scholar]
- 9.Cho E.Y., Hildesheim A., Chen C.J., Hsu M.M., Chen I.H., Mittl B.F., Levine P.H., Liu M.Y., Chen J.Y., Brinton L.A. Nasopharyngeal carcinoma and genetic polymorphisms of DNA repair enzymes XRCC1 and hOGG1. Cancer Epidemiol. Biomarkers Prev. 2003;12:1100–1104. [PubMed] [Google Scholar]
- 10.Hildesheim A., Chen C.J., Caporaso N.E., Cheng Y.J., Hoover R.N., Hsu M.M., Levine P.H., Chen I.H., Chen J.Y., Yang C.S. Cytochrome P4502E1 genetic polymorphisms and risk of nasopharyngeal carcinoma: results from a case-control study conducted in Taiwan. Cancer Epidemiol. Biomarkers Prev. 1995;4:607–610. [PubMed] [Google Scholar]
- 11.Nazar-Stewart V., Vaughan T.L., Burt R.D., Chen C., Berwick M., Swanson G.M. Glutathione S-transferase M1 and susceptibility to nasopharyngeal carcinoma. Cancer Epidemiol. Biomarkers Prev. 1999;8:547–551. [PubMed] [Google Scholar]
- 12.Cheng Y.J., Chien Y.C., Hildesheim A., Hsu M.M., Chen I.H., Chuang J., Chang J., Ma Y.D., Luo C.T., Hsu W.L. No association between genetic polymorphisms of CYP1A1, GSTM1, GSTT1, GSTP1, NAT2, and nasopharyngeal carcinoma in Taiwan. Cancer Epidemiol. Biomarkers Prev. 2003;12:179–180. [PubMed] [Google Scholar]
- 13.Shanmugaratnam K. Histological typing of nasopharyngeal carcinoma. IARC Sci. Publ. 1978;20:3–12. [PubMed] [Google Scholar]
- 14.Purcell S., Neale B., Todd-Brown K., Thomas L., Ferreira M.A., Bender D., Maller J., Sklar P., de Bakker P.I., Daly M.J. PLINK: a tool set for whole-genome association and population-based linkage analyses. Am. J. Hum. Genet. 2007;81:559–575. doi: 10.1086/519795. [DOI] [PMC free article] [PubMed] [Google Scholar]
- 15.Price A.L., Patterson N.J., Plenge R.M., Weinblatt M.E., Shadick N.A., Reich D. Principal components analysis corrects for stratification in genome-wide association studies. Nat. Genet. 2006;38:904–909. doi: 10.1038/ng1847. [DOI] [PubMed] [Google Scholar]
- 16.Clayton D., Leung H.T. An R package for analysis of whole-genome association studies. Hum. Hered. 2007;64:45–51. doi: 10.1159/000101422. [DOI] [PubMed] [Google Scholar]
- 17.Barrett J.C., Fry B., Maller J., Daly M.J. Haploview: analysis and visualization of LD and haplotype maps. Bioinformatics. 2005;21:263–265. doi: 10.1093/bioinformatics/bth457. [DOI] [PubMed] [Google Scholar]
- 18.Marchini J., Howie B., Myers S., McVean G., Donnelly P. A new multipoint method for genome-wide association studies by imputation of genotypes. Nat. Genet. 2007;39:906–913. doi: 10.1038/ng2088. [DOI] [PubMed] [Google Scholar]
- 19.Wellcome Trust Case Control Consortium Genome-wide association study of 14,000 cases of seven common diseases and 3,000 shared controls. Nature. 2007;447:661–678. doi: 10.1038/nature05911. [DOI] [PMC free article] [PubMed] [Google Scholar]
- 20.Tse K.P., Tsang N.M., Chen K.D., Li H.P., Liang Y., Hsueh C., Chang K.P., Yu J.S., Hao S.P., Hsieh L.L. MCP-1 Promoter Polymorphism at 2518 is associated with metastasis of nasopharyngeal carcinoma after treatment. Clin. Cancer Res. 2007;13:6320–6326. doi: 10.1158/1078-0432.CCR-07-1029. [DOI] [PubMed] [Google Scholar]
- 21.Tsai C.N., Tsai C.L., Tse K.P., Chang H.Y., Chang Y.S. The Epstein-Barr virus oncogene product, latent membrane protein 1, induces the downregulation of E-cadherin gene expression via activation of DNA methyltransferases. Proc. Natl. Acad. Sci. USA. 2002;99:10084–10089. doi: 10.1073/pnas.152059399. [DOI] [PMC free article] [PubMed] [Google Scholar]
- 22.Santamaria P., Lindstrom A.L., Boyce-Jacino M.T., Myster S.H., Barbosa J.J., Faras A.J., Rich S.S. HLA class I sequence-based typing. Hum. Immunol. 1993;37:39–50. doi: 10.1016/0198-8859(93)90141-m. [DOI] [PubMed] [Google Scholar]
- 23.Helmberg W., Dunivin R., Feolo M. The sequencing-based typing tool of dbMHC: typing highly polymorphic gene sequences. Nucleic Acids Res. 2004;32:W173–W175. doi: 10.1093/nar/gkh424. [DOI] [PMC free article] [PubMed] [Google Scholar]
- 24.Robinson J., Waller M.J., Parham P., de Groot N., Bontrop R., Kennedy L.J., Stoehr P., Marsh S.G. IMGT/HLA and IMGT/MHC: sequence databases for the study of the major histocompatibility complex. Nucleic Acids Res. 2003;31:311–314. doi: 10.1093/nar/gkg070. [DOI] [PMC free article] [PubMed] [Google Scholar]
- 25.Chan S.H., Day N.E., Kunaratnam N., Chia K.B., Simons M.J. HLA and nasopharyngeal carcinoma in Chinese–a further study. Int. J. Cancer. 1983;32:171–176. doi: 10.1002/ijc.2910320206. [DOI] [PubMed] [Google Scholar]
- 26.Aly T.A., Baschal E.E., Jahromi M.M., Fernando M.S., Babu S.R., Fingerlin T.E., Kretowski A., Erlich H.A., Fain P.R., Rewers M.J. Analysis of single nucleotide polymorphisms identifies major type 1A diabetes locus telomeric of the major histocompatibility complex. Diabetes. 2008;57:770–776. doi: 10.2337/db07-0900. [DOI] [PubMed] [Google Scholar]
- 27.Lu S.J., Day N.E., Degos L., Lepage V., Wang P.C., Chan S.H., Simons M., McKnight B., Easton D., Zeng Y. Linkage of a nasopharyngeal carcinoma susceptibility locus to the HLA region. Nature. 1990;346:470–471. doi: 10.1038/346470a0. [DOI] [PubMed] [Google Scholar]
- 28.Watanabe M., Maemura K., Oki K., Shiraishi N., Shibayama Y., Katsu K. Gamma-aminobutyric acid (GABA) and cell proliferation: focus on cancer cells. Histol. Histopathol. 2006;21:1135–1141. doi: 10.14670/HH-21.1135. [DOI] [PubMed] [Google Scholar]
- 29.Kleinrok Z., Matuszek M., Jesipowicz J., Matuszek B., Opolski A., Radzikowski C. GABA content and GAD activity in colon tumors taken from patients with colon cancer or from xenografted human colon cancer cells growing as s.c. tumors in athymic nu/nu mice. J. Physiol. Pharmacol. 1998;49:303–310. [PubMed] [Google Scholar]
- 30.Opolski A., Mazurkiewicz M., Wietrzyk J., Kleinrok Z., Radzikowski C. The role of GABA-ergic system in human mammary gland pathology and in growth of transplantable murine mammary cancer. J. Exp. Clin. Cancer Res. 2000;19:383–390. [PubMed] [Google Scholar]
- 31.Matuszek M., Jesipowicz M., Kleinrok Z. GABA content and GAD activity in gastric cancer. Med. Sci. Monit. 2001;7:377–381. [PubMed] [Google Scholar]
- 32.Takehara A., Hosokawa M., Eguchi H., Ohigashi H., Ishikawa O., Nakamura Y., Nakagawa H. Gamma-aminobutyric acid (GABA) stimulates pancreatic cancer growth through overexpressing GABAA receptor pi subunit. Cancer Res. 2007;67:9704–9712. doi: 10.1158/0008-5472.CAN-07-2099. [DOI] [PubMed] [Google Scholar]
- 33.Lu C.C., Chen J.C., Jin Y.T., Yang H.B., Chan S.H., Tsai S.T. Genetic susceptibility to nasopharyngeal carcinoma within the HLA-A locus in Taiwanese. Int. J. Cancer. 2003;103:745–751. doi: 10.1002/ijc.10861. [DOI] [PubMed] [Google Scholar]
- 34.Lu C.C., Chen J.C., Tsai S.T., Jin Y.T., Tsai J.C., Chan S.H., Su I.J. Nasopharyngeal carcinoma-susceptibility locus is localized to a 132 kb segment containing HLA-A using high-resolution microsatellite mapping. Int. J. Cancer. 2005;115:742–746. doi: 10.1002/ijc.20946. [DOI] [PubMed] [Google Scholar]
- 35.Niens M., van den Berg A., Diepstra A., Nolte I.M., van der Steege G., Gallagher A., Taylor G.M., Jarrett R.F., Poppema S., te Meerman G.J. The human leukocyte antigen class I region is associated with EBV-positive Hodgkin's lymphoma: HLA-A and HLA complex group 9 are putative candidate genes. Cancer Epidemiol. Biomarkers Prev. 2006;15:2280–2284. doi: 10.1158/1055-9965.EPI-06-0476. [DOI] [PubMed] [Google Scholar]
- 36.McAulay K.A., Higgins C.D., Macsween K.F., Lake A., Jarrett R.F., Robertson F.L., Williams H., Crawford D.H. HLA class I polymorphisms are associated with development of infectious mononucleosis upon primary EBV infection. J. Clin. Invest. 2007;117:3042–3048. doi: 10.1172/JCI32377. [DOI] [PMC free article] [PubMed] [Google Scholar]
- 37.Chang E.T., Adami H.O. The enigmatic epidemiology of nasopharyngeal carcinoma. Cancer Epidemiol. Biomarkers Prev. 2006;15:1765–1777. doi: 10.1158/1055-9965.EPI-06-0353. [DOI] [PubMed] [Google Scholar]
- 38.Lee N., Geraghty D.E. HLA-F surface expression on B cell and monocyte cell lines is partially independent from tapasin and completely independent from TAP. J. Immunol. 2003;171:5264–5271. doi: 10.4049/jimmunol.171.10.5264. [DOI] [PubMed] [Google Scholar]
- 39.Sengupta S., den Boon J.A., Chen I.H., Newton M.A., Dahl D.B., Chen M., Cheng Y.J., Westra W.H., Chen C.J., Hildesheim A. Genome-wide expression profiling reveals EBV-associated inhibition of MHC class I expression in nasopharyngeal carcinoma. Cancer Res. 2006;66:7999–8006. doi: 10.1158/0008-5472.CAN-05-4399. [DOI] [PubMed] [Google Scholar]
- 40.Ooi E.E., Ren E.C., Chan S.H. Association between microsatellites within the human MHC and nasopharyngeal carcinoma. Int. J. Cancer. 1997;74:229–232. doi: 10.1002/(sici)1097-0215(19970422)74:2<229::aid-ijc16>3.0.co;2-8. [DOI] [PubMed] [Google Scholar]
Associated Data
This section collects any data citations, data availability statements, or supplementary materials included in this article.