

Abstract
Through linkage analysis and candidate gene sequencing, we identified three unrelated families with the autosomal-dominant inheritance of early onset anemia, hypouricosuric hyperuricemia, progressive kidney failure, and mutations resulting either in the deletion (p.Leu16del) or the amino acid exchange (p.Leu16Arg) of a single leucine residue in the signal sequence of renin. Both mutations decrease signal sequence hydrophobicity and are predicted by bioinformatic analyses to damage targeting and cotranslational translocation of preprorenin into the endoplasmic reticulum (ER). Transfection and in vitro studies confirmed that both mutations affect ER translocation and processing of nascent preprorenin, resulting either in reduced (p.Leu16del) or abolished (p.Leu16Arg) prorenin and renin biosynthesis and secretion. Expression of renin and other components of the renin-angiotensin system was decreased accordingly in kidney biopsy specimens from affected individuals. Cells stably expressing the p.Leu16del protein showed activated ER stress, unfolded protein response, and reduced growth rate. It is likely that expression of the mutant proteins has a dominant toxic effect gradually reducing the viability of renin-expressing cells. This alters the intrarenal renin-angiotensin system and the juxtaglomerular apparatus functionality and leads to nephron dropout and progressive kidney failure. Our findings provide insight into the functionality of renin-angiotensin system and stress the importance of renin analysis in families and individuals with early onset hyperuricemia, anemia, and progressive kidney failure.
Introduction
The physiologic importance of the renin-angiotensin system (RAS) has been well described in more than 25,000 medical publications, with substantial interest in the effect of angiotensin converting enzyme gene polymorphisms on renal function.1 Recessive mutations causing complete loss of renin synthesis resulting in renal tubular dysgenesis (RTD [MIM 267430]) have been described.2 With the exception of premature stop codon mutation leading to benign hyperproreninemia3 (REN [MIM 179820]), no other nonlethal mutations of the renin gene have been reported to date. Identification and characterization of such mutations may provide unique insight into the physiology of the RAS and its organ-specific functionality and regulation. The gene responsible for renin production is located on chromosome 1, and it is primarily expressed by granular cells in the juxtaglomerular apparatus of the kidney. The gene product preprorenin contains a signal sequence that directs ER targeting, glycosylation, and proteolytic processing of the nascent preproprotein, resulting in prorenin and renin production.4 A primary function of renin is the hydrolytic cleavage of angiotensinogen to angiotensin, with the subsequent stimulation of aldosterone production. The RAS has also been found to have widespread and diverse roles, including modulating vascular tone, renal sodium handling, erythropoiesis, thirst, cardiac hypertrophy, and functioning through local RAS systems in many organs.5
In this work, by using positional cloning, we identify two unrelated families with mutations resulting in the deletion (p.Leu16del) of a single leucine residue in the signal sequence of renin. On the other hand, renin mutation (p.Leu16Arg) in the third family was detected through a candidate gene approach based on the association of anemia and hyperkalemia with low-normal and orthostatism-unresponsive plasma renin concentration (PRC) and aldosterone levels in the proband.
Detailed clinical, biochemical, and immunohistochemical studies and molecular characterization of the identified mutations suggested that juxtaglomerular cells, sustaining the highest expression rate of the mutant protein expression, are likely exposed to chronic ER stress and unfolded protein response. This led to site-specific attenuation of renin biosynthesis, RAS dysregulation, and altered juxtaglomerular apparatus functionality that result in a newly described clinical syndrome characterized by early-onset anemia, hyperuricemia, and progressive kidney failure.
Material and Methods
Patients
Family A was ascertained at the Department of Nephrology at the University Hospital in Leuven and was described, labeled as BE1, in our previous studies.6,7 Families B and C were ascertained at the Section on Nephrology, Wake Forest University School of Medicine (Winston-Salem, NC) and Nephrology and Transplantation Unit, Henri Mondor Hospital (Creteil, France), respectively. Medical histories were obtained as a part of all the patients' clinical work-up by consultants of the above referred institutions. Investigations were approved by the participating center's Institutional Review Boards and were conducted according to the Declaration of Helsinki principles.
Genotyping, Linkage Analysis, and DNA Sequencing
Members of family A were genotyped with Affymetrix GeneChip Mapping 10K 2.0 Xba Arrays. Multipoint parametric linkage analysis, along with determination of the most likely haplotypes, was carried out under the assumption of a dominant mode of inheritance with a 0.99 constant, age-independent penetrance, 0.01 phenocopy rate, and 0.001 frequency of disease allele. Genomic fragments covering promoter region (about 500 bp upstream from most cDNA 5′ end) and all of the exons and exon-intron boundaries of selected candidate genes were PCR amplified from genomic DNA and sequenced in single proband and healthy individual from family A. The renin gene (REN) was analyzed in all three families as previously described.2,8 Segregation of REN mutations in the families and absence of the mutations in a control white population were assessed by combination of genotyping and direct sequencing of the corresponding genomic DNA fragment. Disease haplotypes in families A and B were assessed with a set of microsatellite markers flanking the REN region.
In Silico Analysis
Preprorenin signal sequences from the presented species were obtained from the UniProtKB/Swiss-Prot database. Multiple alignment and evaluation of the amino acids conservation were performed by ClustalW2 software (EMBL-EBI database). Properties of the signal sequences were assessed with the SignalP 3.0 server9 and the Kyte and Doolittle method.10
REN cDNA Expression Constructs
Wild-type REN mRNA was reverse transcribed from human total kidney RNA, PCR amplified, and cloned into pCR3.1 vector (Invitrogen, Paisley, UK). Constructs were introduced into the Escherichia coli TOP 10'F strain (Invitrogen, Paisley, UK) and the wild-type (WTREN) clones were selected by sequencing. Mutant construct c.45_47 delGCT (ΔL16REN) was prepared by subcloning of the corresponding DNA fragments into the WTREN/pCR3.1 construct. Mutant construct c.47T>G (L16RREN) was prepared by site-directed mutagenesis.
Transient Expression of REN
HEK293 cells were maintained in DMEM high-glucose medium supplemented with 10% (vol/vol) fetal calf serum (PAA), 100 U/ml penicillin G (Sigma, Prague, Czech Republic), and 100 μg/ml streptomycin sulfate (PAA Laboratories GmbH, Pashing, Austria). Transfections were carried out with Lipofectamine 2000 (Invitrogen, Paisley, UK) with either 1.5 μg or 4 μg DNA for 1.5 × 10⁵ or 8 × 10⁵ cells, respectively.
REN-Expressing Stable Cell Lines
HEK293 cells were maintained as described above and transfected at 85% confluence with Amaxa nucleofector system (Amaxa, Köln, Germany). Three days after nucleofection, cells were trypsinized, diluted, and cultured in selective medium containing 0.8 mg/ml G418 (Invitrogen-GIBCO, Paisley, UK). REN-expressing clones were selected with PCR, sequencing, and western blot analyses.
In Vitro Translation and Translocation
Wild-type (WTREN), c.45_47delGCT (ΔL16REN), and c.47T>G (L16RREN) encoding plasmid DNA were linearized, purified, and used for in vitro transcription with T7 polymerase as described before.11 In vitro translation was performed with rabbit reticulocyte lysate (Promega, Mannheim, Germany) and [35S] EasyTag EXPRESS Protein Labeling Mix (Perkin Elmer, Rodgau Jügesheim, Germany). Reactions were incubated at 30°C for 30 min in the absence or presence of 1 eq Micrococcus nuclease-treated rough microsomes (RMs) produced according to the protocol of Walter and Blobel.12 In vitro reactions were either directly precipitated or the membranes were separated by centrifugation through a sucrose cushion as described elsewhere.13 Translation products were separated in 10% SDS gels (T: 10%, C: 0.8% according to Lämmli) or in Tris/Bicine gels.14
Prorenin and Renin Analysis
Western Blot Analysis and Deglycosylation Studies
Cells were grown in standard, serum-supplemented medium. 24 hr before the analyses, the supplemented medium was replaced by serum-free medium. For secreted renin analysis, the medium was collected and centrifuged first at 800 × g/5 min and then at 15,000 × g/5 min for residual cells and cellular debris removal. Resulting supernatant was mixed with protease inhibitor cocktail (Sigma, Prague, Czech Republic) in ratio 100:1 (vol/vol). 500 μl of the medium was then concentrated on Microcon YM-10 filters (Millipore, Billerica, MA), and total protein was recovered and dissolved in SDS sample buffer. Harvested cells were resuspended in PBS containing protease inhibitor cocktail, sonicated 2 times for 30 s on ice, and centrifuged for 15,000 × g/5 min. Pellet was dissolved in SDS sample buffer. Denatured protein samples were separated on 13% SDS-PAGE, blotted onto PVDF membrane, probed with rabbit anti-preprorenin (recognizing amino acid residues 21–64) antibody (Yanaihara, Shizuoka, Japan), and detected with anti-rabbit IgG antibody conjugated to horseradish peroxidase (Pierce, Rockford, IL). Deglycosylation experiments were performed on protein extracts and cell lysates with the GlycoPro enzymatic deglycosylation kit (ProZyme Inc., San Leandro, CA). Deglycosylated products were analyzed by SDS-PAGE and western blot as described above.
Quantitative Renin Measurement
Cell lysate was prepared as described above. The medium was centrifuged at 15,000 × g for 5 min and resulting supernatant was mixed with protease inhibitor cocktail in ratio 100:1 (vol/vol). For renin amount, 50 μl of the medium and 5 μl of the lysate were diluted to final volume of 200 μl with PBS. For trypsin-activated total renin and prorenin amount, 5 μl of medium and 2.5 μl of lysate were incubated at 37°C for 30 min in a 50 μl PBS reactions containing 20 μg and 5 μg of trypsin, respectively. The reactions were stopped by 1 μl of 10 mg/mL trypsin inhibitor (PMSF, Roche, Prague, Czech Republic) and diluted to a final volume of 200 μl with PBS. 10 μl of the resulting mixtures were mixed with 190 μl of PBS and 100 μl of the anti-hRenin (I-125) reagent (Active Renin IRMA kit, DSL, Webster, TX), and the renin amount was measured according to manufacturer instructions.
Renin Secretion Measurement
Stably transfected HEK293 cells were cultured in 96-well plates in standard, serum-supplemented medium without phenol red. After 20 hr, the medium was replaced with medium containing renin substrate conjugated with 5-FAM and QXL520 (part of SensoLyte 520 Renin Assay Kit, AnaSpec, San Jose, CA). Fluorescent signal was monitored at 520 nm every 5 min for 8 hr at 37°C on Synergy 2 microplate reader (BioTek, Winooski, VT).
Immunofluorescence Analysis
Transfected HEK293 cells were grown on glass chamber slides (BD Falcon - 4Chamber Polystyrene Vessel Tissue Culture Treated Glass Slide). After 48 hr, the cells were washed with PBS, fixed with 100% ice-cold methanol, blocked with 5% FBS, and incubated with rabbit anti-preprorenin (288-317) antibodies. Organelle-specific primary antibodies and fluorescently labeled secondary antibodies were described previously.7 Nuclei were stained with 4′,6-diamidino-2-phenylindole (DAPI). Prepared slides were mounted in fluorescence mounting medium Immu-Mount (Shandon Lipshaw, Pittsburgh, PA) and analyzed by confocal microscopy.7
Growth Rate Analysis
Stably transfected HEK293 cells were seeded in a 6-well plate at 4 × 10⁵ cells per well and cultured in the selective, G418-containing medium. Cells were counted every 24 hr for 7 days via a standard Bürker cell counting chamber. The medium was changed at the third, fifth, and sixth days.
XBP1 Analysis
Total RNA was isolated from cells via TRIZOL (Invitrogen, Carlsbad, CA) and reverse transcribed with oligo-dT primer and SuperScript II (Invitrogen). XBP1 was PCR amplified from the corresponding cDNA with gene-specific primers.
Electron Microscopy
Pellets of stably transfected HEK293 cells were fixed with 3% glutaraldehyde in 0.1 M phosphate buffer for 30 min, postfixed with buffered 1% OsO4 for 2 hr, dehydrated, and embedded into Epon. Thin sections were double contrasted with uranyl acetate and lead nitrate. Grids were observed and photographs were obtained on JEOL 1200 electron microscope.
Immunohistochemistry Studies
Formaldehyde- or ethanol-fixed kidney samples from 5 controls and patients DII1, DIV3, and DIV7 were analyzed essentially as previously described.7 Selected antigens were investigated with the following primary antibodies: prorenin, rabbit anti-preprorenin (amino acid residues 21–64); prorenin + renin, rabbit anti-preprorenin (amino acid residues 288–317), both (Yanaihara, Shizuoka, Japan); active renin, mouse anti-renin (clone R3-36-16, gift from Novartis AG, Basel Switzerland); Pro/renin receptor, rabbit anti-/P/RR (gift from Genevieve Nguyen, Paris); angiotensinogen, mouse anti-angiotensinogen (US Biological, Swampscott, MA); angiotensin II, mouse anti-angiotensin II (Acris, Herford, Germany). Immunohistochemical detection of renin and in situ detection of renin mRNA in kidney biopsy from Family C patient CIII1 was performed as previously described.2
Results
Clinical and Biochemical Findings
In this work, we analyzed three families with the autosomal-dominant inheritance of chronic progressive kidney failure (Figure 1A). All three families were of European ancestry, by family report. In Family A, the youngest family member (DIV7) was studied at age of 4 years, at which time the patient was asymptomatic. The blood pressure was 92/50 mm Hg. Physical examination was unremarkable. Laboratory studies revealed a hemoglobin level of 9.5 g/dl (normal 11.5–13.5 g/dl), serum uric acid level of 6.0 mg/dl (normal 1.8–5.4 mg/dl), and an inulin clearance of 68 ml/min/1.73 m2. Renal ultrasound performed at 7 years revealed kidney sizes of 7.4 and 6.9 cm (normal 8.5–11.5 cm) with no evidence of cyst formation. Kidney biopsy revealed focal tubular atrophy and dystrophy, focal and segmental glomerular sclerosis, and interstitial fibrosis (Figures 2K and 2L). The patient was started on allopurinol and followed with annual laboratory studies. The serum potassium values ranged between 4.8 and 5.9 mEq/l with serum bicarbonate levels between 19.6 and 25 mEq/l. Plasma renin and aldosterone levels were low but not entirely suppressed. Very similar clinical presentation and biochemical data were observed in all affected individuals in the three families (Table 1). Hemoglobin values were consistently low in children with the disease, with hemoglobin measurement at age 1 year in BIV2 already low at 10.2 g/dl. However, affected adults in the 4th and 5th decades of life had normal hemoglobin values if renal failure was not severe. Individuals with anemia had low reticulocyte counts and normal mean corpuscular volume. B12 and folate levels were normal in those who were studied. Individuals had normal iron stores or remained anemic after iron was repleted. Bone marrow aspirate was normal in an anemic individual from Family A. Anemia responded well to erythropoietin. There was a tendency to hyperkalemia in some individuals, though this was a variable finding. Hyperuricemia was present in many but not all patients, and the fractional excretion of uric acid was low in all individuals studied. Uric acid excretion and proteinuria stayed quite constant over time. Renal disease was characterized by a bland urinalysis and absence of proteinuria. Reduced glomerular filtration was present from an early age and developed in all affected individuals. Kidney failure was slowly progressive with end-stage kidney disease developing at ages 50, 66, and 68 years in Family A, and at ages 43, 50, and 63 years in Family B.
Figure 1.
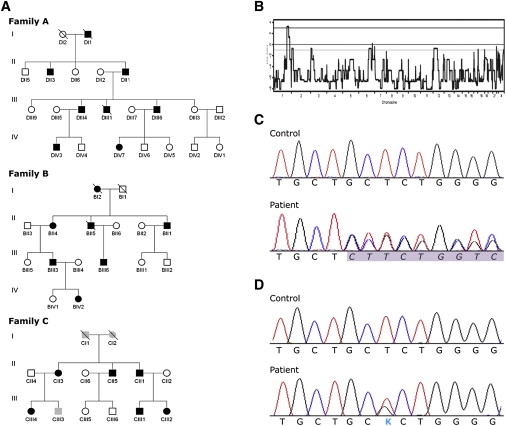
Pedigrees, Linkage and DNA Analysis
(A) Pedigrees of the investigated families. Black symbols denote affected individuals; open symbols denote unaffected individuals; and gray symbols denote individuals in whom clinical, biochemical, and genetic investigations were not yet performed.
(B) A whole-genome parametric linkage analysis showing a single statistically significant region on chromosome 1q41 detected in family A.
(C) Chromatograms showing genomic DNA sequence of the REN exon 1 in control and a heterozygous deletion c.45_47 delGCT in patient from family A.
(D) Chromatograms showing genomic DNA sequence of the REN exon 1 in control and a heterozygous mutation c.47T>G in patient from family C.
Figure 2.
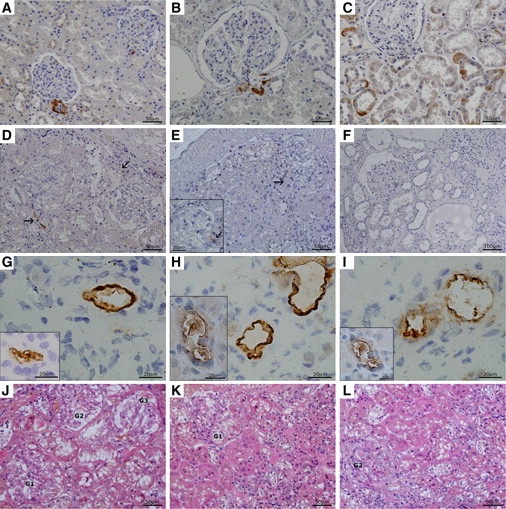
Renin Immunohistochemistry and Nephropathology
Family A, patients DIV3, DIV7, and DII1.
(A–C) Renin expression in control kidney.
(A) Control aged 7 years; renin expression in JG cells and individual cells of collecting ducts.
(B and C) Adult control; renin staining (B) in JG cells and (C) in renal cortical tubules where the signal is restricted to individual cells of the collecting ducts.
(D and E) Kidney biopsies in an early disease stage. Patient DIV3 (D) and patient DIV7 (E) shown. The common denominator is a strong reduction of renin signal in the JG apparatus (marked by arrows) and its absence in the surrounding tubules. Insert in (E) shows glomerulus in detail.
(F) Patient in advanced stage of kidney disease (DII1). Renin staining is absent in both JG apparatus and tubular epithelium even in relatively well-preserved regions.
(G–I) Renin and prorenin expression inside the wall of small size renal vessels, probably in a sub/endothelial localization, more prominent in adult patient DII1 (the main pictures) than in patients in an early stage of the disease (inserts). Preprorenin antibody detecting prorenin and renin (G), monoclonal antibody detecting active renin (H), and polyclonal antibody detecting prorenin (I). Insert in (G) demonstrates this phenomenon in patient DIV7, inserts in (H) and (I) in patient DIV3.
(J–L) Nephropathology in early stage of the disease (HE staining).
(J) Morphology in patient DIV3 was dominated by irregular dystrophic changes in tubular epithelium mainly in proximal tubules (coarsely vacuolated or granular cytoplasm) and focal segmental sclerosis of glomerular tufts with adhesions to Bowman's capsule. Tubular atrophy and interstitial fibrosis was less expressed (sampling?).
(K and L) Kidney biopsy from patient DIV7 demonstrated more pronounced glomerular sclerosis and hyalinosis (1 out of 8 glomeruli was totally sclerosed, not shown) and focal tubular atrophy accompanied with moderate interstitial fibrosis. Glomeruli, marked as Gs, in various degrees of sclerosis and areas of tubulointerstitial fibrosis are shown. In advanced stage of the disease (patient DII1, not shown), morphology of progressive nephropathy was modified by haemodialysis lasting for 1 year.
Table 1.
Representative Clinical and Biochemical Findings in Affected Family Members
| Patienta | Gender | Age at Clinical Measurement (y) unless Otherwise Noted | Blood Pressure (mm Hg) | Serum Creatinine (mg/dl) | GFRb | Serum Potassium (mEq/L)c | Serum Bicarbonate (mEq/L)d | Serum Uric Acid (mg/dl)e | Fractional Excretion Uratef | Hemoglobin (g/L)g | Random Plasma Renin Activity (ng/ml/h)h | Random serum Aldosterone (ng/dl)i | Renal Size Left, Right Kidney (Age of Measurement) |
|---|---|---|---|---|---|---|---|---|---|---|---|---|---|
| DIV7 | F | 4 | 92/50 | 0.8 | 68j | 4.6 | 21 | 6.0 | 0.01 | 9.5 | 7.4, 6.9 (7) | ||
| DIV7 | F | 16 | 115/56 | 1.5 | 66k | 5.2 | 22 | 4.4l | 0.05 | 12.9 | 0.5 | 25 | 8.2, 8.3 (16) |
| DIV3 | M | 8 | 102/50 | 0.9 | 68j | 4.5 | 21 | 7.3 | 0.04 | 10.2 | 8.7, 8.0 (10) | ||
| DIV3 | M | 20 | 120/70 | 1.8 | 72m | 4.2 | 24 | 5.7l | 0.04 | 10.9 | 2.2 | 15 | 9.9, 10.9 (19) |
| DIII4 | M | 43 | 3.0 | 24m | 4.6 | 22 | 4.1l | 11.5 | 1.6 | 18 | |||
| DIII6 | M | 47 | 120/85 | 2.5 | 38m | 4.9 | 23 | 3.8l | 0.05 | 13.1 | 0.6 | 23 | 10.7, 10.5 (47) |
| BIV2 | F | 8 | 100/62 | 0.6 | 95k | 4.6 | 24 | 5.1 | 0.03 | 10.1 | 1.7 | 2.8 | |
| BIII6 | M | 30 | 1.3 | 69m | 4.6 | 27 | 9.9 | 0.04 | 15.7 | ||||
| BIII3 | M | 32 | 106/63 | 1.6 | 54m | 4.3 | 29 | 6.5 | 0.03 | 13.1 | 2.6 | 6.0 | |
| BII4 | F | 59 | 1.8 | 31m | 4.7 | 20 | 10.8 | 0.4 | 6.4 | 10.3, 9.0 (58) | |||
| CIII2 | F | 12 | 100/50 | 1.3 | 63k | 6 | 23 | 8.0 | 9.9 | ||||
| CIII4 | F | 16 | 110/60 | 1.2 | 83k | 5.1 | 24 | 8.1l | 0.03 | 10.9 | |||
| CIII1 | M | 18 | 95/50 | 1.9 | 49m | 5.7 | 28 | 10.5 | 0.03 | 8.3n | 10.3 mU/Lo | 21 | 9.5, 10.0 (18) |
| CII5 | M | 42 | 135/70 | 1.6 | 51m | 5.4 | 28 | 8.1l | 13.0 | ||||
| CII3 | F | 45 | 125/80 | 1.1 | 57m | 4.1 | 25 | 6.3l | 13.0 | ||||
| CII1 | M | 48 | 120/70 | 1.5 | 53m | 4.0 | 29 | 8.3l | 15.3 |
See Figure 1 for pedigree.
GFR, glomerular filtration rate (ml/min/1.73 m2).
Serum potassium normal range 3.5–5.0 mEq/L.
Serum bicarbonate normal range 22–30 mEq/L.
Serum uric acid normal values:34 adults, 2.5–8.0 mg/dl; children <5 years, 1.8–5.3 mg/dl; children 5 to 10 years, 2.1–6.1 mg/dl; female 12–16 years, 2.7–6.3 mg/dl.
Fractional urate excretion normal values > 0.10 for children, > 0.05 for men, and > 0.06 for women.
Hemoglobin normal range 11.5–13.5 g/dl for female children, 11.5–15.5 g/dl for male children, 12–16 g/dl for female adult, and 14–18 g/dl for male adult.
Plasma renin activity normal range 0.5–5.9 ng/ml/hr.
Random serum aldosterone level normal range 3–28 ng/dL.
Determined by inulin clearance.
GFR determined by Schwartz Formula.36
Determined while on allopurinol.
Estimated by the Modification of Diet in Renal Disease Study equation.35
Measured at age 16 prior to erythropoietin therapy.
Active renin normal range 3.3–41 mU/L.
Genotyping, Linkage Analysis, and DNA Sequencing Revealed Mutations in the Signal Sequence of Preprorenin
To identify the genetic defect, we corroborated the results of the previous medium-dense scan in family A,6 performed a genome-wide linkage analysis, and identified a single genomic region with statistically significant LOD score of 3.24 on chromosome 1 (Figure 1B). By using haplotype analysis, we delimited the candidate region between the SNP_A-1517951 and SNP_A-1509750 markers. The critical region we have delimited (genomic position chr1:188,333,009-213,216,882) spans 25 million bases and contains about 300 genes. After the analysis of nine candidate genes reported in our previous study,6 we sequenced promoter and coding regions of six additional genes (ELF3 (ELF3 [MIM 602191]), ATF3 (ATF3 [MIM 603148]), KCNK2 (KCNK2 [MIM 603219]), KCTD3 (MIM n.a.); PTGS2 (PTGS2 [MIM 600262]), and REN (REN [MIM 179820]) and identified a heterozygous deletion c.45_47delGCT in exon 1 of the REN gene in the proband (Figure 1C). Genotyping showed that the identified deletion was present in all affected individuals, whereas healthy individuals from the family as well as 385 unrelated white controls had a normal genotype. Targeted REN sequencing among probands from other families investigated in the Czech laboratory7 and families followed by investigator A.J.B. revealed an additional family (Family B) having an identical mutation present on a distinct haplotype, indicating that the families are not related (Supplemental Data available online). Family C of Portuguese origin, with a missense mutation c.47T>G (Figure 1D), was revealed by M.M. and P.G. This mutation also segregated with the disease and was absent in 185 white controls and 50 controls from Portugal.
In Silico Analysis Suggested Altered Targeting Properties of Mutant Renin Signal Sequences
Human prorenin and renin are synthesized in juxtaglomerular (JG) cells from a 406-amino-acid-residues-long preproprotein composed of a 23-residues-long N-terminal signal sequence, 43-residues-long “pro” domain, and the mature renin comprising 340 residues.4 Mutation c.45_47delGCT causes a deletion, p.Leu16del (ΔL16REN), whereas mutation c.47T>G results in the amino acid exchange p.Leu16Arg (L16RREN) of a single leucine residue, L16, forming a hydrophobic penta-leucine motif of the preprorenin signal sequence mediating protein insertion in the ER membrane (Figure 3A). The hydrophobic region of the human preprorenin signal sequence is not entirely conserved among mammals. However, the penta-leucine motive is conserved within primates (Figure 3B). With the SignalP 3.0 server,9 we noticed that both mutations decrease the signal sequence prediction probability (D score value)15 and have no effect on the predicted signal peptide cleavage site (data not shown). Another calculation, the Kyte-Doolittle algorithm,10 showed a decrease in the hydrophobicity of the ΔL16REN and L16RREN signal sequences compared to that of the WTREN (Figure 3C).
Figure 3.
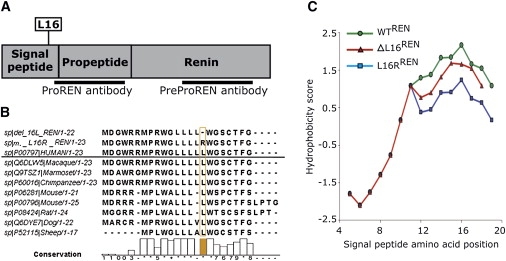
Bioinformatic Analysis of the Preprorenin
(A) Diagram of the preprorenin sequence showing the locations of the identified mutations and epitopes recognized by prorenin (amino acid residues 21–64) and preprorenin (amino acid residues 288–317) antibodies used in this study.
(B) Homology of the mutant and wild-type human preprorenin signal sequences with those of higher mammals.
(C) Hydrophobicity plot of the WTREN, ΔL16REN, and L16RREN signal sequences calculated via the Kyte and Doolittle method and scale.
Functional Studies Showed that Signal Sequence Mutations Affect Renin Biosynthesis
WTREN, ΔL16REN, and L16RREN proteins were transiently expressed in HEK293 cells and detected by western blot analysis (Figure 4A). WTRENand ΔL16REN were expressed as 47 kDa proteins whereas L16RREN was expressed as 45 kDa protein. Deglycosylation reduced molecular weight of the WTRENand ΔL16REN proteins to 43 kDa, which corresponds to complete loss of N-glycosylation on both of the predicted N-glycosylation sites in the preprorenin sequence (N71 and N141). Molecular weight of L16RREN remained unchanged. Analysis of molecular weights suggested that WTRENand ΔL16REN produce the signal sequence-cleaved, ER-translocated, and fully glycosylated prorenin whereas L16RREN produce nonglycosylated and therefore secretion-incompetent and enzymatically inactive preprorenin16 (Figure 4A).
Figure 4.
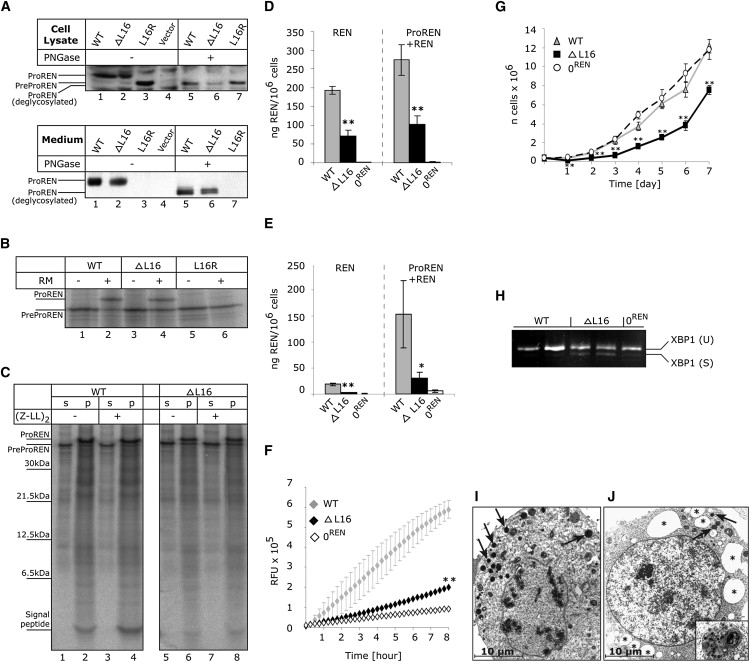
Functional Studies
(A) Western blot analysis of WTREN, ΔL16REN, and L16RREN proteins transiently expressed in HEK293 cells. Products of biosynthesis—preprorenin (PreProREN) and prorenin (ProREN)—were analyzed in cell lysates and cell culturing medium. To distinguish proteolytic processing and glycosylation status, the proteins were always analyzed before (−) and after (+) deglycosylation with PNGase.
(B and C) In vitro translation and translocation.
(B) Nascent WTREN, ΔL16REN, and L16RREN proteins translated from corresponding mRNAs in nuclease-treated rabbit reticulocyte lysate in the absence (−) or presence (+) of rough endoplasmic reticulum microsomes (RM). Without RM, only nascent preprorenin (PreProREN) is formed. With RM, the translocated preprorenin is converted into prorenin (ProREN). In comparing lane 2 to lane 4 (as well as lanes 2 and 4 to lanes 6 and 8 in C), one can see that significantly more WTREN is translocated into the RM and converted to prorenin than with the ΔL16REN mutant. The difference in translocation efficiency between WTREN and ΔL16REN was assessed by densitometry. The L16R mutation completely prevents translocation and L16RREN protein is present as preprorenin.
(C) Translation/translocation assay performed in the presence of RM and in the absence (−) or presence (+) of the signal peptide peptidase inhibitor (ZZ-L)2ketone. Upon centrifugation, prorenin as well as out cleaved signal peptide were present in RM pellet fractions (p), whereas preprorenin that does not translocate is found in supernatant (s). The inhibitor only slightly affected preprorenin signal peptide processing (lanes 4 and 8). Compared to ΔL16REN, the WTREN signal peptide is evidently more stable and only slightly affected by signal peptide peptidase-mediated processing.
(D and E) Prorenin and renin produced by stably transfected HEK293 cells. Active renin (REN) and trypsin activated total renin + prorenin (ProREN+REN) amounts measured in (D) lysates and (E) medium of the corresponding cell lines. The values represent means ± SD of the measurements performed in two independent clones for each of the constructs. The individual measurements were carried out in triplicate. The statistical significance of the differences between WTREN and ΔL16REN protein amounts was tested by t test. ∗p < 0.05; ∗∗p < 0.01; ∗∗∗p < 0.001. 0REN is an antibiotic-selected cell line originally transfected with WTREN construct, but showing later no renin expression by RT-PCR and western blot analysis.
(F) Renin secretion from living stably transfected HEK293 cell lines. The fluorescent signal is released from 5-FAM and QXL520 conjugated renin substrate and corresponds to the activity of renin secreted in the medium.
(G and H) Reduced growth rate (G) and activated XBP1 splicing (H) indicating ER stress in ΔL16REN-expressing cells.
(I and J) Electron microscopy of stably transfected HEK293 cell lines showing (I) overview of the WTREN -expressing cell with numerous electron-dense granules (arrows) and (J) considerable distensions of ER cisternae (asterisk) observed frequently in ΔL16REN cells. Detail of one of the autophagosomal structures is shown in the insert. These structures were not present in 0REN cells (data not shown).
Immunofluorescence and confocal microscopy of transfected cells demonstrated the expected localization of rennin-containing granules in the cytosol of the investigated cells. No visible differences in the amount, shape, and cellular localization of WTREN, ΔL16REN, and L16RREN granules were observed and/or detected by colocalization with ER marker (Supplemental Data).
In vitro translation/translocation assays confirmed that L16RREN is not translocated across the ER membrane and suggested a reduced translocation ability of ΔL16REN (Figures 4B and 4C). The latter was supported by densitometry analysis of the products obtained in three independent experiments which demonstrated that only 39% of the ΔL16REN precursor was processed to the 47 kDa form, compared to 75% of the WTREN. In addition, an analysis of the signal peptide processing (Figure 4C) showed that compared to ΔL16REN, the WTREN signal peptide is evidently more stable and only slightly affected by signal peptide peptidase-mediated processing.
To assess prorenin and renin amounts produced by ΔL16REN exactly, we prepared cell lines stably expressing WTREN and ΔL16REN and measured prorenin and renin production by quantitative radioimmunoassay. The analysis showed that ΔL16REN mutation significantly impaired prorenin and renin biosynthesis (Figure 4D), secretion (Figure 4E), and activity (Figure 4F). Cells expressing ΔL16REN also had a reduced growth rate (Figure 4G), activated endoplasmic reticulum stress, and unfolded protein response, demonstrated by the presence of spliced X-Box Protein 1 (XBP1) mRNA form17 (Figure 4H).
Ultrastructural analysis showed in the WTREN-expressing cells numerous electron-dense cytoplasmic vesicles compatible with those of previously reported secretory renin granules18 (Figure 4I), whereas there was a decreased number of cytoplasmic vesicles, considerable distension of rough endoplasmic reticulum cisteranae, and pronounced macroautophagy in ΔL16REN-expressing cells (Figure 4J).
Mutations Lead to Reduced Expression and Abnormal Localization of Prorenin and Renin and Altered Expression of RAS Components in Patient Kidney
Immunohistochemical staining with antibodies detecting prorenin (amino acids residues 21–64); preprorenin, prorenin, and renin (amino acids residues 288–317); and active renin (clone R3-36-16) was performed in kidney biopsies from three patients with p.Leu16del mutation. Compared to control tissues (Figures 2A–2C), staining for renin and prorenin was strongly decreased in juxtaglomerular granular cells and undetectable in tubular cells in the early disease stage (Figures 2D and 2E). In an advanced stage of the disease, the signal was absent in both the juxtaglomerular apparatus and the tubular epithelium (Figure 2F). However, in all three patients we observed an abnormal localization of both renin and prorenin inside the vessel wall of several arterioles and small arteries (Figures 2G–2I). Staining intensities of the other analyzed renal RAS components—angiotensinogen, angiotensin II, and pro/renin receptor—were decreased compared to controls. The decrease was proportional to the stage of the disease (Supplemental Data). No renin labeling was detected in the biopsy specimen from patient CIII1 with p.Leu16Arg mutation by immunohistochemical staining. According to in situ hybridization, renin mRNA was not detected in juxtaglomerular cells but it was strongly expressed in sparse cells regarded as pericytes, along peritubular capillary (not shown).
Discussion
We identified two mutations, a deletion and an amino acid exchange of a single leucine residue in the signal sequence of renin segregating with a phenotype of anemia, hypouricosuric hyperuricemia, and slowly progressive chronic kidney disease in three unrelated families.
Bioinformatic analysis showed that both mutations affect the signal sequence properties and function. Functional studies proved that L16RREN mutation prevents ER cotranslational translocation and processing, which are necessary for prorenin/renin secretion and activity.19 Instead, the nascent preproprotein is synthesized and accumulates in cytoplasm. In contrast, ΔL16REN mutation reduces translocation efficiency of the nascent protein into ER and decreases prorenin and renin biosynthesis and secretion. Interestingly, the ΔL16REN mutation evidently reduces signal peptide accumulation, which is suggestive that preprorenin-derived signal peptide may fulfill a post-targeting function within the ER membrane or in a different compartment as known for other signal peptides.20 Expression of the ΔL16REN protein also significantly affected cells growth, activated ER stress, and unfolded protein response.
Clinical studies correlated these findings: immunohistologic examination revealed a decrease in immunostaining for renin in affected children, with an even more marked decline with aging in juxtaglomerular cells and abnormal localization/induction of both renin and prorenin inside the vessel wall of arterioles, small arteries, and pericytes. Patients were able to sustain plasma renin concentrations, though low normal blood pressures in the setting of chronic kidney disease and mild hyperkalemia suggested, in agreement with immunohistochemistry analysis, a relative decrease in RAS activity.
Reduced fractional excretion of uric acid and resulting hyperuricemia are consistent with a model of increased proximal tubular reabsorption of uric acid resulting from mild volume depletion because of relative aldosterone deficiency. In contrast, if hyperuricemia was due to renal insufficiency, the fractional excretion of uric acid would have been elevated.21 Hyperuricemia resulting from increased proximal tubular reabsorption of uric acid has been seen in other genetic syndromes associated with salt wasting and mild volume depletion such as uromodulin-associated kidney disease.22
Anemia is also consistent with decreased RAS activity. Anemia has been noted in individuals receiving angiotensin converting enzyme inhibitors23 and diabetics with hyporeninemic hypoaldosteronism.24 The degree of anemia was out of proportion to the level of kidney failure; one individual with normal renal function at age 8 years suffered from persistent anemia since measurements performed at age 1 year. The patients in this study were able to reach target hemoglobin levels with use of erythropoietin. It is unclear why the hemoglobin values tended to be higher or normal in older individuals with the renin mutation, though the increase in testosterone secretion after adolescence may have been responsible in men.25
The ability of signal sequence mutations to activate ER stress, unfolded protein response, and pronounced autophagy has been noted with other signal sequence mutations.26–30 These events usually reduce the client protein expression rate, trigger apoptosis and inflammation, and lead to a reduced viability of secretory cells31 and disease development.32
In agreement with this model, we propose that the identified mutations in renin signal sequence likely expose juxtaglomerular cells, sustaining the highest expression rate of the mutant protein, to chronic ER stress and lead to site-specific attenuation of renin biosynthesis and RAS dysregulation. Reduced viability of juxtaglomerular cells and limited renin availability then affect renal development, intrarenal RAS homeostasis, and kidney autoregulation resulting in anemia, reduced glomerular filtration rate, and hyperuricemia. Over time, accelerated apoptosis in juxtaglomerular cells results, and, similar to mice with ablated juxtaglomerular cells,33 nephron loss and progressive kidney failure occurs. Proposed pathogenetic cascade correlates with the clinical picture of slowly advancing kidney failure, progressive tubulointerstitial nephropathy, secondary focal and segmental glomerular sclerosis, and nephron dropout demonstrated by nephropathologic examination.
From a clinical perspective, our findings stress the importance of renin analysis in families with early-onset hyperuricemia, anemia, and progressive kidney failure. We would be most interested in the referral of similar families for genotyping.
Supplemental Data
Supplemental Data include three figures showing haplotype analysis in families A and B, expression of renal RAS components in kidney biopsies, and cellular localization of the transiently expressed wild-type and mutant preprorenin, prorenin, and renin in HEK293 cells and can be found with this article online at http://www.ajhg.org/.
Supplemental Data
Web Resources
The URLs for data presented herein are as follows:
ClustalW2 software (EMBL-EBI database), http://www.ebi.ac.uk/Tools/clustalw2/
Online Mendelian Inheritance in Man (OMIM), http://www.ncbi.nlm.nih.gov/Omim/
SignalP 3.0 server, http://www.cbs.dtu.dk/services/SignalP/
UniProtKB/Swiss-Prot database, http://www.expasy.ch/sprot/
Acknowledgments
We thank Gert Matthijs, Elly Pijkels, Vicki Robins, Sharon Moe, Conceiçao Mota, and Fatima Torres for collection of biological materials and patient data, Olivier Gribouval for contribution to the genetic analysis, Maria Leidenberger and Klaus Meese for in vitro translation experiments, Zdena Vernerová for nephropathologic expertise, Novartis Pharma for R3-36-16 renin antibody, and Pierre Corvol and Genevieve Nguyen for pro/renin antibody. The authors report no conflict of interest. This work was supported by the Grant Agency of Charles University of Prague (projects 257672 and 257750). Institutional support was provided by the Ministry of Education of the Czech Republic (projects MSM0021620806 and 1M6837805002).
References
- 1.Wong C., Kanetsky P., Raj D. Genetic polymorphisms of the RAS-cytokine pathway and chronic kidney disease. Pediatr. Nephrol. 2008;23:1037–1051. doi: 10.1007/s00467-008-0816-z. [DOI] [PMC free article] [PubMed] [Google Scholar]
- 2.Gribouval O., Gonzales M., Neuhaus T., Aziza J., Bieth E., Laurent N., Bouton J.M., Feuillet F., Makni S., Ben Amar H. Mutations in genes in the renin-angiotensin system are associated with autosomal recessive renal tubular dysgenesis. Nat. Genet. 2005;37:964–968. doi: 10.1038/ng1623. [DOI] [PubMed] [Google Scholar]
- 3.Villard E., Lalau J.D., van Hooft I.S., Derkx F.H., Houot A.M., Pinet F., Corvol P., Soubrier F. A mutant renin gene in familial elevation of prorenin. J. Biol. Chem. 1994;269:30307–30312. [PubMed] [Google Scholar]
- 4.Imai T., Miyazaki H., Hirose S., Hori H., Hayashi T., Kageyama R., Ohkubo H., Nakanishi S., Murakami K. Cloning and sequence analysis of cDNA for human renin precursor. Proc. Natl. Acad. Sci. USA. 1983;80:7405–7409. doi: 10.1073/pnas.80.24.7405. [DOI] [PMC free article] [PubMed] [Google Scholar]
- 5.Paul M., Poyan Mehr A., Kreutz R. Physiology of local renin-angiotensin systems. Physiol. Rev. 2006;86:747–803. doi: 10.1152/physrev.00036.2005. [DOI] [PubMed] [Google Scholar]
- 6.Hodanova K., Majewski J., Kublova M., Vyletal P., Kalbacova M., Stiburkova B., Hulkova H., Chagnon Y.C., Lanouette C.M., Marinaki A. Mapping of a new candidate locus for uromodulin-associated kidney disease (UAKD) to chromosome 1q41. Kidney Int. 2005;68:1472–1482. doi: 10.1111/j.1523-1755.2005.00560.x. [DOI] [PubMed] [Google Scholar]
- 7.Vylet'al P., Kublova M., Kalbacova M., Hodanova K., Baresova V., Stiburkova B., Sikora J., Hulkova H., Zivny J., Majewski J. Alterations of uromodulin biology: A common denominator of the genetically heterogeneous FJHN/MCKD syndrome. Kidney Int. 2006;70:1155–1169. doi: 10.1038/sj.ki.5001728. [DOI] [PubMed] [Google Scholar]
- 8.Kmoch S., Hartmannova H., Stiburkova B., Krijt J., Zikanova M., Sebesta I. Human adenylosuccinate lyase (ADSL), cloning and characterization of full-length cDNA and its isoform, gene structure and molecular basis for ADSL deficiency in six patients. Hum. Mol. Genet. 2000;9:1501–1513. doi: 10.1093/hmg/9.10.1501. [DOI] [PubMed] [Google Scholar]
- 9.Bendtsen J.D., Nielsen H., von Heijne G., Brunak S. Improved prediction of signal peptides: SignalP 3.0. J. Mol. Biol. 2004;340:783–795. doi: 10.1016/j.jmb.2004.05.028. [DOI] [PubMed] [Google Scholar]
- 10.Kyte J., Doolittle R.F. A simple method for displaying the hydropathic character of a protein. J. Mol. Biol. 1982;157:105–132. doi: 10.1016/0022-2836(82)90515-0. [DOI] [PubMed] [Google Scholar]
- 11.Lyko F., Martoglio B., Jungnickel B., Rapoport T.A., Dobberstein B. Signal sequence processing in rough microsomes. J. Biol. Chem. 1995;270:19873–19878. doi: 10.1074/jbc.270.34.19873. [DOI] [PubMed] [Google Scholar]
- 12.Walter P., Blobel G. Preparation of microsomal membranes for cotranslational protein translocation. Methods Enzymol. 1983;96:84–93. doi: 10.1016/s0076-6879(83)96010-x. [DOI] [PubMed] [Google Scholar]
- 13.Dultz E., Hildenbeutel M., Martoglio B., Hochman J., Dobberstein B., Kapp K. The signal peptide of the mouse mammary tumor virus Rem protein is released from the endoplasmic reticulum membrane and accumulates in nucleoli. J. Biol. Chem. 2008;283:9966–9976. doi: 10.1074/jbc.M705712200. [DOI] [PubMed] [Google Scholar]
- 14.Wiltfang J., Arold N., Neuhoff V. A new multiphasic buffer system for sodium dodecyl sulfate-polyacrylamide gel electrophoresis of proteins and peptides with molecular masses 100,000–1000, and their detection with picomolar sensitivity. Electrophoresis. 1991;12:352–366. doi: 10.1002/elps.1150120507. [DOI] [PubMed] [Google Scholar]
- 15.Jarjanazi H., Savas S., Pabalan N., Dennis J.W., Ozcelik H. Biological implications of SNPs in signal peptide domains of human proteins. Proteins. 2008;70:394–403. doi: 10.1002/prot.21548. [DOI] [PubMed] [Google Scholar]
- 16.Rothwell V., Kosowski S., Hadjilambris O., Baska R., Norman J. Glycosylation of active human renin is necessary for secretion: effect of targeted modifications of Asn-5 and Asn-75. DNA Cell Biol. 1993;12:291–298. doi: 10.1089/dna.1993.12.291. [DOI] [PubMed] [Google Scholar]
- 17.Yoshida H., Matsui T., Yamamoto A., Okada T., Mori K. XBP1 mRNA is induced by ATF6 and spliced by IRE1 in response to ER stress to produce a highly active transcription factor. Cell. 2001;107:881–891. doi: 10.1016/s0092-8674(01)00611-0. [DOI] [PubMed] [Google Scholar]
- 18.Sagnella G.A., Peart W.S. Studies on the isolation and properties of renin granules from the rat kidney cortex. Biochem. J. 1979;182:301–309. doi: 10.1042/bj1820301. [DOI] [PMC free article] [PubMed] [Google Scholar]
- 19.Paul M., Nakamura N., Pratt R.E., Dzau V.J. Glycosylation influences intracellular transit time and secretion rate of human prorenin in transfected cells. J. Hypertens. Suppl. 1988;6:S487–S489. doi: 10.1097/00004872-198812040-00154. [DOI] [PubMed] [Google Scholar]
- 20.Hegde R.S., Bernstein H.D. The surprising complexity of signal sequences. Trends Biochem. Sci. 2006;31:563–571. doi: 10.1016/j.tibs.2006.08.004. [DOI] [PubMed] [Google Scholar]
- 21.Danovitch G.M. Uric acid transport in renal failure. A review. Nephron. 1972;9:291–299. doi: 10.1159/000180160. [DOI] [PubMed] [Google Scholar]
- 22.Hart T.C., Gorry M.C., Hart P.S., Woodard A.S., Shihabi Z., Sandhu J., Shirts B., Xu L., Zhu H., Barmada M.M. Mutations of the UMOD gene are responsible for medullary cystic kidney disease 2 and familial juvenile hyperuricaemic nephropathy. J. Med. Genet. 2002;39:882–892. doi: 10.1136/jmg.39.12.882. [DOI] [PMC free article] [PubMed] [Google Scholar]
- 23.Hubert C., Savary K., Gasc J.M., Corvol P. The hematopoietic system: A new niche for the renin-angiotensin system. Nat. Clin. Pract. Cardiovasc. Med. 2006;3:80–85. doi: 10.1038/ncpcardio0449. [DOI] [PubMed] [Google Scholar]
- 24.Donnelly S., Shah B.R. Erythropoietin deficiency in hyporeninemia. Am. J. Kidney Dis. 1999;33:947–953. doi: 10.1016/s0272-6386(99)70431-2. [DOI] [PubMed] [Google Scholar]
- 25.Yeap B.B., Beilin J., Shi Z., Knuiman M.W., Olynyk J.K., Bruce D.G., Milward E.A. Serum testosterone levels correlate with haemoglobin in middle-aged and older men. Intern. Med. J. 2008 doi: 10.1111/j.1445-5994.2008.01789.x. in press. Published online August 16, 2008. [DOI] [PubMed] [Google Scholar]
- 26.Ito M., Jameson J.L., Ito M. Molecular basis of autosomal dominant neurohypophyseal diabetes insipidus. Cellular toxicity caused by the accumulation of mutant vasopressin precursors within the endoplasmic reticulum. J. Clin. Invest. 1997;99:1897–1905. doi: 10.1172/JCI119357. [DOI] [PMC free article] [PubMed] [Google Scholar]
- 27.Bonapace G., Waheed A., Shah G.N., Sly W.S. Chemical chaperones protect from effects of apoptosis-inducing mutation in carbonic anhydrase IV identified in retinitis pigmentosa 17. Proc. Natl. Acad. Sci. USA. 2004;101:12300–12305. doi: 10.1073/pnas.0404764101. [DOI] [PMC free article] [PubMed] [Google Scholar]
- 28.Rebello G., Ramesar R., Vorster A., Roberts L., Ehrenreich L., Oppon E., Gama D., Bardien S., Greenberg J., Bonapace G. Apoptosis-inducing signal sequence mutation in carbonic anhydrase IV identified in patients with the RP17 form of retinitis pigmentosa. Proc. Natl. Acad. Sci. USA. 2004;101:6617–6622. doi: 10.1073/pnas.0401529101. [DOI] [PMC free article] [PubMed] [Google Scholar]
- 29.Datta R., Waheed A., Shah G.N., Sly W.S. Signal sequence mutation in autosomal dominant form of hypoparathyroidism induces apoptosis that is corrected by a chemical chaperone. Proc. Natl. Acad. Sci. USA. 2007;104:19989–19994. doi: 10.1073/pnas.0708725104. [DOI] [PMC free article] [PubMed] [Google Scholar]
- 30.Datta R., Waheed A., Bonapace G., Shah G.N., Sly W.S. Pathogenesis of retinitis pigmentosa associated with apoptosis-inducing mutations in carbonic anhydrase IV. Proc. Natl. Acad. Sci. USA. 2009;106:3437–3442. doi: 10.1073/pnas.0813178106. [DOI] [PMC free article] [PubMed] [Google Scholar]
- 31.Marciniak S.J., Ron D. Endoplasmic reticulum stress signaling in disease. Physiol. Rev. 2006;86:1133–1149. doi: 10.1152/physrev.00015.2006. [DOI] [PubMed] [Google Scholar]
- 32.Kaufman R.J. Orchestrating the unfolded protein response in health and disease. J. Clin. Invest. 2002;110:1389–1398. doi: 10.1172/JCI16886. [DOI] [PMC free article] [PubMed] [Google Scholar]
- 33.Pentz E.S., Moyano M.A., Thornhill B.A., Sequeira Lopez M.L., Gomez R.A. Ablation of renin-expressing juxtaglomerular cells results in a distinct kidney phenotype. Am. J. Physiol. Regul. Integr. Comp. Physiol. 2004;286:R474–R483. doi: 10.1152/ajpregu.00426.2003. [DOI] [PubMed] [Google Scholar]
- 34.Wilcox W.D. Abnormal serum uric acid levels in children. J. Pediatr. 1996;128:731–741. doi: 10.1016/s0022-3476(96)70322-0. [DOI] [PubMed] [Google Scholar]
- 35.Levey A.S., Bosch J.P., Lewis J.B., Greene T., Rogers N., Roth D. A more accurate method to estimate glomerular filtration rate from serum creatinine: a new prediction equation. Modification of Diet in Renal Disease Study Group. Ann. Intern. Med. 1999;130:461–470. doi: 10.7326/0003-4819-130-6-199903160-00002. [DOI] [PubMed] [Google Scholar]
- 36.Schwartz G.J., Haycock G.B., Edelmann C.M., Spitzer A. A simple estimate of glomerular filtration rate in children derived from body length and plasma creatinine. Pediatrics. 1976;58:259–263. [PubMed] [Google Scholar]
Associated Data
This section collects any data citations, data availability statements, or supplementary materials included in this article.