

Abstract
The gaze behavior of homonymous hemianopes differs from that of visually intact observers when performing simple laboratory tasks. To test whether such compensatory behavior is also evident during naturalistic tasks, we analyzed the gaze patterns of three long-standing hemianopes and four visually intact controls while they assembled wooden models. No significant differences in task performance, saccade dynamics or spatial distribution of gaze were observed. Hemianopes made more look-ahead fixations than controls and their gaze sequences were less predictable. Thus hemianopes displayed none of the compensatory gaze strategies seen in laboratory tasks. Instead, their gaze patterns suggest greater updating of, and greater reliance on a spatial representation.
Keywords: hemianopia, humans, eye movement, saccades, fixations, reaching
Homonymous hemianopia is characterized by the loss of conscious visual perception in roughly one half (left or right) of the visual field. In humans, it usually occurs as a result of unilateral stroke or other damaging insult to the visual thalamus, optic radiation or primary visual cortex (Zhang et al. 2006). Carefully controlled clinical and laboratory studies have indicated that hemianopes compensate for their loss of vision with gaze strategies that are both abnormal and biased toward the affected visual hemifield (Gassel and Williams 1963; Ishiai et al. 1987; Pambakian et al. 2000). For instance, when presented with point light targets at different, randomly chosen positions along the horizontal meridian of their field of view, hemianopes rarely fixated the targets directly (Meienberg et al. 1981). When target duration and position were predictable, they performed a series of hypometric saccades that incrementally approached each target until it was found. Once target positions had been learned, the saccades became hypermetric, overshooting the target by a few degrees of visual angle, followed by a short, corrective saccade. A similar pattern of hypometric saccades was noted when hemianopes searched static images for a small target (Zangemeister et al. 1995). Finally, when searching for a visual target among distracters, hemianopes exhibited longer total search times, shorter and more frequent fixations, and shorter saccades than visually-normal controls (Chedru et al. 1973). They also preferred to first explore the side of space associated with their seeing hemifield, before scanning the side corresponding to their visual deficit (Chedru et al. 1973).
Overall however, hemianopes spent most of their time looking toward their blind hemifield (Ishiai et al. 1987). This bias occurred in the absence of visual/attentional neglect (Ishiai et al. 1987) and has since been observed in numerous other tasks, including counting dots (Zihl 1995), viewing natural and degraded images (Pambakian et al. 2000) and detecting sudden-onset, moving targets in a three-dimensional, virtual environment (Riley et al. 2007). It has been suggested that the hemianopic bias toward the blind hemifield is a compensatory strategy that aims to partially overcome the loss of visual input from the affected side of space (Zihl 1995).
While carefully controlled laboratory studies are critical to understanding the mechanisms of deficit and compensation in visual disorders, the necessarily artificial nature of such studies may limit our ability to elicit the full range of visual behaviors normally exhibited in everyday life situations. Indeed, studies of visual behavior in naturalistic environments show that oculomotor behaviors observed during highly constrained tasks do not always generalize to everyday, visually-guided behavior (Hayhoe and Ballard 2005). In naturalistic tasks, gaze is used to gather information critical for the planning and execution of actions (Land et al. 1999; Pelz and Canosa 2001; Hayhoe et al. 2003; Land 2004; Hayhoe and Ballard 2005). When tasks are relatively simple, e.g. copying a simple pattern of blocks, a “just-in-time” gaze strategy seems to predominate in normally sighted individuals (Ballard et al. 1992; Ballard et al. 1995; Johannsen 2001). This suggests that participants encode only currently relevant information at each fixation, rather than relying on a more complete memory representation of the block model (Ballard et al. 1992; Ballard et al. 1995; Johannsen 2001). However, when the cost of making a saccade to acquire currently-relevant information is high, people shift their strategy and rely more on spatial memory (Hayhoe et al. 1993). As a result, in more complex naturalistic tasks, visually-intact subjects plan actions “ahead of” rather than “just in” time (Land and Furneaux 1997; Land et al. 1999; Pelz and Canosa 2001; Hayhoe et al. 2003; Aivar et al. 2005).
The present experiments assessed the visual behavior of subjects with long-standing homonymous hemianopia, while they assembled wooden models from a construction set on a table-top, as previously described by Mennie and colleagues (Mennie et al. 2007). Our paradigm is ideal to examine the degree to which participants who are missing conscious visual information from a significant proportion of their visual field rely on just-in time strategies or visuo-spatial memory in order to perform the task. Our testing paradigm is also ideal to determine whether the abnormal gaze strategies previously reported for hemianopes performing visual search tasks in highly constrained laboratory conditions, generalize when these subjects are actively performing a model-building task using real blocks on a real table-top.
Methods
Subjects
Four subjects with stroke-induced, homonymous visual field defects (Figure 1) and four visually intact control subjects were enrolled in this experiment as part of a broader study of visual functioning in hemianopes. Patient H1, an 84 years old male, had sustained an occipital stroke 24 months prior to the study. Patient H2, a 64 years old female, had sustained an occipital stroke 8 months prior to the time of testing. Patient H3, a 51 years old male, had suffered an occipital stroke 20 months prior to testing. Patient H4, a 50 years old female, had sustained an occipital stroke 40 months prior to testing. In each case, magnetic resonance imaging (MRI) revealed primary visual cortex to be extensively damaged (Figure 1). Both Humphrey and Goldmann visual field perimetry defined the patients' visual deficits as large, persistent and homonymous (Figure 1). Each hemianope had some degree of macular sparing, although the degree of sparing was highly variable. Each hemianope could reliably fixate during Humphrey perimetry. A complete neuro-ophthalmological exam was conducted for each hemianope to rule out neglect, as well as other motor, cognitive and sensory impairments that might interfere with task performance. As a result, H4 was excluded from the study because of impaired motor and sensory control in her right upper extremity that persisted after her stroke and physically prevented her from being able to assemble the wooden models. Subjective refraction performed by an ophthalmologist showed the three remaining hemianopes (H1-3) to possess normal, or corrected-to-normal vision (using spectacles) in their intact fields of view.
Figure 1.
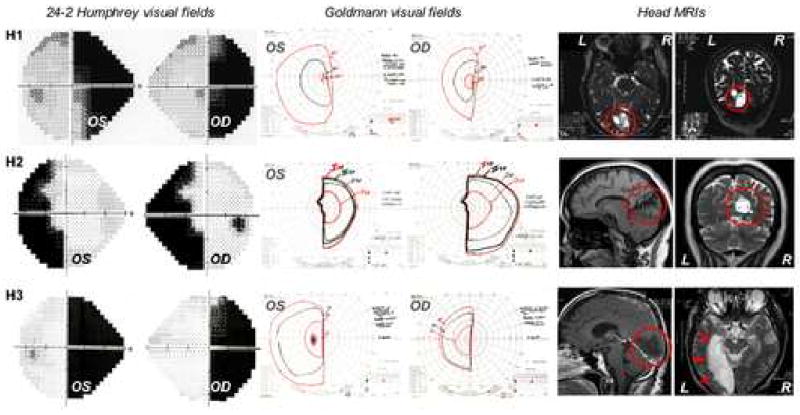
24-2 Humphrey visual fields, Goldmann perimetry and structural magnetic resonance images (MRIs) of the head of the three hemianopic subjects H1-3. Black areas on the Humphrey graphs indicate areas of blindness. The red circles and arrows in the MRIs indicate the sites of the brain damage, which caused the homonymous visual field defects. OS = data collected through left eye; OD = data collected through right eye; L = left hemisphere; R = right hemisphere.
The four visually intact subjects recruited (three males aged 50-55 years and one female, age 52 years) had no history of neurological disorders, exhibited normal or corrected-to-normal (using spectacles) visual acuity and served as controls with a full field of view.
The experimental procedures described below were approved by the University of Rochester Medical Center's Institutional Review Board, and conformed to the tenets of the Declaration of Helsinki. The procedures were explained to each participant, and informed consent was obtained in writing.
Behavioral Procedure
Participants were asked to build a standardized model while their eye movements were recorded. They were seated in front of a table measuring 120 cm × 60 cm (Figure 2). Ten black bins were affixed to the table in rows. Each bin measured 23cm (length) × 9cm (width) × 4cm (height). At the lower, right-hand corner of each bin, a small peg was located. Pegs next to bins 1, 2, 3 and 4 were labeled with the relevant bin numbers. Bins 1, 2, 3 and 4 contained slats from a wooden toy construction set (Baufix). Two bins were empty (empty distracter boxes – ED in Figure 2) and two bins contained items that were not to be used in constructing the models (full distracter boxes – FD in Figure 2). The small pegs at the lower, right-hand corner of bins containing distracters were labeled ‘X’. Finally, two bins were arranged next to each other near the bottom of the table - one contained wooden nuts and the other bolts from the Baufix set. Participants were instructed to take a first slat from bin 1, a second slat from bin 2, attach them with a nut and bolt in the workspace area of the table (see Figure 2), then take a slat from bin 3 and attach it to the first two with a new nut and bolt in the workspace area of the table, then take a slat from bin 4 and attach it to the model with a third nut and bolt in the workspace area of the table, and finally hand the finished model to the experimenter. The subjects were not pressured to perform the task rapidly and no specific instructions were given as to how to arrange the pieces. The only important rule was the order in which subjects were to pick up the slats – first from bin 1, then bin 2, then bin 3, then bin 4. Only trials in which subjects obeyed this rule correctly were analyzed for the purposes of this study.
Figure 2.
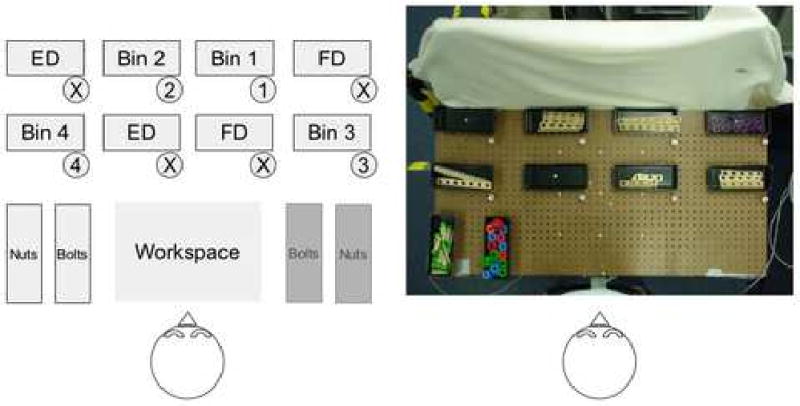
A) Schematic of the layout of the table. Participants were instructed to take slats from bins 1 and 2, join them with a bolt and nut, then join to them a slat from bin 3, and finally a slat from bin 4. ED = empty distracter bin. FD = full distracter bin. B) A photograph of a bird's-eye view of the table.
The side of the table containing the nuts and bolts bins was alternated between right and left with participants performing five consecutive trials (1 trial=1 model assembled) with the nuts/bolts on the right and five consecutive trials with the nuts/bolts on the left (Figure 2).
Eye tracking
Eye position was monitored monocularly (left eye) with an Applied Science Laboratories (ASL) 501 head-mounted, infrared eye tracker sampling at 60 Hz with a real time delay of 50 ms. The eye-in-head signal has an accuracy of approximately 1° of visual angle across the central 40° of the visual field. The eye tracker was calibrated for each participant prior to each condition. Eye position information was superimposed on a video of the scene captured by a head-mounted scene camera, recording at 30 Hz, and was analyzed as detailed below.
Data Analysis
Behavior
Two aspects of behavioral performance were examined. The first was the average time for each participant to complete a model across 10 successful trials (5 with the nuts/bolts on the right and 5 with the nuts/bolts on the left of the table). The second was the eye-hand latency (EHL), the time between the onset of the first guiding fixation and the initiation of the reach toward a target. Initiation of the reach was defined as the time of the first movement of the hand toward the target that was visible on the video record. Negative EHL indicates that the reach preceded the guiding fixation. These measures were analyzed using 2 (condition: nuts and bolts on right vs. left) × 2 (group: hemianopes vs. controls) mixed factorial ANOVAs.
Saccade and Fixation Dynamics
Fixations were defined as epochs of at least three consecutive frames (∼ 100 ms) with eye movements of less than 1° of visual angle per frame. This is equivalent to a velocity definition of less than 30°/s. Saccades were defined as epochs in which movement velocity exceeded a threshold of 30°/s. We then computed summary characteristics for each fixation and saccade. For each fixation, we computed the mean eye-in-head position and duration. For each saccade, we computed the main sequence parameters of amplitude, duration, mean velocity and peak velocity. These measures were analyzed at the experiment level with 2 (condition) × 2 (group) mixed factorial ANOVAs and at the individual level using independent-sample t-tests. For the purpose of these t-tests, the direction of the saccade (toward seeing or blind hemifield) was used as the independent variable. Fixation duration was also analyzed at an individual level for each hemianope, using eye orientation with respect to the vertical meridian to define groups of fixations. A post-hoc analysis was performed for fixation duration using direction of the subsequent saccade (toward the sighted or blind field) as the independent variable in individual-level t-tests for the hemianopes.
The existence of compensatory gaze strategies biased toward a particular visual hemifield was assessed in several ways. First, fixation locations were divided by the vertical meridian and the frequency of fixations directed to the left or right was compared with a binomial test against a test proportion of 0.5 (equal number on each side). If hemianopes used a strategy of several short saccades sweeping through the impaired hemifield to find target locations on that side, then we would expect smaller saccade amplitudes, on average, in the direction of the blind hemifield. Alternatively, the strategy of a hypermetric saccade followed by a corrective saccade implies longer saccades toward the affected hemifield and shorter saccades toward the seeing hemifield. The short-saccade strategy also implies a pattern in the sequence of saccade directions: compared to saccades in the direction of the seeing hemifield, saccades in the direction of the impaired hemifield should be followed more often by saccades in the same direction. Therefore, we categorized each saccade in terms of direction along the horizontal axis, and computed the sequential probability of a saccade in one direction, given the direction of the previous saccade.
The saccade main sequence variables were characterized with power function fits of the form Y = aXb, to describe peak velocity and duration as functions of saccade amplitude (Becker 1991). Function fitting was done with the Matlab curve fitting toolbox (Mathworks, Inc.).
Gaze Location
The location of gaze in the environment was characterized by analyzing each frame of the video record. The categories of possible locations used included each of the bins, the bin markers, the workspace, and all other locations. Gaze was defined as being directed at the workspace if participants were looking at the model they were building. If participants were not looking at the model, a bin, or a marker, then their gaze location was classified as “other”. Hence the “other” category included such things as locations on the table other than bins, locations around the table, and the experimenter. The resulting sequence of gaze locations was aligned to the eye movement data on a frame-by-frame basis and used to characterize the location of each fixation with respect to the environment.
Additionally, in order to obtain a rough distribution of gaze locations relative to items on the table during reaches, a representation of the table was placed on a transparency and this transparency was aligned to a video frame from a fixation. A point was placed on the transparency at the approximate point of each fixation that preceded a reach.
Classification of Fixations
From a comparison of gaze location and the timing of reaches, we were able to functionally define certain fixations. In particular, guiding fixations were defined as those fixations on a target of a reach that occurred immediately before or during the reach to that location. Look-ahead fixations (LAFs) were defined as fixations upon a location in the 10 seconds prior to a pickup from that location, with at least one fixation at a different location intervening prior to initiation of the reach (see Mennie et al., 2007 for identical definition). Similarly, look-back fixations (LBFs) were defined as fixations to a location within 10 seconds after a pickup from that location, with at least one fixation to a different location since the pickup.
Accuracy
Accuracy was difficult to assess in our paradigm, because the targets were not well-defined points in space and because head position relative to the targets (i.e. the slats and the bins that contained them) was not fixed. As a first pass, we mapped the location of fixations on the table for both hemianopes and controls. Second, we assessed the extent to which participants were able to efficiently find the target of an upcoming reach with their gaze. If participants used peripheral visual information to guide their gaze to the target of a subsequent reach, then we would expect a guiding fixation (the object fixation that guides the reach) to be immediately preceded by fixations in the workspace. Alternatively, if participants must search for the upcoming target, perhaps remembering only the general area where the target is located, then we would expect many guiding fixations to be preceded by fixations to other nearby locations. In particular, if hemianopes, who cannot use peripheral visual information to find targets in their blind hemifield, use a hypometric or hypermetric saccade strategy, then we would expect one or more intervening fixations to other locations between the workspace and guiding fixations. Thus, we calculated the proportion of guiding fixations that were preceded by fixations in the workspace.
Sequential Gaze Patterns
In order to characterize the sequential patterns of gaze allocation, lag 1 transition probability matrices were estimated for each participant and condition based on the sequence of gaze locations (Wickens 1982). An A-to-B transition probability is the probability that a system will be in state B at the current observation, given that it was in state A at some previous observation. The term “lag 1” refers to observations that are separated by a single step. In other words, the probability of being in state B, given that the system was in state A at the immediately previous observation, is the lag 1 A-to-B transition probability. The set of all possible transition probabilities at a given lag j can be represented as a matrix, the lag j state transition matrix. For the purposes of this exploratory analysis, we restricted ourselves to the first lag. Transition probabilities were computed with GSEQ (Bakeman and Quera 1995).
The sequential pattern of fixations was then characterized in two ways. First, traditional state transition diagrams were constructed from the transition probability matrices, collapsed across participants within group. The diagrams graphically illustrate transition probabilities by representing each possible state as a node, and transitions between states as directed edges (links) between nodes. To simplify the diagrams, we included only statistically significant transitions. For this analysis, repeated states (i.e. consecutive fixations on the same location) were collapsed into a single state, eliminating the possibility of auto-transitions (transitions from a state to itself) and simplifying our model. Pathfinder associative networks (pfnets - Dearholt and Schvaneveldt 1990) for each individual's transition matrices and across participants within conditions were then computed in order to condense the sequential information in the state transition diagrams and aid in its interpretation. For these analyses, the PC Knot software (Interlink) was used with default parameter settings q = n-1 and r = infinity, which provides a network with the minimal number of links (see below).
Results
Behavior
On average, hemianopes completed a single model in 69.6 ± 21.6 seconds, while control participants took 51.1 ± 3.7 seconds. A mixed factorial ANOVA with condition as a within-subject factor and group as a between-subject factor failed to reveal any significant main effects or interaction. A post-hoc correlation between participant age and time to complete a model indicated that the time taken to complete a single model was significantly related to age (r = 0.88, p = 0.009).
The mean eye-hand latency for hemianopes was 443 ± 149 ms and for controls, 235 ± 42 ms. A mixed factorial ANOVA again failed to reveal statistically significant differences between hemianopes or controls, or interactions with condition. However, the correlation between age and eye-hand latency was once again significant (r = 0.851, p = 0.015).
Hemianopes and controls followed a similar order of assembly subtasks: slat 1, slat 2, bolt, nut, slat 3, bolt, nut, slat 4, bolt, nut. Only H3 consistently deviated from this order by picking up nuts before bolts, holding the nut over the slat openings, and threading the bolt through the slats and nut.
Saccade and Fixation Dynamics
The average fixation and saccade parameters for the two groups studied are presented in Table 1. Hemianopes made slightly longer, larger saccades and exhibited shorter fixation durations than controls. However, none of these differences were statistically significant. Fixation durations at the individual level, assessed with independent-sample t-tests, did not differ significantly between the sighted and blind hemifields of each hemianope. This was true whether we used the vertical meridian of the eye-in-head as our reference or whether we restricted our definition to fixations that fell on the left or right half of the table (i.e. gaze in the direction of sighted or blind hemifield). To explore the possibility that fixation durations immediately preceding a saccade into the sighted or blind hemifields might reflect differences in planning those saccades, the direction of the subsequent saccade was used as an independent variable for t-tests at the single-subject level for each hemianope. None of the three tests were statistically significant.
Table 1.
Participant eye movement statistics
| Hemianopes (Mean ± SD) |
Controls (Mean ± SD) |
p* | |
|---|---|---|---|
| Saccade duration (ms) | 73 ± 1.5 | 69 ± 2.5 | 0.34 |
| Saccade amplitude (deg) | 9.32 ± 0.9 | 8.29 ± 0.5 | 0.33 |
| Saccade peak velocity (deg/s) | 163.2 ± 11.5 | 155.3 ± 9.9 | 0.63 |
| Fixation duration (ms) | 510 ± 151 | 561 ± 41 | 0.72 |
p-values refer to independent-sample t-tests of the difference between group means
The analysis of hemifield differences in hemianopic saccade parameters likewise did not reveal consistent differences in saccade amplitude, duration, mean velocity or peak velocity as a function of hemifield. Of the 12 independent sample t-tests performed (4 saccade parameters for 3 hemianopes), only one test was statistically significant: H1 had a greater saccade amplitudes when saccading in the direction of his blind hemifield, t(1027) = 2.20, p = 0.028. However, this difference is not significant if we define a family of tests as the four tests applied to an individual hemianope and apply a Bonferroni alpha correction (0.05/4 = 0.0125).
Finally, the lag 1 sequential analysis of saccade direction indicated that all participants, whether hemianopic or visually intact, had a greater probability of following a saccade in one direction with a saccade in the other direction (Figure 3). Rightward saccades were more likely to be followed by leftward saccades, and vice versa. This tendency was statistically significant for one hemianope and two controls. Hence there is no evidence of a consistent strategy by hemianopes to use a series of short saccades in the direction of their blind hemifield until a target is located. On the other hand, while the hypermetric saccade strategy is consistent with the obtained pattern of a saccade in one direction followed by a saccade in the other direction, this pattern is not unique to the hypermetric saccade strategy, and so is not informative with regard to that strategy.
Figure 3.
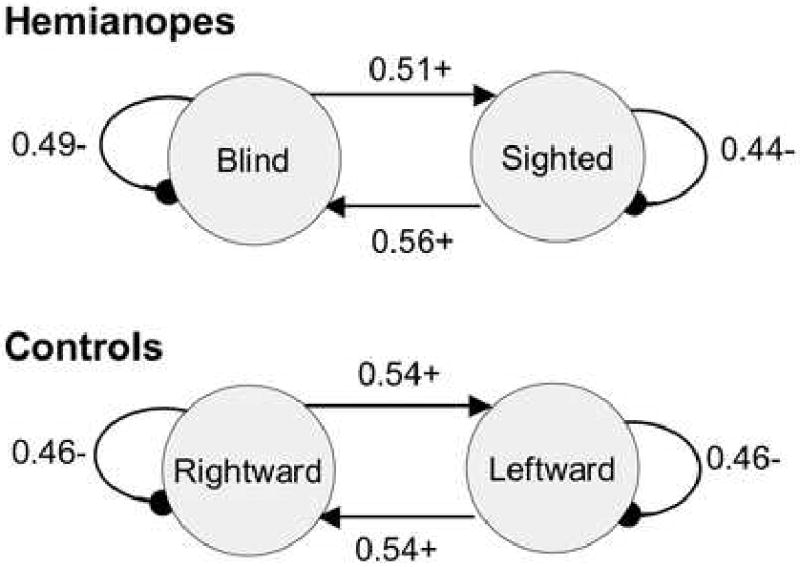
State transition diagrams of saccade direction sequential probabilities, collapsed across subjects within groups. For hemianopes, averages were taken with respect to the blind field rather than right vs. left. A “+” indicates that the transition was more probable that chance, while a “-” indicates that the transition was less probable than chance. A saccade strategy of several hypometric saccades followed by a hypermetric saccade should lead to a higher probability of autotransitions (i.e., a saccade in one direction should be followed by a saccade in the same direction with a high probability). Instead, saccades in one direction are more likely to be followed by saccades in the opposite direction. Each individual subject showed the same pattern, although the transition probability matrix was statistically different from chance in only one hemianope and two controls.
Main sequence functions for each participant revealed that hemianopes fell well within the range of the control participants (Figure 4) and the goodness of fit (adjusted R2) of the models was not different for hemianopes and controls. For peak velocity as a function of amplitude, goodness of fit ranged between 0.54-0.72 for hemianopes and 0.64-0.78 for controls. For duration as a function of amplitude, the goodness of fit ranged between 0.29-0.52 for hemianopes and 0.25-0.38 for controls. The obtained parameters are similar to other published reports. For example, (Lebedev et al. 1996) obtained an estimated slope of 0.02 and exponent of 0.43 for the amplitude-duration relationship over the range 1.5-20 degrees of amplitude, while we find an average value for our participants of 0.03 and 0.42 for slope and exponent, respectively. For the amplitude-peak velocity relationship, Lebedev et al. estimated the slope at 87 and exponent at 0.56, while we find a shallower slope of 30.9 and somewhat higher exponent of 0.77.
Figure 4.
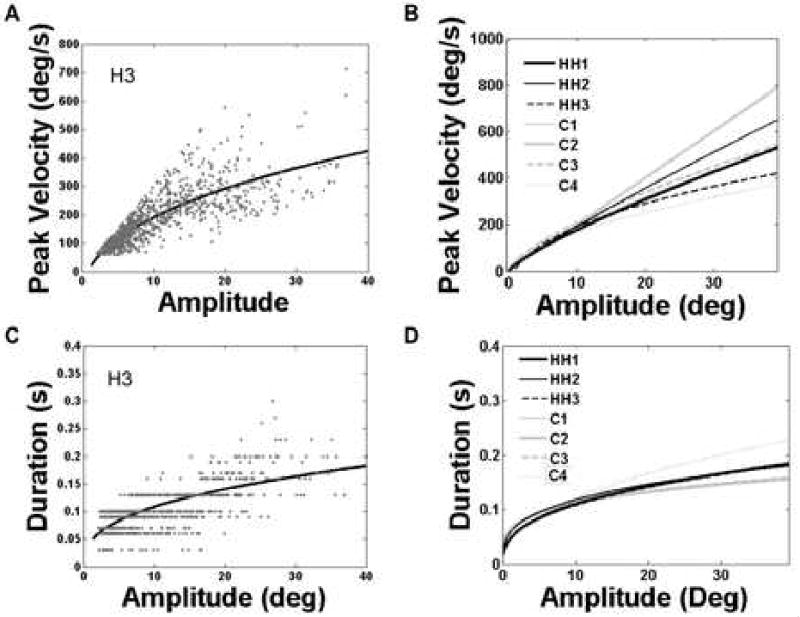
Saccade main sequence data. Fits are based on eye-in-head coordinates. A) Scatter plot of saccade peak velocity-amplitude pairs for a typical hemianopic participant (H1), and the best fitting power function showing the typical curvilinear relationship. B) Power function fits for the peak velocity-amplitude relationship for each participant. Black lines show fits to data from the three hemianopes, while gray indicates lines fit to the control data. The hemianopes clearly fall within the range of control functions, indicating that neither the slope nor exponent parameters were abnormal. C) Scatter plot of the duration-amplitude pairs for H1, and the resulting best-fitting power function. D) Power function fits for the duration-amplitude relationship for each participant. Functions for hemianopes are represented by black lines, those for controls are in gray. Again we see that the hemianopes were well within the range of control participants.
An analysis for each individual hemianope, separating saccades by direction toward the seeing versus blind hemifields (see Table 2 for summary of slope and exponent parameters) also failed to uncover a systematic difference in parameter values of the fitted models as a function of hemifield.
Table 2.
Comparison of main sequence parameters by hemifield
| Peak Velocity vs Amplitude | Duration vs Amplitude | |||||
|---|---|---|---|---|---|---|
| Slope(a) | Exponent(b) | adj.R2 | Slope(a) | Exponent(b) | adj.R2 | |
| H1 Sighted Field | 24.98 | 0.85 | 0.48 | 0.02 | 0.53 | 0.28 |
| H1 Blind Field | 29.8 | 0.77 | 0.55 | 0.02 | 0.52 | 0.30 |
| H2 Sighted Field | 21.85 | 0.94 | 0.75 | 0.04 | 0.40 | 0.28 |
| H2 Blind Field | 28.21 | 0.83 | 0.72 | 0.03 | 0.48 | 0.36 |
| H3 Sighted Field | 44.30 | 0.63 | 0.69 | 0.02 | 0.51 | 0.45 |
| H3 Blind Field | 42.68 | 0.64 | 0.64 | 0.02 | 0.62 | 0.51 |
Power functions of the form Peak = a* Amplitudeb and Duration = a*Amplitudeb were fit to the
Fixation Distribution and Duration
While hemianopes appeared to fixate slightly more frequently than controls at each location class (relevant boxes, relevant markers, distracters, workspace and “other”), t-tests indicated that this tendency was statistically significant only for distracter locations, t(5) = 2.99, p = 0.031 (Figure 5A). When fixation frequency was computed as a proportion of total fixations (frequency to location/total number of fixations), there was, once again, a statistically significant difference between hemianopes and controls in the proportion of fixations directed to distracter locations, t(5) = 3.37, p = 0.02 (Figure 5B). However, there were no significant differences between hemianopes and controls in the average time spent fixating at various locations (Figure 5C).
Figure 5.
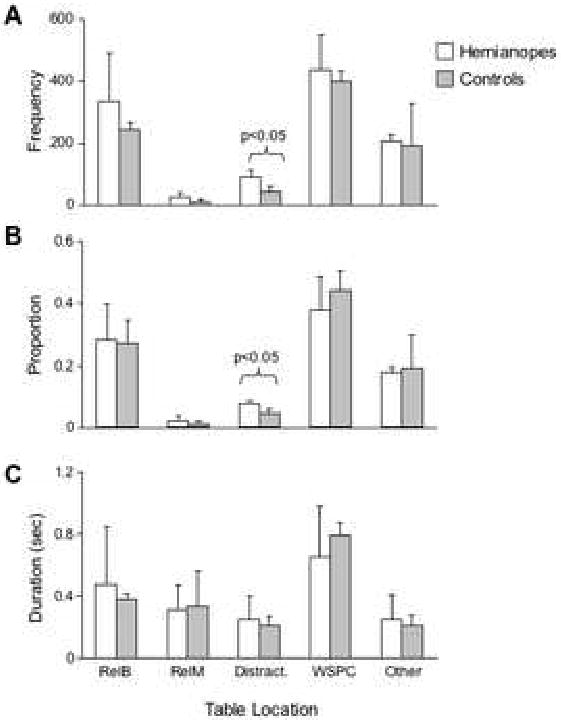
Group means for gaze location statistics, divided by location. Error bars represent two standard errors of the estimate. RB = relevant bin, RM = relevant marker, Dis = distracter, WSPC = workspace, Other = all other possible locations (other parts of the table or laboratory). A) The frequency of fixations to each location, averaged across participants within groups. The hemianopes fixated more frequently on distracter bins. B) The proportion of total fixations at each location, averaged across participants within groups. The hemianopes allocated a greater proportion of their fixations to distracter bins. C) Mean duration of fixations to each location, averaged across participants within groups.
A hemifield comparison within hemianopes yielded inconsistent results. H1 had a higher frequency of fixations in his left (seeing) visual field (proportions of 0.68 vs. 0.32, binomial test p<0.0005), and his fixations had a longer duration in his right (blind) hemifield, t(1026) = 4.84, p<0.0005. H2 did not have a significantly different frequency of fixating in one hemifield, with proportions of 0.52 on the left (blind field) and 0.48 on the right, nor was the duration of fixations different in one field or another, t(1260) = 0.55, p = 0.58. H3 had a significantly higher proportion of fixations in his right (blind) field (proportions of 0.29 vs. 0.71, binomial test p<0.0005), and the average duration of fixations in the right (blind) field were longer than the left, t(999) = 4.26, p<0.0005.
Accuracy of Fixations
Indirect measures of accuracy of fixations did not reveal any significant differences between hemianopes and controls. The guiding fixations of hemianopes landed around the target of a pick-up with a spread of distributions that was not significantly greater, even for the side of the table that fell in their blind hemifield, than the spread of guiding fixations made by controls (Figure 6). In addition, hemianopes fixated the target of a reach without any intervening fixations on other locations on 27 ± 6.8% of reaches, while controls did so 35 ± 13.3% of the time. An independent sample t-test indicated that this difference was not statistically significant. To assess performance with regard to hemifields in hemianopes, we divided guiding fixations into two groups -those preceded by a saccade into the sighted hemifield and those preceded by a saccade into the blind hemifield. Of those fixations preceded by movement toward the sighted field, 32.6% came directly from the workspace, while fixations preceded by movement toward the blind field came directly from the workspace 23.6% of the time. This frequency difference between sighted and blind hemifields was not significant for any hemianope.
Figure 6.
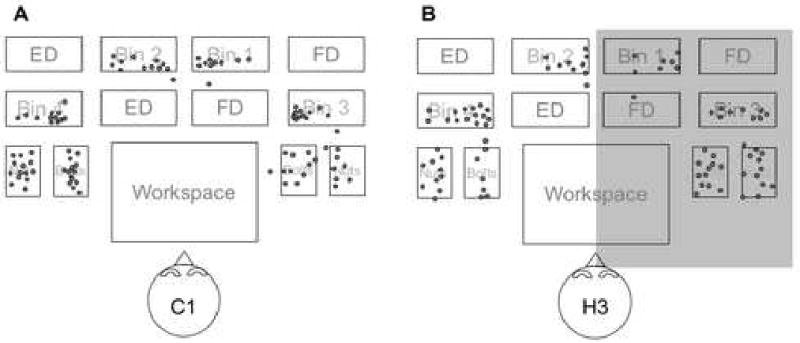
Approximate locations of fixations relative to the table for two typical participants. A) Control participant C1. B) Hemianope H3. The shaded region indicates the side of the blind hemifield. Controls and hemianopes were qualitatively similar in both the accuracy and dispersion of their gaze, and hemianopes demonstrated no consistent bias in their gaze locations. For example, the apparent rightward bias toward Bins 1 and 2 in H3 was not present in the other right-field hemianope.
Look-ahead and Look-back Fixations
LAFs preceded reaches by 5.07 ± 2.43 seconds for hemianopes and by 3.84 ± 0.55 seconds for controls. This difference was not statistically significant. Hemianopes exhibited a significantly higher proportion of LAFs than controls - a 2 (group) × 2 (condition) mixed factorial ANOVA indicated that that there was a main effect of group, F(1,5) = 7.50, p = 0.041 (Figure 7A). However, Figure 7B indicates that the greater frequency of LAFs for hemianopes was confined largely to Bin 4 and the Bins containing the nuts and bolts. Independent sample t-tests indicate significant differences only for bin 4 (t(5) = 3.23, p = 0.023) and the bolts (t(5) = 7.10, p = 0.001).
Figure 7.
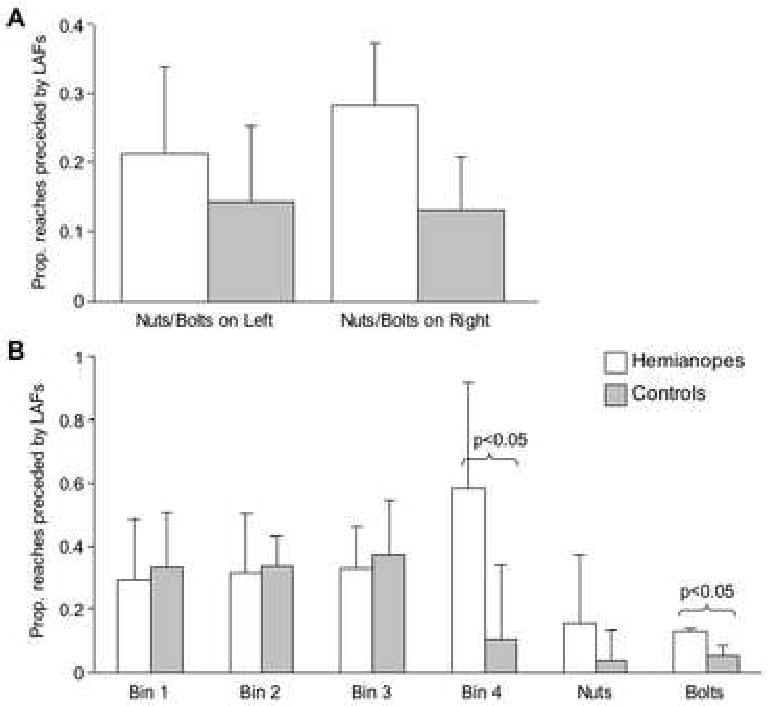
Average proportion of reaches preceded by a look-ahead fixation (LAF) in the 10 seconds prior to the reach, as a function of group and condition. Condition refers to whether the bins containing nuts and bolts were on the left or right. Error bars represent two standard errors of the estimate.
The average eye-hand latency for hemianopes was 415 ms (SE = 79 ms). For controls, the mean eye-hand latency was 249 ms (SE = 68 ms). A 2(group) × 2 (reach preceded by LAF vs. reach not preceded by LAF) mixed factorial ANOVA indicated no consistent effect of LAFs on eye-hand latency, no main effect of group and no interaction.
Look-back fixations were very rare. Hemianopes had an average of 5.0 ± 4.0, while controls had an average of 1.5 ± 1.73. Since the difference between the two groups was not statistically different, and since the frequency of this behavior was so rare, we did not analyze look-back fixations further.
Sequential Gaze Patterns
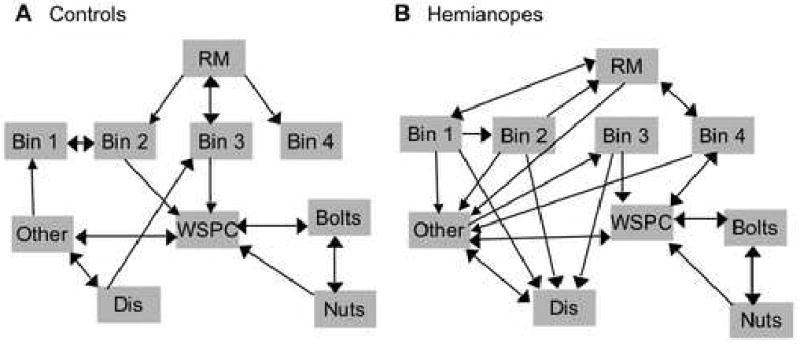
State transition diagrams showed hemianopes to have less predictable gaze patterns than controls (Figure 8). Control participants had 24 transitions that were more probable than chance (positive transitions), and 27 that were less probable than chance (negative transitions). In contrast, the hemianopes had 19 transitions more probable than chance, and 20 that were less probable than chance.
Figure 8.
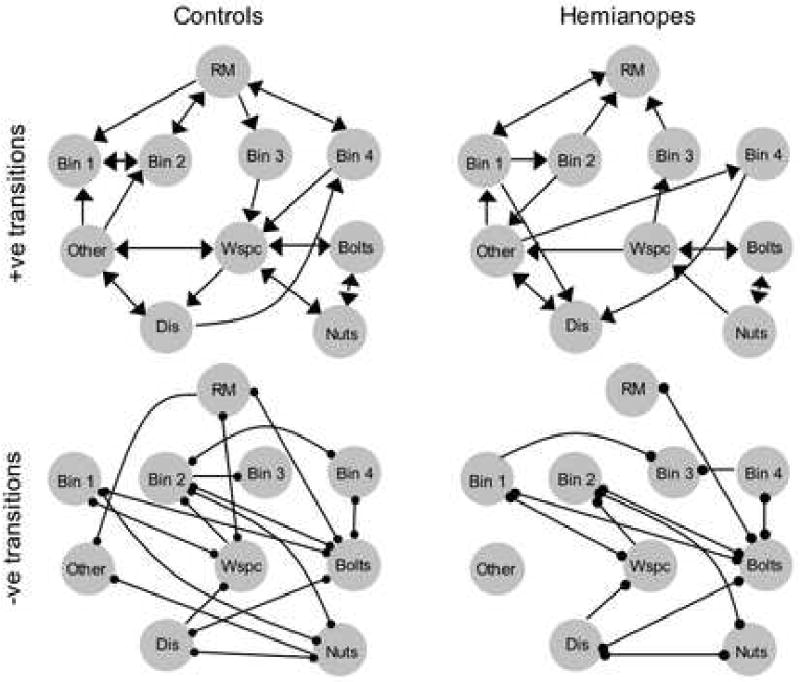
State transition diagrams, collapsed across subjects within groups. For the hemianopes averaging was done without regard to side of deficit. Arrows indicate transitions that are more probable than chance, dots indicate transitions that are less probable than chance. A) Control participants had 24 transitions that were more probable than chance. B) Hemianopes had 19 transitions that were more probable than chance. C) Control participants had 27 transitions that were less probable than chance. D) Hemianopes had 20 transitions that were less probable than chance. RM = relevant marker, WSPS = workspace, Dis = distracter.
Pfnets of gaze location for hemianopes and controls, averaged across participants, showed 27 links in the hemianopic network and only 20 links in the control network (Figure 9). Both control and hemianopic Pfnets displayed an association between the workspace, the nut bin and the bolt bin. This reflects the sequence of obtaining these items between each slat pickup, in order to join the latest slat to the model. The workspace was a central node for both groups, with gaze usually directed from this region to other locations, and back again. However, for hemianopes, the categories “other” and “distracter” were more highly interconnected nodes than for controls. The direction of these connections indicates that in hemianopes, gaze often stopped at some intermediate location when returning from a bin or emerging from the workspace.
Figure 9.
Pathfinder associative network representations of the lag 1 transition probability matrices. A) Control participants have a sparse network compared to the hemianopes, indicating that their gaze was more predictable. B) Hemianopes frequently had an intermediate fixation to some “other” location when returning their gaze to the workspace after a pickup. They also often transitioned their gaze from bins to markers and from relevant bins to distracter bins. RM = relevant marker, WSPS = workspace, Dis = distracter.
Discussion
The purpose of the present experiment was to assess the extent to which compensatory gaze strategies exhibited when hemianopes perform visual search tasks in simplified experimental conditions generalize to the performance of naturalistic tasks. In addition, we wished to explore the issue of how gaze patterns identified in naturalistic tasks were affected by hemianopia. There was little evidence of a compensatory gaze bias for hemianopes performing the present task, nor did these participants implement consistent hypometric or hypermetric saccade strategies. Instead, hemianopes used anticipatory fixations to a greater extent than controls and they proved less predictable than controls in terms of the sequential pattern of their gaze allocation as they completed the task.
In many respects, hemianopes were remarkably similar to our visually intact control participants when performing the Baufix model-building task. Although on average, they took slightly longer than controls to complete each model, this difference was not significant and was largely accounted for by age differences. Likewise, the latency between fixating the target of a reach and initiating the reach was 200 ms greater in hemianopes, but this difference was not statistically significant and again, was largely accounted for by age differences. Finally, hemianopes and controls performed different aspects of the task sequentially and in the same order, with the exception of one hemianope (H3) who reversed the typical order of picking up and using bolts and nuts.
There were also few differences between the seeing and blind hemifields of hemianopes. If hemianopes compensated for their visual loss with a gaze bias in the direction of their blind field, we would expect a greater frequency of fixations in the blind field (Zihl 1995) and longer fixations in this field (Ishiai et al. 1987). Such a pattern was observed in the hemianopic participants of the current experiment, when their task was to detect moving targets in a virtual environment (Riley et al. 2007). In that experiment, these participants fixated more frequently in the direction of their blind field than their sighted field in the interval between targets. However, in the current experiment, the same participants displayed no consistent bias toward the blind hemifield in terms of fixation frequency or duration.
The hypometric saccade pattern described by Meienberg and colleagues (Meienberg et al. 1981) implies that a saccade toward the blind field will be more likely to be followed by another saccade toward the blind field. This was not observed in the present study, as saccades in any direction were more likely to be followed by saccades in the opposite direction. On the other hand, the hypermetric/corrective saccade pattern described by Meienberg, Zangemeister and colleagues (Meienberg et al. 1981; Zangemeister et al. 1995) would cause saccades toward the blind field to be of greater amplitude than saccades toward the seeing hemifield, where peripheral vision can guide fixations accurately to a target location. This pattern was present in only one out of the three hemianopes (H1).
Saccade dynamics were not significantly different in hemianopes and controls, within the spatial and temporal resolution of the ASL eye tracker. The saccade main sequence, which refers to the relationship between saccade amplitude, duration, peak velocity and mean velocity (Bahill et al. 1975), has been used to augment the detection and characterization of a number of neurological disorders (Leigh and Kennard 2004). While one might expect that saccade dynamics should differ between the seeing and blind hemifields of hemianopes, Zangemeister and colleagues found no abnormalities in hemianopes performing a visual search task (Zangemeister et al. 1995). The main sequence parameters of our hemianopic participants were also within normal limits, replicating the findings of Zangemeister et al. (1995) and extending them to a naturalistic task with a greater range of observed saccade metrics. Lastly, a comparison of main sequences between the intact and impaired hemifields of our three hemianopes revealed that saccades toward the blind hemifields, which must be memory-guided, were quite similar to saccades made in the direction of the seeing hemifields, where peripheral information could guide saccade targeting.
Each of the hemianopic participants had some degree of foveal sparing, which might play a role in eye movement strategies. While we cannot rule out the contribution of sparing to performance on our task, such a contribution is likely to be minimal. The mean saccade amplitude for hemianopes was over nine degrees of visual angle, well over the extent of sparing indicated by perimetry. Consequently, such saccades into the blind field are unlikely to be under the direction of immediate visual input.
Much of the similarity between hemianopes and controls may be a product of the particular naturalistic task used here. Gaze control is influenced both by the visual scene and by current tasks and goals (Henderson 2003; Hayhoe and Ballard 2005). For example, when observers are asked to scan a scene in order to memorize its contents they have good memory for the scene but do not necessarily use that memory to guide their saccades (Melcher and Kowler 2001). In contrast, numerous experiments have shown that memory can be used to guide saccades when necessary (Aivar et al. 2005). In our task, the layout of the table was static from trial to trial (aside from the single change in the side of nuts and bolts after 5 trials). This situation afforded an opportunity for greater reliance on visuo-spatial memory than tasks involving a dynamic scene or a series of static scenes that disappeared after a few seconds. Nevertheless, the present task did capture important aspects of many everyday tasks, such as cooking, where changes in the spatial layout of constituent parts is largely under the control of the person doing the cooking. Our results suggest that in such situations, hemianopes may be able to compensate quite effectively for their visual loss, perhaps by placing a greater reliance on visuo-spatial memory, while displaying near-normal gaze behavior. Several observations from the present study support such a hypothesis. Hemianopes appeared to localize targets accurately (Fig. 6), and showed no evidence of either systematically undershooting or overshooting (Fig. 3). They fixated the reach target with a single saccade as often as controls. Because saccades into the blind field must be based on spatial memory, this indicates that essentially normal accuracy is possible on the basis of spatial memory. In addition, hemianopes exhibited a significantly higher frequency of LAFs than controls while assembling Baufix models. LAFs have been implicated in short-term task planning (Pelz & Canoza, 2001; Mennie et al. 2007). In the context of the present task, we propose that the increased frequency of LAFs in hemianopes reflects increased updating of spatial information in visual working memory.
Naturalistic tasks typically include a strong sequential component to behavior. For example, making a peanut butter and jelly sandwich involves taking bread out of a wrapper, opening a jar of peanut butter, picking up a knife, extracting the peanut butter from the jar, and so on. While there is some flexibility in the ordering of subtasks, this is limited by functionality. For instance, one would not spread peanut butter before taking a slice of bread from the wrapper. The sequential nature of many naturalistic tasks, combined with the tight coupling of gaze and current task demands, implies that useful information about strategic eye movement control may be present in the sequential pattern of gaze allocation (Hacisalihzade et al. 1992). In order to explore this aspect of gaze behavior, we estimated the lag 1 state transition probability matrix of each participant, using the location of gaze at a particular point in time as a state variable. The sequential gaze behavior of hemianopes was much less predictable than that of controls. In particular, hemianopes tended to move their gaze from bins to distracters, markers, and other locations to a much greater extent than controls, who moved primarily from bins (where they picked up a slat) back to the workspace (where they did the assembly). The decreased predictability of hemianopic gaze behavior could not be interpreted as inaccuracy in directing fixations due to restricted visual input. A lack of accuracy in guiding fixations to a target should be manifested at all locations on the table, and this did not occur. Functional, task-related patterns, such as the tight relationship between the workspace, nuts and bolts bins, were present in both hemianopes and controls. In addition, while hemianopes consistently spent more time looking at distracters than controls, looks to distracters did not occur as subjects searched for the target of the next pickup (which would imply a lack of accuracy with regards to the visual search). Instead, hemianopic fixations on distracters occurred primarily after a fixation on a relevant bin, when gaze might be expected to return to the workspace to guide assembly. Our observations suggest that hemianopes may be maintaining/updating visuo-spatial information relevant to the task in memory by increasing their visual sampling of the table, especially during epochs when gaze is not critically required to direct the hands. Gaze itself serves different components of complex tasks (Hayhoe et al. 1998). Indeed, gaze control can be modeled as the result of a competition among subtasks to direct overt attention to information required by those tasks (Anderson et al. 1997; Droll et al. 2005). If the task of spatial updating is given a higher priority by hemianopes, then it will call gaze away from the tasks of guiding reaches or assembly more often in hemianopes than controls. The timing of these task demands, however, will not be as tightly tied to the sequential structure of the task as guiding fixations, which must occur in the temporal vicinity of a reach.
Pfnets are graphical representations derived from the analysis of pairwise relatedness data (such as similarity ratings, correlations, or transition probabilities) using the pathfinder algorithm(Dearholt and Schvaneveldt 1990). The pathfinder algorithm uses the relatedness data to find the shortest distance between each node (i.e. concept or state) in the network. Any direct links between nodes that are longer than the shortest distance are removed from the graphical representation, thus simplifying the interpretation of structure. Pfnets have proven useful in human factors engineering analyses of complex tasks for simplifying the interpretation of state transition diagrams and revealing sequential patterns that are not otherwise obvious in such diagrams (Cooke et al. 1996). In the current context, for example, the state transition diagrams of significant transitions indicate that the workspace is a common destination from several other locations for control participants. However, for hemianopes, transitions into the workspace were significant only from the nuts and bolts bins. The pfnet indicates that the workspace was nevertheless highly related to several other bins for both controls and hemianopes, which we would expect given the nature of the task. The pfnets also reinforced the finding that hemianopes were less predictable in sequential gaze allocation. The control network was relatively sparse, indicating a high degree of temporal structure, while the hemianopic network was dense, indicating less sequential structure.
It is quite likely that most observers performing the Baufix task would build up a representation of the table layout (Marr 1980; Melcher and Kowler 2001; Hayhoe et al. 2003). This representation would be expected to include information about the spatial layout (Aivar et al. 2005; Sanocki et al. 2006) and identity of objects such as bins, slats and distracters (Hollingworth and Henderson 2002; Noles et al. 2005; Tatler et al. 2005). In addition, the builder must maintain in working memory a representation of the task, goal, current state of the model relative to the task, and future plans (Newell and Simon 1972; Anderson 1993). In normally-sighted individuals, peripheral visual information from the current fixation is likely combined with spatial memory information to guide gaze to the [peripheral] target of an upcoming reach (Epelboim et al. 1995; Karn and Hayhoe 2000; Rao et al. 2002; Henderson 2003; Turano et al. 2003; Aivar et al. 2005; Hayhoe and Ballard 2005; Brouwer and Knill in press). Many of the memory-guided saccades in Aivar et al's experiment were actually to regions currently visible in the retinal image. This suggests that spatial memory aids target selection for objects within the field of view as well as for those outside it. Hemianopes do not have the option of using peripheral visual information if this peripheral target is located in their blind field. A priori, we might expect them to compensate for this lack of peripheral input by using one of the compensatory gaze strategies previously identified in search tasks. The present experiment suggests, however, that hemianopes rely to a greater extent on the spatial information contained in their visual working memory, much as visually intact individuals do for objects outside their normal field of view (Land et al. 1999) or when visual information is degraded (Brouwer and Knill in press). A strategy that uses both visual and memory information, depending on what is available, would ensure a smooth transition between targeting within and outside the field of view in controls as well as in hemianopes. A shift in the relative balance between memory-guided and visually-guided gaze has in fact been observed in patients suffering from central visual field loss (Turano et al. 2002). Whether such a change in behavior occurs automatically following visual loss or is learned by hemianopes as a result of their visual experiences post-lesion remains to be determined.
One unresolved issue is the contribution of blindsight (Weiskrantz et al. 1974) to oculomotor performance on naturalistic tasks such as those used here. While we cannot rule out a contribution of blindsight to visual behavior in naturalistic environments, it is not clear how, in the context of our experiment, blindsight would lead to either increases in the frequency of LAFs or decreased sequential predictability in gaze allocation. Indeed, if blindsight did provide usable information to the visual system about the visual scene, we would predict that it would act to normalize the hemianopes' visual behavior, so that it resembled that of the controls.
Conclusions
By measuring the gaze behavior of three hemianopes and four visually intact controls in a naturalistic task, we found hemianopes and controls to be about equally accurate and efficient at performing the task. While there was no evidence for impaired saccadic targeting in the blind field of hemianopes, this group of subjects fixated the target of an upcoming reach prior to that reach more often than controls. They also fixated on apparently irrelevant locations more often than controls, and they were less predictable in terms of the sequential pattern of their fixated locations. We propose that such behavior reflects increased updating of spatial information in hemianopes' visual representation of the scene, on which hemianopes might rely to a greater degree than controls in order to produce roughly equal performance. The absence of a compensatory gaze bias toward the impaired hemifield or of compensatory saccadic search strategies in our paradigm may reflect the static nature of the task environment and the fact that pieces only changed spatial location through the activity of the participants. This eliminated the need for subjects to perform new visual searches and lent strength to the hypothesis that hemianopes might indeed place greater reliance on spatial memory when performing simple, real-world tasks.
Acknowledgments
This work was supported by grants from the Research to Prevent Blindness Foundation, the Pfeiffer Foundation, the Schmitt Foundation, the NIH (Training grant #08T2EY07125C-13, Core grant # 08P0EY01319F-28 and grant EY05729 to MH). KRH is an RPB Robert E. McCormick Scholar. The authors wish to thank Brian Sullivan and Kelly Chajka for their excellent technical support. We also thank Dr. Ryan Bisbey for performing part of the initial data analysis.
Footnotes
Publisher's Disclaimer: This is a PDF file of an unedited manuscript that has been accepted for publication. As a service to our customers we are providing this early version of the manuscript. The manuscript will undergo copyediting, typesetting, and review of the resulting proof before it is published in its final citable form. Please note that during the production process errors may be discovered which could affect the content, and all legal disclaimers that apply to the journal pertain.
References
- Aivar MP, Hayhoe MM, Chizk CL, Mruczek REB. Spatial memory and saccadic targeting in a natural task. Journal of Vision. 2005;5:177–193. doi: 10.1167/5.3.3. [DOI] [PubMed] [Google Scholar]
- Anderson JR. Problem solving and learning. American Psychologist. 1993;48:35–44. [Google Scholar]
- Anderson JR, Matessa M, Lebiere C. ACT-R: A theory of higher level cognition and its relation to visual attention. Human-Computer Interaction. 1997;12:439–462. [Google Scholar]
- Bahill AT, R CM, Stark LW. The main sequence, a tool for studying human eye movements. Mathematical Biosciences. 1975;24:191–204. [Google Scholar]
- Bakeman R, Quera V. Analyzing Interaction: Sequential Analysis with SDIS and GSEQ. Cambridge University Press; New York: 1995. [Google Scholar]
- Ballard DH, Hayhoe MM, Li F, Whitehead SD. Hand-eye coordination during sequential tasks. Phil Trans R Soc Lond B. 1992;337:331–339. doi: 10.1098/rstb.1992.0111. [DOI] [PubMed] [Google Scholar]
- Ballard DH, Hayhoe MM, Pelz JB. Memory representations in natural tasks. Journal of Cognitive Neuroscience. 1995;7:66–80. doi: 10.1162/jocn.1995.7.1.66. [DOI] [PubMed] [Google Scholar]
- Becker W. Saccades. In: Carpenter RHS, editor. Eye Movement. CRC Press; Boca Raton: 1991. pp. 95–137. [Google Scholar]
- Brouwer AM, Knill DC. The role of memory in visually guided reaching. Journal of Vision. doi: 10.1167/7.5.6. in press. [DOI] [PubMed] [Google Scholar]
- Chedru F, Leblanc M, Lhermitte F. Visual searching in normal and brain-damaged subjects (contribution to the study of unilateral inattention) Cortex. 1973;9:94–111. doi: 10.1016/s0010-9452(73)80019-x. [DOI] [PubMed] [Google Scholar]
- Cooke NJ, Neville KJ, Rowe AL. Procedural network representations of sequential data. Human-Computer Interaction. 1996;11:29–68. [Google Scholar]
- Dearholt DW, Schvaneveldt RW. Properties of pathfinder networks. In: Schvaneveldt RW, editor. Pathfinder Associative Networks: Studies in Network Organization. Ablex Publishing Corporation; Norwood, NJ: 1990. pp. 1–30. [Google Scholar]
- Droll JA, Hayhoe MM, Triesch J, Sullivan BT. Task demands control acquisition and storage of visual information. Journal of Experimental Psychology: Human Perception and Performance. 2005;31:1416–1438. doi: 10.1037/0096-1523.31.6.1416. [DOI] [PubMed] [Google Scholar]
- Epelboim J, Steinman RM, Kowler E, edwards M, Pizlo Z, Erkelens CJ, Collewijn H. The function of visual search and memory in sequential looking tasks. Vision Research. 1995;35:3401–3422. doi: 10.1016/0042-6989(95)00080-x. [DOI] [PubMed] [Google Scholar]
- Gassel MM, Williams D. Visual function in patients with homonymous hemianopia: oculomotor mechanisms. Brain. 1963;86:1–36. doi: 10.1093/brain/86.1.1. [DOI] [PubMed] [Google Scholar]
- Hacisalihzade SS, Stark LW, Allen JS. Visual perception and sequences of eye movement fixations: A stochastic modeling approach. IEEE Transactions on Systems, Man, and Cybernetics. 1992;22:474–481. [Google Scholar]
- Hayhoe MM, Ballard D. Eye movements in natural behavior. Trends in Cognitive Sciences. 2005;9:188–194. doi: 10.1016/j.tics.2005.02.009. [DOI] [PubMed] [Google Scholar]
- Hayhoe MM, Ballard DH, Whitehead SD. Proceedings of the Cognitive Science Society. Vol. 15. Lawrence Erlbaum Associates; Boulder, Colorado: 1993. Memory use during hand-eye coordination; pp. 534–536. [Google Scholar]
- Hayhoe MM, Bensinger DG, Ballard DH. Task constraints in visual working memory. Vision Research. 1998;38:125–137. doi: 10.1016/s0042-6989(97)00116-8. [DOI] [PubMed] [Google Scholar]
- Hayhoe MM, Shrivastava A, Mruczek R, Pelz JB. Visual memory and motor planning in a natural task. Journal of Vision. 2003;3:49–63. doi: 10.1167/3.1.6. [DOI] [PubMed] [Google Scholar]
- Henderson JM. Human gaze control during real-world scene perception. Trends in Cognitive Sciences. 2003;7:498–504. doi: 10.1016/j.tics.2003.09.006. [DOI] [PubMed] [Google Scholar]
- Hollingworth A, Henderson JM. Accurate visual memory for previously attended objects in natural scenes. Journal of Experimental Psychology: Human Perception and Performance. 2002;28:113–136. [Google Scholar]
- Ishiai S, Furukawa T, Tsukagoshi H. Eye-fixation patterns in homonymous hemianopia and unilateral spatial neglect. Neuropsychologia. 1987;25:675–679. doi: 10.1016/0028-3932(87)90058-3. [DOI] [PubMed] [Google Scholar]
- Johannsen RS, Westling GR, Backstrom A, Flanagan JR. Eye-hand coordination in objects manipulation. Journal of Neuroscience. 2001;21:6917–6932. doi: 10.1523/JNEUROSCI.21-17-06917.2001. [DOI] [PMC free article] [PubMed] [Google Scholar]
- Karn KS, Hayhoe MM. Memory representations guide targeting eye movements in a natural task. Visual Cognition. 2000;7:673–703. [Google Scholar]
- Land MF. The coordination of rotations of the eyes, head and trunk in saccadic turns made in natural situations. Experimental Brain Research. 2004;159:151–160. doi: 10.1007/s00221-004-1951-9. [DOI] [PubMed] [Google Scholar]
- Land MF, Furneaux S. The knowledge base of the oculomotor system. (B).Philosophical Transactions, Royal Society of London. 1997;352:1231–1239. doi: 10.1098/rstb.1997.0105. [DOI] [PMC free article] [PubMed] [Google Scholar]
- Land MF, Mennie N, Rusted J. Eye movements and the roles of vision in activities of daily living: making a cup of tea. Perception. 1999;28:1311–1328. doi: 10.1068/p2935. [DOI] [PubMed] [Google Scholar]
- Lebedev S, Van Gelder P, Tsui WH. Square-root relations between main saccadic parameters. Investigative Ophthalmology and Visual Science. 1996;37:2750–2758. [PubMed] [Google Scholar]
- Leigh RJ, Kennard C. Using saccades as a research tool in the clinical neurosciences. Brain. 2004;127:460–477. doi: 10.1093/brain/awh035. [DOI] [PubMed] [Google Scholar]
- Marr D. Visual information processing: the structure and creation of visual representations. Phil Trans R Soc Lond B. 1980;290:199–218. doi: 10.1098/rstb.1980.0091. [DOI] [PubMed] [Google Scholar]
- Meienberg O, Zangemeister EH, Rosenberg M, Hoyt WF, Stark L. Saccadic eye movement strategies in patients with homonymous hemianopia. Annals of Neurology. 1981;9:537–544. doi: 10.1002/ana.410090605. [DOI] [PubMed] [Google Scholar]
- Melcher D, Kowler E. Visual scene memory and the guidance of saccadic eye movements. Vision Research. 2001;41:3597–3611. doi: 10.1016/s0042-6989(01)00203-6. [DOI] [PubMed] [Google Scholar]
- Mennie N, Hayhoe M, Sullivan B. Look-ahead fixations: anticipatory eye movements in natural tasks. Experimental Brain Research. 2007;179:427–442. doi: 10.1007/s00221-006-0804-0. [DOI] [PubMed] [Google Scholar]
- Newell A, Simon HA. Human Problem Solving. Prentice-Hall; Englewood Cliffs, NJ: 1972. [Google Scholar]
- Noles NS, Scholl BJ, Mitroff SR. The persistence of object file representations. Perception and Psychophysics. 2005;67:324–334. doi: 10.3758/bf03206495. [DOI] [PubMed] [Google Scholar]
- Pambakian ALM, Wooding DS, Patel N, Morland AB, Kennard C, Mannan SK. Scanning the visual world: a study of patients with homonymous hemianopia. J Neurol Neurosurg Psychiatry. 2000;69:751–759. doi: 10.1136/jnnp.69.6.751. [DOI] [PMC free article] [PubMed] [Google Scholar]
- Pelz JB, Canosa R. Oculomotor behavior and perceptual strategies in complex tasks. Vision Research. 2001;41:3587–3596. doi: 10.1016/s0042-6989(01)00245-0. [DOI] [PubMed] [Google Scholar]
- Rao RPN, Zelinsky GJ, Hayhoe MM, Ballard DH. Eye movements in iconic visual search. Vision Research. 2002;42:1447–1463. doi: 10.1016/s0042-6989(02)00040-8. [DOI] [PubMed] [Google Scholar]
- Riley ME, Kelly KN, Martin T, Hayhoe M, Huxlin KR. Homonymous hemianopia alters distribution of visual fixations in 3-dimensional virtual environments [Abstract] Vision Sciences Society. 2007;7:289. [Google Scholar]
- Sanocki T, Michelet K, Sellers E, Reynolds J. Representations of scene layout can consist of independent, functional pieces. Perception and Psychophysics. 2006;68:415–427. doi: 10.3758/bf03193686. [DOI] [PubMed] [Google Scholar]
- Tatler BW, Gilchrist ID, Land MF. Visual memory for objects in natural scenes: From fixations to object files. The Quarterly Journal of Experimental Psychology. 2005;58A:931–960. doi: 10.1080/02724980443000430. [DOI] [PubMed] [Google Scholar]
- Turano KA, Geruschat DR, Baker FH. Fixation behavior while walking: persons with central visual field loss. Vision Research. 2002;42:2635–2644. doi: 10.1016/s0042-6989(02)00299-7. [DOI] [PubMed] [Google Scholar]
- Turano KA, Geruschat DR, Baker FH. Oculomotor strategies for the direction of gaze tested with a real-world activity. Vision Research. 2003;43:333–346. doi: 10.1016/s0042-6989(02)00498-4. [DOI] [PubMed] [Google Scholar]
- Weiskrantz L, Warrington EK, Sanders MD, Marshall J. Visual capacity in the hemianopic field following a restricted occipital ablation. Brain. 1974;97:709–728. doi: 10.1093/brain/97.1.709. [DOI] [PubMed] [Google Scholar]
- Wickens TD. Models for Behavior: Stochastic Processes in Psychology. W. H. Freeman and Co.; San Francisco: 1982. [Google Scholar]
- Zangemeister WH, Oechsner U, Freksa C. Short-Term Adaptation of Eye Movements in Patients with Visual Hemifield Defects Indicates High Level Control of Human Scanpath. Optom Vis Sci. 1995;72:467–477. [PubMed] [Google Scholar]
- Zhang X, Kedar S, Lynn MJ, Newman NJ, Biousse V. Homonymous hemianopias: Clinical-anatomic correlations in 904 cases. Neurology. 2006;66 doi: 10.1212/01.wnl.0000203913.12088.93. [DOI] [PubMed] [Google Scholar]
- Zihl J. Visual scanning behavior in patients with homonymous hemianopia. Neuropsychologia. 1995;33:287–303. doi: 10.1016/0028-3932(94)00119-a. [DOI] [PubMed] [Google Scholar]