Abstract
Glycerol-3-phosphate acyltransferase (GPAT) catalyzes the initial step in the synthesis of all glycerolipids. It is the committed and rate-limiting step and is redundant in Saccharomyces cerevisiae, mammals, and plants. GPAT controls the formation of lipid intermediates that serve not only as precursors of more-complex lipids but also as intracellular signaling molecules. Saccharomyces cerevisiae possesses two GPATs, encoded by the GAT1 and GAT2 genes. Metabolic analysis of yeast lacking either GAT1 or GAT2 indicated partitioning of the two main branches of phospholipid synthesis at the initial and rate-limiting GPAT step. We are particularly interested in identifying molecular determinants mediating lipid metabolic pathway partitioning; therefore, as a starting point, we have performed a detailed study of Gat1p and Gat2p cellular localization. We have compared Gat1p and Gat2p localization by fluorescence microscopy and subcellular fractionation using equilibrium density gradients. Our results indicate Gat1p and Gat2p overlap mostly in their localization and are in fact microsomal GPATs, localized to both perinuclear and cortical endoplasmic reticula in actively proliferating cells. A more detailed analysis suggests a differential enrichment of Gat1p and Gat2p in distinct ER fractions. Furthermore, overexpression of these enzymes in the absence of endogenous GPATs induces proliferation of distinct ER arrays, differentially affecting cortical ER morphology and polarized cell growth. In addition, our studies also uncovered a dynamic posttranslational regulation of Gat1p and Gat2p and a compensation mechanism through phosphorylation that responds to a cellular GPAT imbalance.
The first step in the synthesis of almost all membrane phospholipids and neutral glycerolipids is catalyzed by glycerol-3-phosphate acyltransferases (GPATs; EC 2.3.1.15). This enzyme transfers a fatty acid from fatty acyl coenzyme A to the sn-1 position of glycerol-3-phosphate to produce lysophosphatidic acid (LysoPA). LysoPA is further acylated at the sn-2 position by a separate acyltransferase to produce phosphatidic acid (PA). PA can be either (i) dephosphorylated to produce diacylglycerol (DAG) or (ii) converted to CDP-DAG. These lipids not only are precursors of all glycerolipids but also are dynamic components of signal transduction systems that control cell physiology. Regulated interconversion of signaling lipids like LysoPA, PA, and DAG transmits information in part by their biophysical properties (5) and through lipid-lipid and lipid-protein interactions (18, 23, 29). The mechanisms of the regulation of PA biosynthesis, of the rate-limiting GPAT step, and of lipid metabolic pathway partitioning are not known (8, 12).
GPATs are present in bacteria, fungi, plants, and animals. We and others have previously identified a unique gene pair in Saccharomyces cerevisiae, YKR067W (GAT1/GPT2) and YBL011W (GAT2/SCT1), and demonstrated that they code for the major GPATs in this organism (32, 34). Bioinformatic approaches, using a region conserved between the yeast GPATs and other fatty acid acyltransferases as a query, identified seven members of the GPAT family in the model organism Arabidopsis thaliana (33). A substantial level of redundancy is also found in animals. Four mammalian GPAT isoforms have been identified to date, each encoded by a different gene. Two are localized in the mitochondria (mitochondrial GPAT1 [mtGPAT1] and mtGPAT2) (4, 20) and two in the endoplasmic reticulum (ER) (microsomal GPAT3 and GPAT4) (4, 24). The existence of additional genes encoding proteins with GPAT activity has been suggested (12).
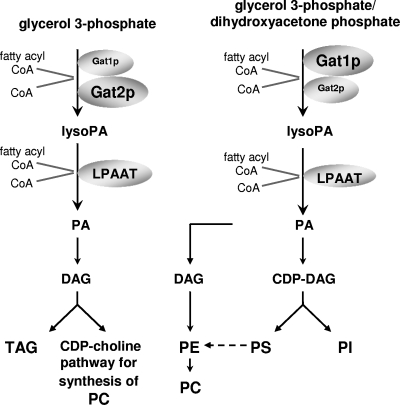
Thus, the emerging picture indicates that the traditional PA biosynthetic pathway in most eukaryotes is divided into many more parts that were recently believed and opens the possibility of each GPAT having a differential contribution to specific pools of LysoPA, PA, and DAG. In this regard, metabolic analysis of yeast containing an inactivated GAT1 gene or an inactivated GAT2 gene indicated that Gat2p is the primary supplier of DAG, used mainly in triacylglycerol synthesis and phosphatidylcholine synthesis through the CDP-choline pathway (32). These results indicated partitioning of the two main branches of phospholipid synthesis at the initial and rate-limiting GPAT step (Fig. 1).
FIG. 1.
Differential partitioning of glycerolipids metabolized by separate GPATs in yeast. PC, phosphatidylcholine; PE, phosphatidylethanolamine; PS, phosphatidylserine; PI, phosphatidylinositol; TAG, triacylglycerol; LPAAT, LysoPA acyltransferase; CoA, coenzyme A.
We are particularly interested in identifying molecular determinants mediating lipid metabolic pathway partitioning. Elucidation of how lipid metabolic systems are spatiotemporally regulated is a major challenge for the field (29).
It is well known that within eukaryotic cells, the synthesis of lipids is restricted, and localization of biosynthetic systems is in fact the first determinant of the distinct compositions of organelles. One plausible explanation for the differential contribution of Gat1p and Gat2p to lipid metabolic pathway partitioning is that they are localized to different subcellular compartments.
To explore this possibility, we have compared Gat1p and Gat2p subcellular localization by fluorescence microscopy and subcellular fractionation using equilibrium density gradients. Biochemical assays have previously pointed out that GPAT activity in yeast is distributed between microsomal fractions and lipid particles (1, 2). Furthermore, a global green fluorescent protein (GFP) localization study in yeast indicated that Gat1p and Gat2p localize primarily to the ER, but it was not determined whether the Gat1-GFP and Gat2-GFP proteins were functional (1, 2, 11). Our results indicate that Gat1p and Gat2p are in fact microsomal GPATs, localized to both perinuclear and cortical ER in exponentially growing cells. Although they overlap mostly in their localization, a detailed analysis of their distribution using equilibrium density gradients suggests a differential enrichment of Gat1p and Gat2p in distinct ER fractions. Moreover, overexpression of Gat1p or Gat2p in the absence of endogenous GPATs induces proliferation of distinct ER arrays, differentially affecting cortical ER morphology. Our studies also revealed a dynamic posttranslational regulation of Gat1p and Gat2p through phosphorylation that responds to Gat1p/Gat2p cellular imbalance.
MATERIALS AND METHODS
Media, plasmids, and yeast strain construction.
Standard molecular biology methods, yeast genetic techniques, and transformation methods were used (13, 26). Yeast complex medium was supplemented to a final concentration of 2% (wt/vol) glucose (yeast extract-peptone-dextrose) or 2% (wt/vol) galactose (yeast extract-peptone-galactose), and synthetic minimal medium using 2% (wt/vol) glucose, galactose, or raffinose was supplemented, as required for plasmid maintenance (13). All strains used in this study are listed in Table 1 .
TABLE 1.
Strains used in this study
| Strain | Genotype | Reference/source |
|---|---|---|
| W303-1a | MATaura3-1 his3-11,15 leu2-3,112trp1-1 ade2-1 can1-100 | 31 |
| W303-1A | MATα ura3-1 his3-11,15 leu2-3,112trp1-1 ade2-1 can1-100 | 31 |
| CMY201 | MATα ura3-1 his3-11,15 leu2-3,112 trp1-1 ade2-1 can1-100gat2Δ::HIS3 | 31 |
| CMY202 | MATaura3-1 his3-11,15 leu2-3,112 trp1-1 ade2-1can1-100 gat2Δ::HIS3 | 31 |
| CMY203 | MATα ura3-1 his3-11,15 leu2-3,112 trp1-1ade2-1 can1-100 gat1Δ::TRP1 | 31 |
| CMY204 | MATaura3-1 his3-11,15 leu2-3,112 trp1-1 ade2-1 can1-100 gat1Δ::TRP1 | 31 |
| CMY228 | MATα ura3-1 his3-11,15 leu2-3,112 trp1-1 ade2-1 can1-100 gat1Δ::TRP1gat2Δ::HIS3 [pGAL1::GAT1 URA3] | 31 |
| VZY23 | MATα ura3-1 his3-11,15 leu2-3,112 trp1-1 ade2-1 can1-100 gat1Δ::TRP1gat2Δ::HIS3 [pGAL1::GAT2 URA3] | This study |
| BY4741 | MATahis3 leu2 met15 ura3 | Euroscarf |
| Y15983 | MATα his3 leu2 lys2 ura3 gat1Δ::kanMX4 | Euroscarf |
| Y13037 | MATα his3 leu2 lys2 ura3 gat2Δ::kanMX4 | Euroscarf |
| SIK1-RFP | MATα his3 leu2 lys2 ura3 SIK1::RFPkanMX4 | P. Arvidson |
| YKR067W-GFP | MATahis3 leu2 met15 ura3 GAT1::GFPHIS3 | Invitrogen |
| YBL011W-GFP | MATahis3 leu2 met15 ura3 GAT2::GFPHIS3 | Invitrogen |
| VZY40 | MATa/α his3/hisleu2/leu2met15/MET15LYS2/lys2ura3/ura3 GAT1::GFP HIS3/GAT1SIK1/SIK1::RFP kanMX4 | This study |
| VZY41 | MATa/α his3/his3leu2/leu2met15/MET15LYS2/lys2ura3/ura3GAT2::GFP HIS3/GAT2 SIK1/SIK1::RFP kanMX4 | This study |
| VZY21 | MATα his3 leu2 ura3 GAT1::GFP HIS3 gat2Δ::kanMX4 | This study |
| VZY31 | MATα his3 leu2 ura3 GAT2::GFP HIS3 gat1Δ::kanMX4 | This study |
| SC2158 | MATaade2 arg4 leu2-3,112 trp1-289 ura3-52 GAT1::TAP K.I.URA3 | Euroscarf |
| SC0428 | MATaade2 arg4 leu2-3,112 trp1-289 ura3-52 GAT2::TAP K.I.URA3 | Euroscarf |
| VZY27 | MATα lys2 ade2 leu2 ura3 GAT1::TAP K.I.URA3 gat2Δ::kanMX4 | This study |
| VZY28 | MATα trp1 his3 leu2 ura3 GAT2::TAP K.I.URA3 gat1Δ::kanMX4 | This study |
Strains with endogenous expression of yeast GPATs.
Strains expressing Gat1-GFP and Gat2-GFP from the endogenous locus and native promoter (Invitrogen) were isogenic to strain BY4741. Gat1-TAP and Gat2-TAP, also expressed from the endogenous locus and native promoter (Euroscarf) were derived from S288C. Mutant strains with Gat1-GFP/TAP or Gat2-GFP/TAP were made by mating with gat2Δ or gat1Δ deletion strains in the same background, respectively, followed by sporulation and tetrad dissection analysis. Gene disruption events as well as tag insertions were confirmed through genomic PCR and sequencing.
Overexpression system.
Plasmid pYES-GAT1 was previously described (32). To make plasmid pYES-GAT2, the GAT2 open reading frame (lacking its stop codon) was amplified by PCR from genomic DNA of strain BY4741 and cloned into pYES-TOPO (Invitrogen). The resulting plasmid contained GAT2 in frame with the coding sequence of the V5 epitope tag at its 3′ end and under the control of the GAL1 promoter, with URA3 as the selectable marker. To generate the conditional lethal strain VZY23, pYES-GAT2 was transformed into the CMY201 and CMY204 strains. Ura+ transformants were mated, a diploid strain bearing the plasmid was selected and sporulated, and meiotic progeny was isolated on plates with yeast extract-peptone-dextrose containing galactose. GAT1 and GAT2 gene disruptions of cells unable to grow on glucose were confirmed through genomic PCR.
Subcellular fractionation.
Subcellular fractionation of yeast cells (microsomal fraction preparation) was performed, as described previously (32). Fractionation using sucrose gradients was carried out, as described previously (16), with several modifications. Briefly, 20 optical-density-at-600-nm units of cells grown to mid-log phase were harvested, washed once, resuspended in 10 mM dithiothreitol and 10 mM Tris-HCl (pH 8.9), and incubated at 30°C for 15 min. Cells were then resuspended in spheroplasting buffer {1 M sorbitol, 20 mM PIPES [piperazine-N,N′-bis(2-ethanesulfonic acid)]-KOH [pH 6.8]} supplemented with 0.12 mg of zymolyase (T100) and incubated at 30°C for 30 to 45 min, with occasional shaking. Spheroplasts were harvested and washed once in spheroplasting buffer by pelleting at 3,000 × g for 3 min. Spheroplasts were then resuspended in lysis buffer (0.2 M sorbitol, 10 mM Tris-HCl [pH 7.5], 10 mM EDTA) with protease inhibitors (1× Roche complete, 10 mM phenylmethylsulfonyl fluoride [PMSF], 3 μg/ml pepstatin) and lysed using a Dounce homogenizer (30 strokes). Cell lysates were cleared for 5 min at 3,000 × g. Total cell lysate (150 μg protein) was loaded onto a 20-to-60% sucrose gradient and centrifuged at 100,000 × g for 18 h (MLS-50 swinging bucket rotor, Optima MAX-E Ultracentrifuge; Beckman). Fractions (200 μl) were collected from the top of the gradient. In order to detect endogenous Gat1p and Gat2p using anti-GFP antibodies (Clontech), proteins were acetone precipitated. Four volumes of ice-cold acetone were added to one volume of fraction containing 10 μg bovine serum albumin as a protein carrier. Samples were precipitated overnight at −20°C and then centrifuged at maximum speed in an Eppendorf microcentrifuge (15,700 × g) for 20 min at 4°C. Pellets were then washed with 500 μl ice-cold acetone, dried, and resuspended in 100 mM NaOH and 1% sodium dodecyl sulfate (SDS). Fractions were analyzed by 8% SDS-polyacrylamide gel electrophoresis, followed by Western blotting with antibodies against GFP as well as Pma1p and Erg6p (kind gifts from Ramón Serrano, Universidad Politécnica de Valencia, and G. Daum, Universität Graz, respectively) and Dpm1p or Pgk1p (Molecular Probes) and subsequently with horseradish peroxidase-conjugated secondary antibodies, followed by detection using enhanced chemiluminescence (Pharmacia). Densitometry of the blots was performed using ImageJ (Wayne Rasband, National Institutes of Health). Experiments were repeated four times.
Immunoprecipitation and phosphatase treatment.
Exponentially growing cells were harvested and resuspended in an equal volume (vol/vol) of lysis buffer (50 mM Tris-HCl [pH 7.2], 0.15 M NaCl, 0.27 M sucrose, 0.1% deoxycholic acid, 1% Nonidet P-40, 1 mM dithiothreitol, 3 μg/ml pepstatin, 1 mM PMSF, and complete EDTA-free protease inhibitor mix [Roche]). A 1:1 dilution volume of acid-washed glass beads was added to each sample and bead beaten (two times, 1 min each) at 4°C, followed by removal of unbroken cells and debris (13,000 rpm, 1 min). Cell lysates were then incubated with 15 μl of agarose-immobilized goat immunoglobulin G (Bethyl) per 100 μg of total protein for 2 h at 4°C. Clarified protein extracts were incubated with 10 μl of agarose-immobilized goat anti-V5 antibody (Bethyl) per 100 μg of total protein overnight at 4°C. Immunoprecipitates were washed three times with lysis buffer and resuspended in 30 μl of phage λ phosphatase buffer (50 mM Tris-HCl [pH 7.5], 0.1 mM EDTA, 5 mM dithiothreitol, 0.01% Brij 35, and 2 mM MnCl2). After incubation for 30 min at 30°C, with or without the addition of 200 units of λ phosphatase (New England Biolabs), reactions were stopped by addition of EDTA (50 mM). Beads were centrifuged and resuspended in 20 μl SDS loading buffer and subjected to Western blotting with anti-V5 antibodies (Invitrogen).
Alternatively, phosphatase treatment was performed using crude cell extracts. For this, cells were lysed in TNE buffer (50 mM Tris-HCl [pH 7.4] containing 150 mM NaCl, 5 mM EDTA, protease inhibitor cocktail [Roche], 1 mM PMSF, and 3 μg/ml pepstatin) using glass beads, as indicated above. For phosphatase treatment of samples containing endogenous levels of Gat1-GFP or Gat2-GFP, 60 μg of total protein was used, and the incubation time was reduced to 20 min at 30°C. Importantly, no dephosphorylation due to endogenous phosphatases was observed during this incubation time in control samples lacking λ phosphatase. Experiments were repeated at least three times.
Fluorescence and light microscopy.
Cells were processed for indirect immunofluorescence microscopy for the localization of Gat1p and Gat2p, as described previously (15). Cells from log-phase cultures were fixed and processed for detection of Gat1p-V5 and Gat2p-V5 by immunofluorescence using monoclonal anti-V5 antibodies (Invitrogen) and Alexa 488 goat anti-mouse secondary antibodies (Invitrogen). DNA was stained using 4′,6-diamidino-2-phenylindole (DAPI; BioChemika, Sigma-Aldrich). All samples were analyzed using a Zeiss Axiovert 200-M microscope fitted with a Plan Neofluor 100× oil immersion objective lens. Images were captured using a Zeiss AxioCam HR and using AxioVision 40 version 4.6.3.0 software. Adobe Photoshop 7.0 was used for image alignment and labeling.
GFP fusion proteins were visualized using a GFP filter, an excitation wavelength of 489 nm, and an emission wavelength of 509 nm. DNA was visualized using a DAPI filter, an excitation wavelength of 359 nm, and an emission wavelength of 461 nm.
For axial ratio determination, differential interference contrast images obtained with the same magnification were analyzed using AxioVision LE version 4.6.3.0 software.
Quantification of Gat1-GFP or Gat2-GFP association with perinuclear or cortical ER in fluorescent images was done using ImageJ (National Institutes of Health). The area to be analyzed was determined on a cell-by-cell basis by hand, using the free drawing tool with the program. Only cells where the entire perimeter of the nucleus was clearly visualized were used for this analysis.
Transmission electron microscopy.
The cells were fixed with 1.6% paraformaldehyde and 2.5% glutaraldehyde in 0.1 M cacodylate buffer, pH 7.4, overnight. After being rinsed with the same buffer, the cells were postfixed in 2% aqueous potassium permanganate for 1 h and then stained in 1% uranyl acetate for 1 h. The samples were dehydrated through a series of solutions containing an increasing concentration of ethanol and then embedded in Quetol resin. Ultrathin sections were cut in a Reichert-Jung Ultracut E microtome using a diamond knife and stained with lead citrate. The sections were observed under a Hitachi H-7650 transmission electron microscope at 80 kV. The images were taken with an AMT 16000 digital camera mounted on the microscope.
Protein determination.
Protein concentration was determined by the Lowry et al. method (22) in the presence of 0.09% Na deoxycholate.
Statistical analysis.
GraphPad Prism 3.03 software was used for statistical analysis of data and preparation of figures.
RESULTS
Subcellular localization of yeast GPATs.
Our first goal was to determine the subcellular localization of yeast GPATs expressed at endogenous levels in exponentially growing cells. We note that Gat1p and Gat2p are predicted to be integral membrane proteins that are not abundant, and attempts to raise polyclonal antisera have met thus far with limited success (data not shown). Therefore, we used cells in which the genomic GAT1 or GAT2 gene was expressed from the endogenous locus and native promoter, with GFP fused to the C termini, which should yield expression levels at or close to the endogenous level.
One possible concern is that fusion of a tag to these proteins can result in nonfunctional enzymes. To evaluate this, we then took advantage of the fact that simultaneous loss of function of GAT1 and GAT2 is synthetically lethal (32, 34). Thus, prior to initiating localization studies, we have assessed the functionality of all tagged or fusion proteins by challenging them to support life in the absence of the other GPAT. For this purpose, yeast with genetically inactivated GAT1 or GAT2 genes but containing the genomic version of the other GPAT fused to GFP (or TAP tag) was generated. In all cases, progeny with the intended genotype was obtained after sporulation of diploids and tetrad dissection (see Materials and Methods). Viability of these strains indicated that the C-terminal end GFP or TAP fusions yield functional enzymes. Western blot analysis of the fusion proteins in the parental and single knockout strains showed relative abundance of Gat1p similar to that of Gat2p, regardless of the tag, further validating the use of these strains for the proposed studies (see Fig. S1 in the supplemental material).
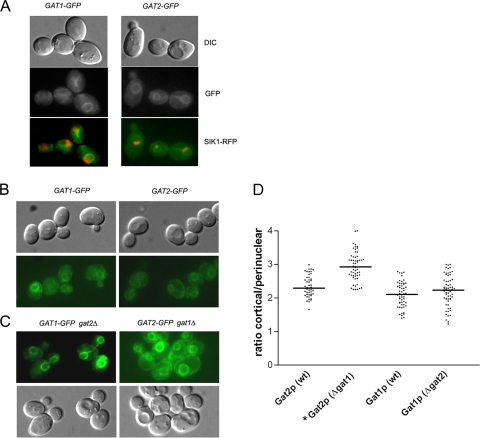
We then examined Gat1p and Gat2p subcellular localization in exponentially growing cells carrying endogenous levels of Gat1p or Gat2p fused to GFP at their carboxy terminus. Fluorescence microscopy sections of cells expressing Gat1p-GFP or Gat2p-GFP showed the typical pattern of perinuclear and cortical ER, with sporadic cytoplasmic connections (Fig. 2A and B). No apparent differences in the localization of the two proteins were observed.
FIG. 2.
Gat1p and Gat2p are localized to the ER. Live imaging of endogenous levels of Gat1-GFP and Gat2-GFP in exponentially growing cells. (A) Perinuclear ER localization of Gat1p and Gat2p (green) is observed in cells coexpressing the nucleolus marker Sik1-RFP (red). DIC, differential interference contrast images. (B and C) GAT1-GFP GAT2 and GAT2-GFP GAT1 (wild-type background) (B) or GAT1-GFP gat2Δ and GAT2-GFP gat1Δ (C) strains. Images were obtained using the same exposure time to allow for comparison of the pictures. (D) Cortical/perinuclear ratio distribution of Gat1-GFP or Gat2-GFP in the wild type (wt) versus that in the gat single mutants. Central horizontal lines correspond to the medians. The asterisk in the distribution of Gat2-GFP (Δgat1) denotes a significantly (P < 0.001) different distribution than that of the wild type (Dunnett's test, n ≥ 60).
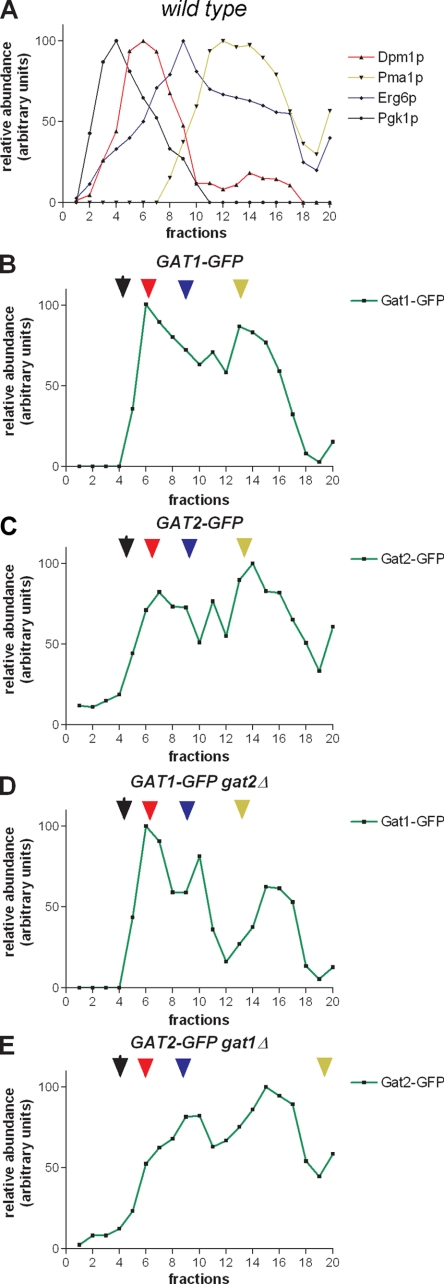
In order to corroborate the results observed with fluorescence microscopy in vivo and to learn more details about their localization, subcellular fractionation was performed on sucrose density gradients that resolve the ER from other intracellular membranes. Cells were spheroplasted and gently lysed in order to preserve organelles (see Materials and Methods). Lysis and fractionation were performed in the presence of EDTA in order to strip the ER of ribosomes. This alters ER density, allowing resolution of this compartment from the plasma membrane (PM) (9, 25). The distribution of endogenous Gat1p and Gat2p was compared by Western blot analysis, to that of the ER marker Dpm1p, ER/lipid particle protein Erg6p and to that of Pma1p, which marks the PM. A cytosolic marker, Pgk1p, was also included (Fig. 3; see also Fig. S1 in the supplemental material). Due to the low abundance of Gat1p and Gat2p combined with the diluting nature of the method used, we were forced to precipitate proteins from the fractions in order to detect the GPATs using anti-GFP antibodies.
FIG. 3.
Subcellular fractionation of Gat1p and Gat2p. The same strains shown in Fig. 2B and C expressing endogenous levels of Gat1-GFP or Gat2-GFP (in the wild type or gat single-knockout mutants) were grown to mid-exponential phase in liquid culture. Cells were spheroplasted, and subcellular fractionation was performed, as indicated in Materials and Methods, using sucrose density gradients. Equilibrium distribution of Pgk1p (cytosol, black), Dpm1p (ER, red), Erg6p (ER/lipid particle, blue), and Pma1p (PM, orange) in an isogenic wild-type strain. (A) was similar in all GFP strains analyzed (B to E), except for Pma1p in gat1Δ (E). Densitometry of the blots obtained for each protein was performed, and the amount per fraction was expressed relative to the value obtained for its respective peak. A representative experiment of four performed under similar conditions is shown. Corresponding blots are shown in Fig. S1 in the supplemental material.
This procedure revealed a unique bimodal distribution of Gat1p and Gat2p. The first peak (fractions 6 to 8) (Fig. 3A to C; see also Fig. S1A to C in the supplemental material) cofractionated with the ER resident protein Dpm1p. The second peak (spanning fractions 13 to 15) (Fig. 3A to C) overlapped the equilibrium distribution of the PM marker Pma1p and was also enriched in Erg6p. Although Gat1p and Gat2p completely overlapped in their equilibrium distribution, some highly reproducible differences were observed. We constantly found Gat1p to be most abundant in the low-density peak, while Gat2p was enriched in the second, denser peak and expanded toward the bottom of the gradient (Fig. 3B to C). All together, these results indicate that Gat1p and Gat2p are microsomal GPATs that overlap mostly in their subcellular localization. They also suggest that distinct subcompartments may exist in the ER, which are differentially enriched in Gat1p or Gat2p.
In an attempt to provide further evidence to support this idea, we then examined the effect that deletion of one GPAT would have on the localization of the other one. For this purpose, yeast with genetically inactivated GAT1 or GAT2 genes but containing the other GPAT fused to GFP expressed from its native promoter was subjected to localization studies, as described above. Analysis of live cells by fluorescence microscopy revealed an enhanced cortical localization of Gat2p in the absence of Gat1p, while no significant change in Gat1p distribution in the absence of Gat2p was detected (Fig. 2D). The differences previously observed in the equilibrium distribution of Gat1p and Gat2p in sucrose density gradients were accentuated when the other GPAT was missing (compare Fig. 3B and D as well as Fig. 3C and E). Importantly, no changes in the levels or distribution of the markers analyzed were observed, except for an enrichment of Pma1p in the bottom fractions when Gat1p was missing (see Discussion). In summary, ER distribution of Gat2p is sensitive to the presence of Gat1p, suggesting cellular mechanisms act to adapt to a GPAT imbalance.
Cells compensate for GPAT deficit.
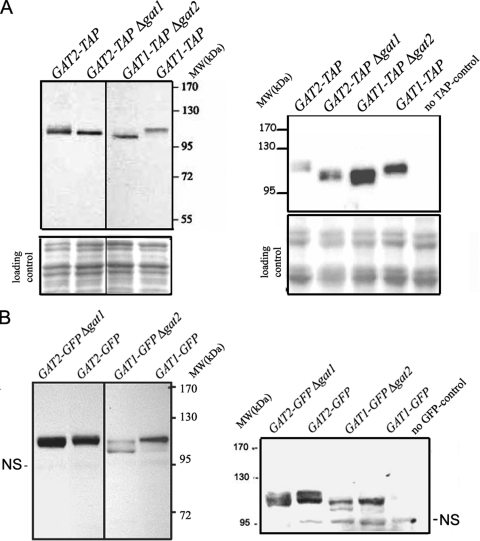
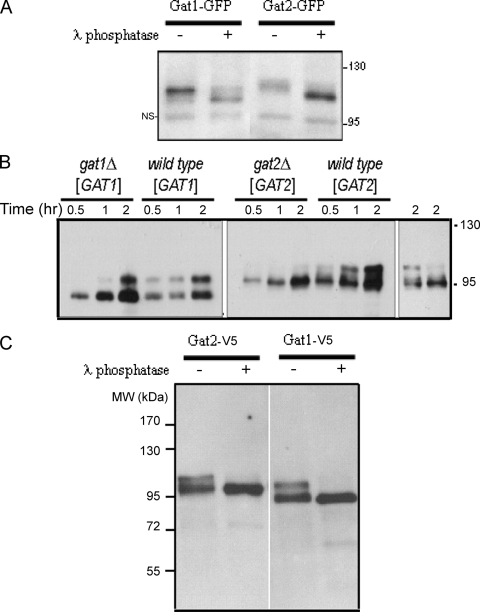
Our localization studies raised the possibility that a compensation mechanism in the gat1 deletion strains acts to offset the GPAT deficit. In fact, Western blot analysis of endogenous Gat1p and Gat2p from wild-type, gat1Δ, and gat2Δ deletion cells revealed that both Gat1p and Gat2p undergo striking changes when cells lack the other GPAT (Fig. 4; see also Fig. S1 in the supplemental material). Interestingly, multiple Gat1p and Gat2p mobility shifts were resolved by SDS-polyacrylamide gel electrophoresis, and a pronounced shift in the electrophoretic mobility of Gat1p and Gat2p was observed in gat2Δ and gat1Δ deletion strains, respectively. These results were independent of the tag used, since similar migration patterns were observed with strains carrying either GFP (Fig. 4B) or TAP-tagged Gat proteins (Fig. 4A) expressed at endogenous levels.
FIG. 4.
Cells compensate for GPAT deficit. Analysis of endogenous Gat1p and Gat2p levels in exponentially grown wild-type or gat single-knockout strains. (A) TAP-tagged strains were lysed (see Materials and Methods), and 25 μg total protein samples were loaded onto an 8% denaturing gel and then subjected to Western blot analysis using rabbit immunoglobulin G (to recognize the protein A moiety of the TAP tag). The loading controls shown correspond to the same membranes stained with Ponceau red after protein transfer. MW, molecular weight. (B) Alternatively, GFP-tagged strains shown in Fig. 2 and 3 (50 μg total protein) were blotted with a monoclonal anti-GFP antibody. The nonspecific band (NS) serves as the loading control. The same samples used in on the left in panels A and B were loaded in a parallel gel that was run for an extra 30 min to allow further separation and visualization of the multiple bands present in each sample. It is worth noting that the appearance of multiple bands and that the migration shift observed in the single-knockout strains, regardless of the tag, compared to those of wild-type cells for both Gat1p and Gat2p. Gat1p predicted molecular mass, 83.6 kDa; Gat1-TAP, ∼104 kDa; Gat1-GFP, ∼114 kDa; Gat2p, 85.7; Gat2-TAP, ∼106 kDa; Gat2-GFP, ∼116 kDa.
Therefore, deletion of one GPAT seems to be counterbalanced by a mechanism that involves regulation through posttranslational modification of yeast GPATs.
Yeast GPATs are phosphoproteins.
Reduced electrophoretic mobility bands are often indicative of phosphorylation, leading us to test if the yeast GPATs were phosphorylated. For that purpose, Gat1-GFP and Gat2-GFP were subjected to treatment with λ phosphatase. We note that cell lysates lacking phosphatase inhibitors significantly loose the slow-migrating bands when incubated for 20 min at 30°C (data not shown). Thus, in order to decrease the presence of endogenous phosphatases while enriching the samples in GPATs, we isolated microsomal fractions. Lysis and subcellular fractionation were performed in the presence of phosphatase inhibitors, and proteins were precipitated before resuspension in phosphatase assay buffer. This strategy resulted in better preservation of slow-migrating bands during incubation of control untreated samples (Fig. 5A). Importantly, the mobility of both proteins was increased by phosphatase treatment (Fig. 5A), suggesting Gat1p and Gat2p are basally phosphorylated in wild-type yeast.
FIG. 5.
Gat1p and Gat2p are phosphoproteins. (A) Wild-type cells expressing endogenous levels of Gat1-GFP or Gat2-GFP were grown to mid-exponential phase in liquid culture and then lysed in the presence of phosphatase inhibitors, followed by subcellular fractionation, as indicated in Materials and Methods. Fifteen micrograms of protein from microsomal fraction preparations were acetone precipitated, resuspended in phosphatase assay buffer, and either left untreated or incubated with λ phosphatase (400 units) for 20 min at 30°C. Samples were then subjected to Western blot analysis with anti-GFP antibodies (as described in Materials and Methods). NS, nonspecific band. (B) Strains CMY203 (gat1Δ) and CMY201 (gat2Δ) were transformed with pGAL1-GAT1-V5 or pGAL1-GAT2-V5, respectively. Isogenic wild-type cells were also transformed with the same plasmids. Transformants were grown to mid-exponential phase in selective media containing 2% raffinose (time zero), and then expression was induced by shifting the cells to fresh media containing 2% galactose. Samples were collected at the indicated time points after the shift and lysis was performed in the presence of phosphatase inhibitors. Expression of Gat1p and Gat2p (5 μg of total protein) was analyzed by Western blotting using anti-V5 antibodies. (Right) Gat2p pattern in wild-type and gat2Δ cells after 2 h of the shift. Deliberately less total protein was loaded for the wild-type sample to show that the differences observed in the pattern are not due to differences in total Gat2p present in the sample. (C) Cell extracts from gat1Δ(pGAL1-GAT1-V5) and gat2Δ(pGAL1-GAT2-V5) transformants similar to the ones used in panel B were grown on galactose to mid-exponential phase and subjected to immunoaffinity precipitation using anti-V5-agarose beads. Immunoprecipitates were washed, as indicated in Materials and Methods, and either left untreated or incubated with λ phosphatase (200 units) for 30 min at 30°C. Beads were then subjected to Western blot analysis with anti-V5 antibodies. MW, molecular weight.
We reasoned that if low levels of total GPAT induce an increase in the electrophoretic mobility of endogenous Gat1p and Gat2p (Fig. 4), then overexpression of these proteins would have the opposite effect, enriching our samples with the more reduced mobility forms. We therefore used the GAL1 galactose-inducible promoter to drive GAT1 or GAT2 expression from a high-copy plasmid (32, 34) in gat1Δ or gat2Δ deletion strains, respectively, as well as in wild-type cells. Both proteins were V5 tagged in their carboxy termini. Time course experiments of gat1Δ(pGAT1) and gat2Δ(pGAT2) transformants grown on raffinose revealed that both Gat1p and Gat2p were predominantly expressed as a single band after 30 to 60 min of shifting the cells to galactose (Fig. 5B). As expression increased, bands of more reduced electrophoretic mobility appeared (2 h), and this was sustained after maximum expression was achieved (untreated cells) (Fig. 5C). Interestingly, there was a significant delay in the appearance of the upper bands, for both Gat1p and Gat2p, after the shift to galactose in GPAT-deficient transformants compared to that in wild-type transformants (Fig. 5B). These results further support our findings of endogenous levels of Gat1p and Gat2p in single knockout strains, suggesting faster-migrating forms are favored when there is a GPAT deficit.
To confirm that the mobility shift of Gat1p and Gat2p was due to phosphorylation, whole-cell extracts overexpressing Gat1p-V5 or Gat2p-V5 were immunoaffinity precipitated and subjected to treatment with λ phosphatase. The mobility of both Gat1p-V5 and Gat2p-V5 was increased by phosphatase treatment, indicating that they were phosphorylated and that the phosphatase acted directly on them (Fig. 5C).
Based on these results, we concluded that Gat1p and Gat2p are phosphoproteins and that their phosphorylation status responds to total GPAT levels in the cell. In general, slow-migrating bands predominate when a GPAT surplus is induced, while faster-migrating forms are associated with GPAT insufficiency.
Characterization of conditional double-knockout gat1Δ gat2Δ strains.
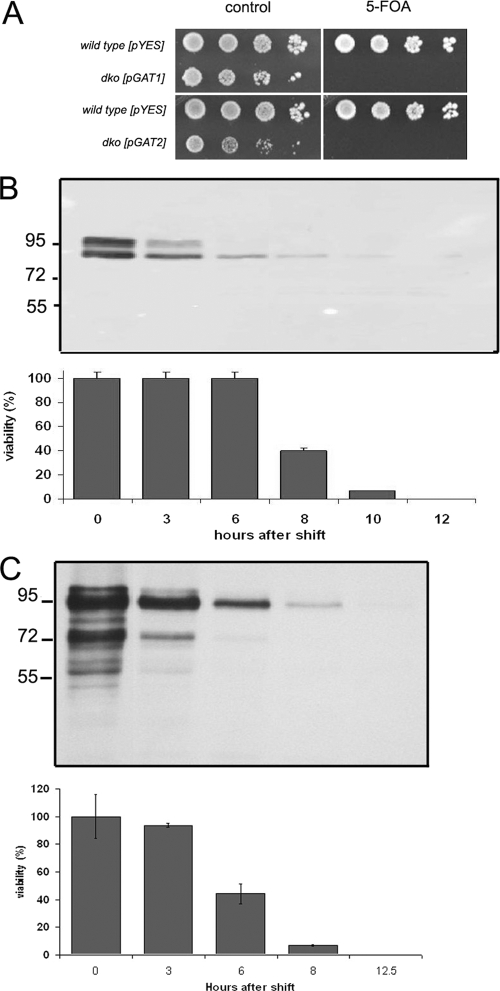
Loss of function of Gat1p and Gat2p is masked by the compensatory effect of their redundant partner. To explore common as well as unique contributions of Gat1p and Gat2p to cellular function, we studied the effect that overexpression of these proteins has in cells with genetically inactivated GAT1 and GAT2 genes. These cells are maintained by using the GAL1 galactose-inducible promoter to drive GAT1 or GAT2 expression from a high-copy plasmid in gat1::TRP1 gat2::HIS3 yeast (Fig. 6A). We will refer to these strains as dko-GAT1 (32) and dko-GAT2, for the gat1Δ gat2Δ double knockout containing the pGAL1-GAT1 or pGAL1-GAT2 plasmid, respectively. Importantly, viability of these strains indicates that the fusion proteins are functional. Culturing the yeast on galactose allowed for cell growth, but shifting these cells to glucose-containing medium (which suppresses transcription from the GAL1 promoter) resulted in cessation of cell growth. Compared to their isogenic wild type (2 h), dko-GAT1 and dko-GAT2 cells had a slower growth rate in rich medium containing galactose, with doubling times of 4 h and 6 h, respectively.
FIG. 6.
Characterization of gat1Δ gat2Δ double-knockout strains. (A) Strains simultaneously lacking GAT1 and GAT2 but maintained by using (pGAL1-GAT1-V5, URA3) dko-GAT1 or (pGAL1-GAT2-V5, URA3) dko-GAT2 were grown on media containing 2% galactose. Cultures were serial diluted and plated on galactose-defined medium lacking uracil (control) or same medium containing 5-fluoroorotic acid (5-FOA). (B, C) Isogenic wild-type strains transformed with the empty pYES-URA3 vector were used as a control. dko-GAT1 (B) or dko-GAT2 (C) cells were shifted to glucose-containing medium, and samples were collected at the indicated time points after the shift. (Top) Western blot analysis of 10 μg total protein analyzed for each time point. (Bottom) Percentage of viable cells during the time course, performed as indicated in Materials and Methods. A 55% and 38% reduction in the levels of Gat1p and Gat2p, respectively, was estimated 3 h after the shift (while cells are fully viable).
Gat1p and Gat2p were present in multiple bands at time zero and steadily declined after 6 h in glucose to very low levels and were no longer detected at 12 h. In the case of Gat2p, many proteolytic products were detected at time zero. Although dko-GAT1 and dko-GAT2 cells are in the process of dying (viability decreased to 40% after 8 h and 6 h of growth in glucose, respectively), they are fully viable 3 h after the shift, despite a significant reduction in the remaining levels of Gat1 and Gat2 proteins.
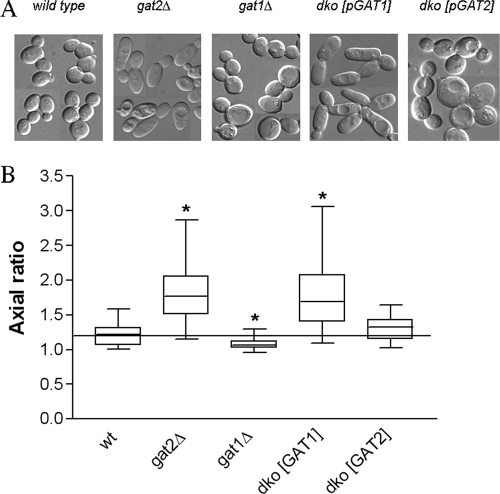
Surprisingly, the cell morphology of dko-GAT1 and dko-GAT2 yeast was strikingly different. Nomarski microscopy revealed that dko-GAT1 cells grown in rich medium containing galactose (which overexpressed Gat1p) were elongated, while dko-GAT2 cells (which overexpressed Gat2p) were more spherical (Fig. 7). These observations prompted us to analyze the phenotype of the single-knockout strains grown under the same conditions. Significant differences in axial ratio values calculated for gat1Δ and gat2Δ cells were found in comparison to that for their isogenic wild type grown in rich medium containing galactose (Fig. 7B). In agreement with the phenotypes displayed by the double-knockout strains, gat1Δ cells were round, while gat2Δ cells were elongated. The single-knockout cells displayed the same phenotypes when grown on glucose-containing medium (data not shown). Interestingly, all mutant strains were significantly larger than their isogenic wild type, regardless of their morphology. These phenotypes were very evident in cells derived from the W303 background, although overexpression of Gat1p or Gat2p in wild-type strain BY4741 showed a similar trend (see Fig. S2 in the supplemental material). It is worth noting that both wild-type strains become more elongated when grown on galactose in defined medium, making the analysis more difficult.
FIG. 7.
Differential contribution of Gat1p and Gat2p to polarized cell growth. (A) Transmission images showing the cell morphology of double-knockout strains dko-GAT1 and dko-GAT2 as well as the gat1Δ and gat2Δ single-deletion strains and their isogenic wild type (W303). At least 50 cells from each strain were processed, as indicated in Materials and Methods, to measure cell length and width. (B) Box plot of the axial ratio distributions. The box plot shows the medians (central horizontal line) with the 25th and 75th percentiles (box). The bottom line coming out of the box ends at the 5th percentile, whereas the top one ends at the 95th percentile. An asterisk denotes significantly (P < 0.001) different distribution than that of the wild type (wt) (Dunnett's test, n ≥ 50).
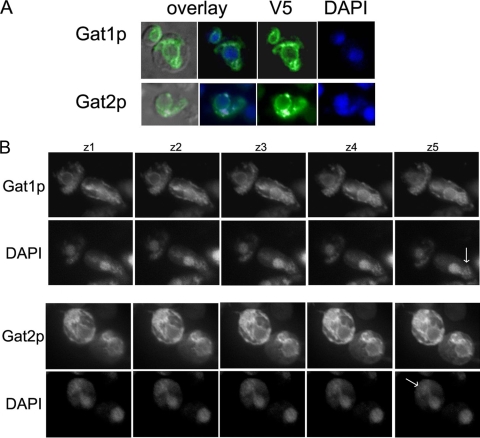
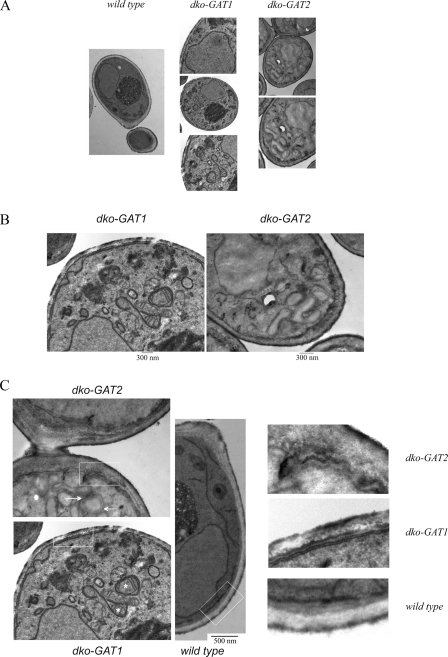
As previously seen with the GFP fusion proteins expressed at endogenous levels, GPATs in dko-GAT1 and dko-GAT2 cells were localized to the perinuclear and cortical ER. In addition, due to their overexpression, they were also present in a membranous mesh that was positive for DAPI staining, probably indicative of mitochondria (Fig. 8). Electron microscopy images of these cells supported this idea. Double-knockout cells overexpressing Gat1p were rich in mitochondria surrounded by a membrane array absent in wild-type cells. A different membrane arrangement that also resulted in grouping of mitochondria was observed in cells overexpressing Gat2p (Fig. 9A and B). One of the most striking differences between these cells was found when we took a closer look at the cortical ER. While dko-GAT1 cells had a normal cortical ER positioned underneath the plasma membrane, dko-GAT2 cells showed an irregular layout of membranes, with pronounced invaginations also affecting the plasma membrane morphology (Fig. 9C).
FIG. 8.
Excess Gat1p and Gat2p generate aberrant membranous arrays. (A, B) dko-GAT1 or dko-GAT2 strains were grown in liquid cultures containing galactose to mid-log phase. Cells were then fixed and processed for indirect immunofluorescence microscopy using anti-V5 antibodies. DAPI was used to detect DNA (nuclear and mitochondrial). (B) Z-stacks of 0.2 μm were sequentially imaged to analyze both signals in more detail. Notably, the aberrant membranous mesh observed in both cell types is also stained for DAPI (arrows).
FIG. 9.
Identification of distinct membranous arrays and cortical ER alterations in dko-GAT1 and dko-GAT2 cells by electron microscopy.(A) Comparison of wild-type, dko-GAT1, and dko-GAT2 representative cells analyzed by electron microscopy. All cells were grown in rich medium containing galactose. (B) Enlargement of a portion of dko-GAT1 and dko-GAT2 cells showing aberrant membranous arrangements compared to those of the wild-type cells. (C) Detailed analysis of the cortical ER in all strains analyzed shows altered PM and cortical ER structural morphology in dko-GAT2 cells. Boxes indicate the areas that have been enlarged on the right, asterisks denote mitochondria wrapped by ER in dko-GAT1 cells, and arrows point to dilated ER in dko-GAT2 cells.
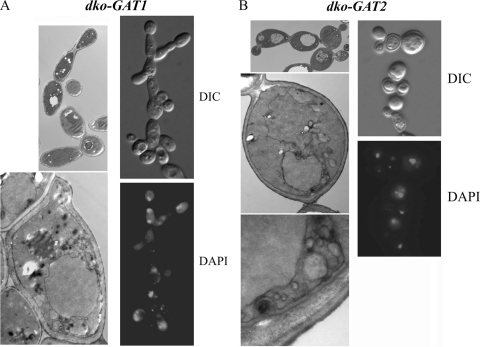
We then analyzed the morphology of the conditional double-knockout strains after 12 h of shifting them to glucose-containing medium. Interestingly, dko-GAT1 and dko-GAT2 cells are budded when they die (Fig. 10A and B). Their morphology was different and this would be expected due to the remarkable differences in cell morphology already displayed by these strains at the start point of the shift to glucose. Both mutant strains exhibited defects in cell separation, resulting in the display of a clumpy morphology when dead. Pseudohyphal clusters of cells were often observed in dko-GAT1, while grape-like clusters were observed in dko-GAT2.
FIG. 10.
Cell death caused by complete depletion of GPATs results in multibudded cells. dko-GAT1 (A) and dko-GAT2 (B) strains were grown in rich medium containing galactose and then shifted to glucose for 12 h. Cells were briefly sonicated in order to separate them, and differential interference contrast (DIC) images were taken in order to analyze their cell morphology. Multibudded cells were detected for both dko-GAT1 and dko-GAT2 cells. Nuclei were visualized with DAPI. The multibudded phenotype was also captured in electron microscopy images of these dead cells. Multiple vesicles surrounding their nuclei were often observed.
Examination of these multibudded cells stained with DAPI to visualize nuclear DNA indicated nuclear division was completed in >90% of the cells, although most cells displayed pyknotic, fragmented nuclei, resembling apoptotic phenotypes (Fig. 10A-B). These results indicate the complete lack of GPAT results in cell death, affecting mostly postcytokinesis events that lead to cell separation. EM analysis of these dead cells showed cytoplasmic vacuolization frequently surrounding the nuclear envelope (Fig. 10).
In summary, excess Gat1p results in elongated cells, while excess Gat2p results in larger and round cells. On the other hand, the complete lack of GPAT results in cell death, with multibudded cells containing divided nuclei. All together, these results point to a critical contribution of GPATs to the morphogenesis/polarity checkpoint and cell separation.
DISCUSSION
The mechanisms of the regulation of PA biosynthesis, of the rate-limiting GPAT step, and of lipid metabolic pathway partitioning are not known. It has been generally accepted that glycerolipid biosynthetic pathways diverge at the level of PA metabolism to DAG or CDP-DAG. Our work on yeast Gat1p and Gat2p indicated that a significant partitioning of membrane biosynthetic pathways occurs at the initial GPAT-catalyzed step of lipid synthesis (32, 34). Likely, localization of Gat1p and Gat2p contributes to their metabolic partitioning. Thus, the first aim of this work was to carefully define the subcellular localization of these enzymes. Furthermore, since gene dosage is a powerful approach to studying Gat1p and Gat2p function, we extended our localization studies to cells depleted of one GPAT, or cells simultaneously lacking endogenous Gat1p and Gat2p, but maintained it by using the GAL1 galactose-inducible promoter to drive GAT1 or GAT2 expression. The data obtained from cells expressing endogenous levels of Gat1p or Gat2p presented in this study indicate that although Gat1p and Gat2p are both localized to the perinuclear ER as well as the cortical ER in exponentially growing cells, inspection of their distribution in sucrose density gradients strongly suggests that these proteins are enriched in distinct subdomains of the ER. Further evidence in support of this conclusion is that immunoaffinity precipitation of endogenous (10, 19) as well as overexpressed Gat1p or Gat2p (our unpublished results), followed by mass spectroscopy analysis, failed to detect the other GPAT in the precipitate, while other specific ER resident proteins were identified. Most importantly, our study unveiled a coordinated regulation between these two acylation systems, with two lines of evidence supporting this finding. First, in vivo imaging combined with subcellular fractionation analysis using sucrose density gradients of cells expressing Gat2p fused to GFP revealed changes in its ER localization and gradient distribution when Gat1p was missing. Second, Gat1p and Gat2p were basally phosphorylated in wild-type cells, but their phosphorylation status changed according to their own protein level and that of the other GPAT. In general, we noticed Gat1p and Gat2p are hyperphosphorylated when the proteins are in excess (overexpression), while they are less or not phosphorylated when there is a GPAT deficit. To our knowledge, no such regulation has been described previously for these enzymes in yeast or other organisms.
Recently, the mammalian mitochondrial GPAT (mtGPAT1) has been shown to be regulated posttranslationally via phosphorylation of residues Ser 632 and Ser 639 in its C-terminal end (3), but the physiological relevance of these phosphorylation events remains unknown. Results from tandem mass spectrometry phosphoresidue analysis of yeast GPATs also indicate that Gat1p and Gat2p are phosphorylated in their C-terminal ends (our unpublished results). Our results do not clarify, however, whether phosphorylation regulates GPAT localization. No obvious differences in distribution of Gat1p- or Gat2p-phosphorylated species were detected in the sucrose density gradients analyzed for this study. This possibility will need to be addressed using monospecific Gat1p and Gat2p antibodies raised against phosphoresidues and immunomicroscopic analysis of their localization. Alternatively, phosphorylation may affect activity and/or half-life of the proteins. Interestingly, hyperphosphorylation of the yeast GPATs due to high levels of expression seems to be independent of their activity, since Gat1p and Gat2p mutants predicted to be catalytically dead (14) showed the same phosphorylation status as wild-type proteins (data not shown). These results suggest that the signaling events leading to phosphorylation of these enzymes are not directly mediated by signaling lipids generated downstream of the reaction they catalyze.
GAT1 and GAT2 represent a duplicate gene pair that was originated from a whole genome duplication event in the S. cerevisiae lineage 100 million years ago (6). It has been proposed that in order to persist in time, the two duplicate copies must lose full redundancy either by having at least one of the duplicate copies gain a new function or by partitioning the ancestral function (27). Redundancy of GPATs is even higher in multicellular organisms. Do the various isoforms have distinct functions? Mammalian GPAT1, -2, and -3 have been shown to function mainly in triacylglycerol synthesis (12), and just recently, GPAT4 has been found to be different, as it is a major contributor of phospholipid biosynthesis (7, 24). With the goal of learning more about the scope of cellular processes regulated by each GPAT, we explored the effect that overexpression of Gat1p or Gat2p had on the extreme case of cells lacking endogenous GPATs. Gat1p and Gat2p are predicted to be transmembrane enzymes, but unlike overexpression of Hmg1p, they do not form arrays of membranes around the nucleus (known as karmellae) in order to accommodate the excess of protein, when overexpressed (17, 31). Instead, a unique ER arrangement for dko-GAT1 or dko-GAT2 cells was observed at the ultrastructural level (Fig. 9C and D). These arrays frequently enclosed or grouped mitochondria, explaining the DAPI stain trapped in the membranous mesh detected by immunofluorescence microscopy of Gat1p and Gat2p. It will be interesting to study how Gat1p and Gat2p affect mitochondrial lipid synthesis, composition, and function. In fact, growth of these dko strains on galactose, a semifermentative carbon source, is abnormally slow compared to that of its isogenic wild type.
Interestingly, gat1Δ gat2Δ double-knockout cells overexpressing Gat1p or Gat2p (grown on galactose) show remarkable morphological differences. Elongated cells were the hallmark of dko-GAT1 strains, while large and round cells were the predominant morphology of dko-GAT2 cells. Analysis of gat1Δ or gat2Δ single-deletion strains grown on galactose showed morphological characteristics of dko-GAT2 and dko-GAT1 strains, respectively. Importantly, we did not detect defects in nuclear division. Thus, we propose the imbalance in Gat1p and Gat2p levels in these cells affects the morphogenesis checkpoint, producing a delay in the apical isotropic switch (elongated cells) or rushing through it (larger and rounder cells). It is worth noting that these phenotypes were clearly observed in strains derived from the W303 background but not in BY4741-derived deletion strains. Overexpression of Gat1p or Gat2p in wild-type BY4741 cells showed the same morphological trend when grown on galactose, but the phenotype was not as obvious. This strain-dependent difference in cell morphology could be due to the known polymorphism at the SSD1 locus between these two strains (30). In addition, W303 has a bud4 mutation, and both Bud4p and Ssd1p have been shown to have profound effects on the yeast morphogenesis network (30). We have not yet explored possible genetic interactions between GAT1 and GAT2 with these genes.
Despite the differences between genetic backgrounds, our results show unique phenotypes when an important imbalance in Gat1p and Gat2p was induced. A major structural difference between the two dko strains was found with the cortical ER morphology. In the case of dko-GAT2 cells, the cortical ER was very irregular and also affected the PM organization, presenting frequent invaginations with multilayered membranous structures. Cortical ER inheritance has been shown to be required for normal septin organization and polarized growth (21). It is possible that alterations in the cortical ER observed in dko-GAT1 and dko-GAT2 cells differentially affect ER compartmentalization and, consequently, cell polarity. This effect on the PM and cortical ER could also explain the change in the equilibrium distribution observed for Pma1p when Gat2p was the only GPAT present in the cell. A synthetic sick interaction between a deletion of GAT2 and a PMA1 allele that yields reduced levels of this essential protein (DAmP strain) has been described previously (28), further supporting a role of the acyltransferase in Pma1p localization and/or function.
Lastly, the complete lack of GPATs causes cell death, with multibudded cells containing a nucleus. In fact, we have the impression that these cells have recycled their organelles' membranes through an autophagy-like process in order to feed and maintain their nuclear envelopes, as judged by the electron microscopy images of these cells showing multivesiculated arrangements decorating the nuclear envelope surroundings. This terminal phenotype could be indicative of problems in postcytokinesis processes that lead to cell separation. We do not know at this point if it is related to a cell cycle defect or a deficiency in the delivery of degradative enzymes to the cell wall.
Together, these findings have several interesting implications. They uncover a mechanism of cellular compensation in response to abnormalities in the first step of acylation, forming LysoPA that impacts not only lipid metabolism but other cellular processes that are coupled to it, like polarized cell growth and cell separation. Future efforts will focus on understanding the contribution of each GPAT to these processes. They include identification of phosphoresidues in Gat1p and Gat2p as well as the signaling pathway(s) involved in their phosphorylation. In addition, the molecular mechanisms underlying distinct contributions of Gat1p and Gat2p to the formation of ER subdomains and their protein composition are the subject of future investigations.
Supplementary Material
Acknowledgments
This work was supported by an operating grant from the National Sciences and Engineering Research Council (NSERC), a University Faculty Award from NSERC (to V.Z.), URGC (University of Calgary) and Undergraduate Student Research Awards from NSERC (to J.F.C., D.P.B., and A.L.A.).
We thank Ramón Serrano and Gûnther Daum for their kind gifts of antibodies. The thoughtful comments of Gabriel Bertolesi as well as the members of the Calgary Yeast Research Group are gratefully acknowledged.
Footnotes
Published ahead of print on 12 June 2009.
Supplemental material for this article may be found at http://ec.asm.org/.
REFERENCES
- 1.Athenstaedt, K., and G. Daum. 1997. Biosynthesis of phosphatidic acid in lipid particles and endoplasmic reticulum of Saccharomyces cerevisiae. J. Bacteriol. 1797611-7616. [DOI] [PMC free article] [PubMed] [Google Scholar]
- 2.Athenstaedt, K., S. Weys, F. Paltauf, and G. Daum. 1999. Redundant systems of phosphatidic acid biosynthesis via acylation of glycerol-3-phosphate or dihydroxyacetone phosphate in the yeast Saccharomyces cerevisiae. J. Bacteriol. 1811458-1463. [DOI] [PMC free article] [PubMed] [Google Scholar]
- 3.Bronnikov, G. E., N. Aboulaich, A. V. Vener, and P. Stralfors. 2008. Acute effects of insulin on the activity of mitochondrial GPAT1 in primary adipocytes. Biochem. Biophys. Res. Commun. 367201-207. [DOI] [PubMed] [Google Scholar]
- 4.Cao, J., J. L. Li, D. Li, J. F. Tobin, and R. E. Gimeno. 2006. Molecular identification of microsomal acyl-CoA:glycerol-3-phosphate acyltransferase, a key enzyme in de novo triacylglycerol synthesis. Proc. Natl. Acad. Sci. USA 10319695-19700. [DOI] [PMC free article] [PubMed] [Google Scholar]
- 5.Carman, G. M., and S. A. Henry. 2007. Phosphatidic acid plays a central role in the transcriptional regulation of glycerophospholipid synthesis in Saccharomyces cerevisiae. J. Biol. Chem. 28237293-37297. [DOI] [PMC free article] [PubMed] [Google Scholar]
- 6.Casaregola, S., A. Lepingle, E. Bon, C. Neuveglise, H. Nguyen, F. Artiguenave, P. Wincker, and C. Gaillardin. 2000. Genomic exploration of the hemiascomycetous yeasts: 7. Saccharomyces servazzii. FEBS Lett. 48747-51. [DOI] [PubMed] [Google Scholar]
- 7.Chen, Y. Q., M. S. Kuo, S. Li, H. H. Bui, D. A. Peake, P. E. Sanders, S. J. Thibodeaux, S. Chu, Y. W. Qian, Y. Zhao, D. S. Bredt, D. E. Moller, R. J. Konrad, A. P. Beigneux, S. G. Young, and G. Cao. 2008. AGPAT6 is a novel microsomal glycerol-3-phosphate acyltransferase. J. Biol. Chem. 28310048-10057. [DOI] [PMC free article] [PubMed] [Google Scholar]
- 8.Coleman, R. A. 2007. How do I fatten thee? Let me count the ways. Cell Metab. 587-89. [DOI] [PMC free article] [PubMed] [Google Scholar]
- 9.Estrada, P., J. Kim, J. Coleman, L. Walker, B. Dunn, P. Takizawa, P. Novick, and S. Ferro-Novick. 2003. Myo4p and She3p are required for cortical ER inheritance in Saccharomyces cerevisiae. J. Cell Biol. 1631255-1266. [DOI] [PMC free article] [PubMed] [Google Scholar]
- 10.Gavin, A. C., M. Bosche, R. Krause, P. Grandi, M. Marzioch, A. Bauer, J. Schultz, J. M. Rick, A. M. Michon, C. M. Cruciat, M. Remor, C. Hofert, M. Schelder, M. Brajenovic, H. Ruffner, A. Merino, K. Klein, M. Hudak, D. Dickson, T. Rudi, V. Gnau, A. Bauch, S. Bastuck, B. Huhse, C. Leutwein, M. A. Heurtier, R. R. Copley, A. Edelmann, E. Querfurth, V. Rybin, G. Drewes, M. Raida, T. Bouwmeester, P. Bork, B. Seraphin, B. Kuster, G. Neubauer, and G. Superti-Furga. 2002. Functional organization of the yeast proteome by systematic analysis of protein complexes. Nature 415141-147. [DOI] [PubMed] [Google Scholar]
- 11.Ghaemmaghami, S., W. K. Huh, K. Bower, R. W. Howson, A. Belle, N. Dephoure, E. K. O'Shea, and J. S. Weissman. 2003. Global analysis of protein expression in yeast. Nature 425737-741. [DOI] [PubMed] [Google Scholar]
- 12.Gimeno, R. E., and J. Cao. 2008. Mammalian glycerol-3-phosphate acyltransferases: new genes for an old activity. J. Lipid Res. 492079-2088. [DOI] [PubMed] [Google Scholar]
- 13.Guthrie, C., and G. R. Fink. 1991. Guide to yeast genetics and molecular biology. Academic Press, San Diego, CA.
- 14.Han, G. S., L. O'Hara, G. M. Carman, and S. Siniossoglou. 2008. An unconventional diacylglycerol kinase that regulates phospholipid synthesis and nuclear membrane growth. J. Biol. Chem. 28320433-20442. [DOI] [PMC free article] [PubMed] [Google Scholar]
- 15.Howe, A. G., V. Zaremberg, and C. R. McMaster. 2002. Cessation of growth to prevent cell death due to inhibition of phosphatidylcholine synthesis is impaired at 37 degrees C in Saccharomyces cerevisiae. J. Biol. Chem. 27744100-44107. [DOI] [PubMed] [Google Scholar]
- 16.Kaiser, C. A., E. J. Chen, and S. Losko. 2002. Subcellular fractionation of secretory organelles. Methods Enzymol. 351325-338. [DOI] [PubMed] [Google Scholar]
- 17.Koning, A. J., C. J. Roberts, and R. L. Wright. 1996. Different subcellular localization of Saccharomyces cerevisiae HMG-CoA reductase isozymes at elevated levels corresponds to distinct endoplasmic reticulum membrane proliferations. Mol. Biol. Cell 7769-789. [DOI] [PMC free article] [PubMed] [Google Scholar]
- 18.Kooijman, E. E., V. Chupin, B. de Kruijff, and K. N. Burger. 2003. Modulation of membrane curvature by phosphatidic acid and lysophosphatidic acid. Traffic 4162-174. [DOI] [PubMed] [Google Scholar]
- 19.Krogan, N. J., G. Cagney, H. Yu, G. Zhong, X. Guo, A. Ignatchenko, J. Li, S. Pu, N. Datta, A. P. Tikuisis, T. Punna, J. M. Peregrin-Alvarez, M. Shales, X. Zhang, M. Davey, M. D. Robinson, A. Paccanaro, J. E. Bray, A. Sheung, B. Beattie, D. P. Richards, V. Canadien, A. Lalev, F. Mena, P. Wong, A. Starostine, M. M. Canete, J. Vlasblom, S. Wu, C. Orsi, S. R. Collins, S. Chandran, R. Haw, J. J. Rilstone, K. Gandi, N. J. Thompson, G. Musso, P. St Onge, S. Ghanny, M. H. Lam, G. Butland, A. M. Altaf-Ul, S. Kanaya, A. Shilatifard, E. O'Shea, J. S. Weissman, C. J. Ingles, T. R. Hughes, J. Parkinson, M. Gerstein, S. J. Wodak, A. Emili, and J. F. Greenblatt. 2006. Global landscape of protein complexes in the yeast Saccharomyces cerevisiae. Nature 440637-643. [DOI] [PubMed] [Google Scholar]
- 20.Lewin, T. M., N. M. Schwerbrock, D. P. Lee, and R. A. Coleman. 2004. Identification of a new glycerol-3-phosphate acyltransferase isoenzyme, mtGPAT2, in mitochondria. J. Biol. Chem. 27913488-13495. [DOI] [PubMed] [Google Scholar]
- 21.Loewen, C. J., B. P. Young, S. Tavassoli, and T. P. Levine. 2007. Inheritance of cortical ER in yeast is required for normal septin organization. J. Cell Biol. 179467-483. [DOI] [PMC free article] [PubMed] [Google Scholar]
- 22.Lowry, O. H., N. J. Rosebrough, A. L. Farr, and R. J. Randall. 1951. Protein measurement with the Folin phenol reagent. J. Biol. Chem. 193265-275. [PubMed] [Google Scholar]
- 23.McMaster, C. R. 2001. Lipid metabolism and vesicle trafficking: more than just greasing the transport machinery. Biochem. Cell Biol. 79681-692. [DOI] [PubMed] [Google Scholar]
- 24.Nagle, C. A., L. Vergnes, H. Dejong, S. Wang, T. M. Lewin, K. Reue, and R. A. Coleman. 2008. Identification of a novel sn-glycerol-3-phosphate acyltransferase isoform, GPAT4, as the enzyme deficient in Agpat6-/- mice. J. Lipid Res. 49823-831. [DOI] [PMC free article] [PubMed] [Google Scholar]
- 25.Roberg, K. J., N. Rowley, and C. A. Kaiser. 1997. Physiological regulation of membrane protein sorting late in the secretory pathway of Saccharomyces cerevisiae. J. Cell Biol. 1371469-1482. [DOI] [PMC free article] [PubMed] [Google Scholar]
- 26.Sambrook, J., and D. W. Russell. 2001. Molecular cloning: a laboratory manual, 3rd ed. Cold Spring Harbor Laboratory Press, Cold Spring Harbor, NY.
- 27.Scannell, D. R., A. C. Frank, G. C. Conant, K. P. Byrne, M. Woolfit, and K. H. Wolfe. 2007. Independent sorting-out of thousands of duplicated gene pairs in two yeast species descended from a whole-genome duplication. Proc. Natl. Acad. Sci. USA 1048397-8402. [DOI] [PMC free article] [PubMed] [Google Scholar]
- 28.Schuldiner, M., S. R. Collins, N. J. Thompson, V. Denic, A. Bhamidipati, T. Punna, J. Ihmels, B. Andrews, C. Boone, J. F. Greenblatt, J. S. Weissman, and N. J. Krogan. 2005. Exploration of the function and organization of the yeast early secretory pathway through an epistatic miniarray profile. Cell 123507-519. [DOI] [PubMed] [Google Scholar]
- 29.van Meer, G., D. R. Voelker, and G. W. Feigenson. 2008. Membrane lipids: where they are and how they behave. Nat. Rev. Mol. Cell Biol. 9112-124. [DOI] [PMC free article] [PubMed] [Google Scholar]
- 30.Voth, W. P., A. E. Olsen, M. Sbia, K. H. Freedman, and D. J. Stillman. 2005. ACE2, CBK1, and BUD4 in budding and cell separation. Eukaryot. Cell 41018-1028. [DOI] [PMC free article] [PubMed] [Google Scholar]
- 31.Wright, R., M. Basson, L. D'Ari, and J. Rine. 1988. Increased amounts of HMG-CoA reductase induce “karmellae”: a proliferation of stacked membrane pairs surrounding the yeast nucleus. J. Cell Biol. 107101-114. [DOI] [PMC free article] [PubMed] [Google Scholar]
- 32.Zaremberg, V., and C. R. McMaster. 2002. Differential partitioning of lipids metabolized by separate yeast glycerol-3-phosphate acyltransferases reveals that phospholipase D generation of phosphatidic acid mediates sensitivity to choline-containing lysolipids and drugs. J. Biol. Chem. 27739035-39044. [DOI] [PubMed] [Google Scholar]
- 33.Zheng, Z., Q. Xia, M. Dauk, W. Shen, G. Selvaraj, and J. Zou. 2003. Arabidopsis AtGPAT1, a member of the membrane-bound glycerol-3-phosphate acyltransferase gene family, is essential for tapetum differentiation and male fertility. Plant Cell 151872-1887. [DOI] [PMC free article] [PubMed] [Google Scholar]
- 34.Zheng, Z., and J. Zou. 2001. The initial step of the glycerolipid pathway: identification of glycerol 3-phosphate/dihydroxyacetone phosphate dual substrate acyltransferases in Saccharomyces cerevisiae. J. Biol. Chem. 27641710-41716. [DOI] [PubMed] [Google Scholar]
Associated Data
This section collects any data citations, data availability statements, or supplementary materials included in this article.


