

Abstract
We generated a line of mice in which sterol regulatory element binding protein 1a (SREBP-1a) was specifically inactivated by insertional mutagenesis. Homozygous mutant mice were completely viable despite expressing SREBP-1a mRNA below 5% of normal, and there were minimal effects on expression of either SREBP-1c or -2. Microarray expression studies in liver, where SREBP-1a mRNA is 1/10 the level of the highly similar SREBP-1c, demonstrated that only a few genes were affected. The only downregulated genes directly linked to lipid metabolism were Srebf1 (which encodes SREBP-1) and Acacb (which encodes acetyl coenzyme A [acetyl-CoA] carboxylase 2 [ACC2], a critical regulator of fatty acyl-CoA partitioning between cytosol and mitochondria). ACC2 regulation is particularly important during food restriction. Similar to Acacb knockout mice, SREBP-1a-deficient mice have lower hepatic triglycerides and higher serum ketones during fasting than wild-type mice. SREBP-1a and -1c have identical DNA binding and dimerization domains; thus, the failure of the more abundant SREBP-1c to substitute for activating hepatic ACC2 must relate to more efficient recruitment of transcriptional coactivators to the more potent SREBP-1a activation domain. Our chromatin immunoprecipitation results support this hypothesis.
Sterol regulatory element binding proteins (SREBPs) are transcriptional regulatory proteins that activate lipid metabolic genes in eukaryotic organisms. While there is a single SREBP gene that expresses a single protein isoform in species from fission yeast to insects, two distinct genes, SREBF1 and SREBF2, are present in humans and other mammals (9). Although forced overexpression and gene-targeting studies indicate that SREBF-1 and SREBF-2 are preferentially associated with the activation of genes for fatty acid or cholesterol biosynthesis, respectively, the differential roles for the two major SREBF1 isoforms, SREBP-1a and SREBP-1c, require further study. The two SREBP-1 proteins are identical aside from amino-terminal domains encoded by alternate first exons of the gene. SREBP-1c lacks critical residues (relative to SREBP-1a) that mediate efficient interaction with CBP/p300 and the RNA polymerase II mediator complex, so the two proteins differ only in their ability to recruit coactivator proteins to stimulate transcription after DNA binding (20). Both SREBP-1 transcripts are ubiquitously expressed; however, the ratio varies over a 100-fold range in different tissues (18).
An engineered deletion at the Srebf1 locus that targets both SREBP-1 isoforms simultaneously in mice, results in significant embryonic lethality and most mice die at embryonic day 10, but ∼15% of the mutant mice survive. Interestingly, all of the survivors display increased SREBP-2 expression, suggesting that SREBP-1 is required for viability but that elevated levels of SREBP-2 can compensate for the loss of all SREBP-1 (17). Inactivating SREBP-2 in mice results in 100% lethality at a very early stage of embryonic development (10).
Mice deficient in only SREBP-1c survive development and are overtly normal (11). However, the reactivation of most lipogenic genes in the liver in response to a high carbohydrate feeding after a fast was severely blunted, confirming that while not essential for viability, SREBP-1c is a key activator of the entire hepatic lipogenic gene program (11).
To complete the collection of SREBP knockout models, we developed a line of mice with a deficiency of SREBP-1a. These mice were generated from a mutant line of mouse embryonic stem (ES) cells that contains a β-galactosidase-neomycin phosphotransferase fusion protein (β-geo) insertion in the intron downstream from the unique 5′ exon of SREBP-1a. These mice, referred to hereafter as 1a-deficient mice (1aDf), have markedly reduced expression of SREBP-1a but no defect in the expression of SREBP-1c or SREBP-2. The 1aDf mice survive embryonic development and are basically healthy and fertile.
Using a mRNA microarray approach to compare of hepatic gene expression in wild-type versus 1aDf mice, we show here that the expression of only a few genes is perturbed in the mutant mice. Of the downregulated genes, Acacb was the only one, aside from Srebf1 itself, known to be involved in lipid metabolism. The protein encoded by Acacb, acetyl coenzyme A (acetyl-CoA)-carboxylase 2 (ACC2), converts acetyl-CoA into malonyl-CoA and, due to its mitochondrial membrane association, ACC2 has been hypothesized to play a key role in regulating fatty acid uptake and subsequent oxidation in mitochondria through the carnitine palmitoyl/acyltransferase 1 system (CPT-1). In support of this hypothesis, Acacb knockout mice display the predicted increase in fatty acid oxidation in the liver, especially during fasting when ACC2-deficient mice fail to properly regulate the storage of excess fatty acids as liver triglyceride (1). Interestingly, the SREBP-1a knockout mouse displays a similar defect in liver fat metabolism that is more apparent upon prolonged fasting.
This finding indicates that hepatic activity of ACC2 is dependent on the expression of SREBP-1a. Given that the two SREBP-1 isoforms have identical DNA binding and dimerization domains, the reason that the more abundant SREBP-1c cannot substitute for SREBP-1a in ACC2 activation in the liver must relate to the more potent activation domain in SREBP-1a. We also report chromatin immunoprecipitation (ChIP) results that support this hypothesis.
MATERIALS AND METHODS
1aDf mice.
A mouse ES cell line (XC354, strain 129/Ola) containing an insertional mutation in Srebf1 was identified in the BayGenomics collection of mutant ES lines (19). The gene-trap vector used by BayGenomics (pGT1TMpfs) contains a strong splice-acceptor sequence followed by a β-geo cassette (a fusion of β-galactosidase and neomycin phosphotransferase II) (19). The insertional mutagenesis event in cell line XC354 occurred in the intron sequences downstream from the first coding exon of SREBP-1a. This event resulted in the production of a fusion transcript between the unique first exon of SREBP-1a and β-geo and thus prevented the production of a full-length SEREBP-1a transcript. The gene-trapping event was documented by DNA sequencing of a cDNA fragment prepared by 5′ rapid amplification of cDNA ends (21).
XC354 cells were injected into C57BL/6 blastocysts to generate chimeric mice, which were bred to establish SREBP-1a knockout mice. Mice were genotyped first by using a Southern blotting protocol and then a differential PCR assay was established as diagrammed in Fig. 1). Mice with a mixed genetic background (50% C57BL/6 and 50% 129/Ola) were bred as heterozygotes, and offspring were genotyped and used for experiments. We also established a line by backcrossing the insertion mutation onto a pure C57BL/6 strain for eight generations. Both wild-type and homozygous gene-targeted lines were established after backcrossing. We performed experiments described here with both the mixed-background and the backcrossed lines and observed no significant differences in any of the parameters measured in both lines.
FIG. 1.
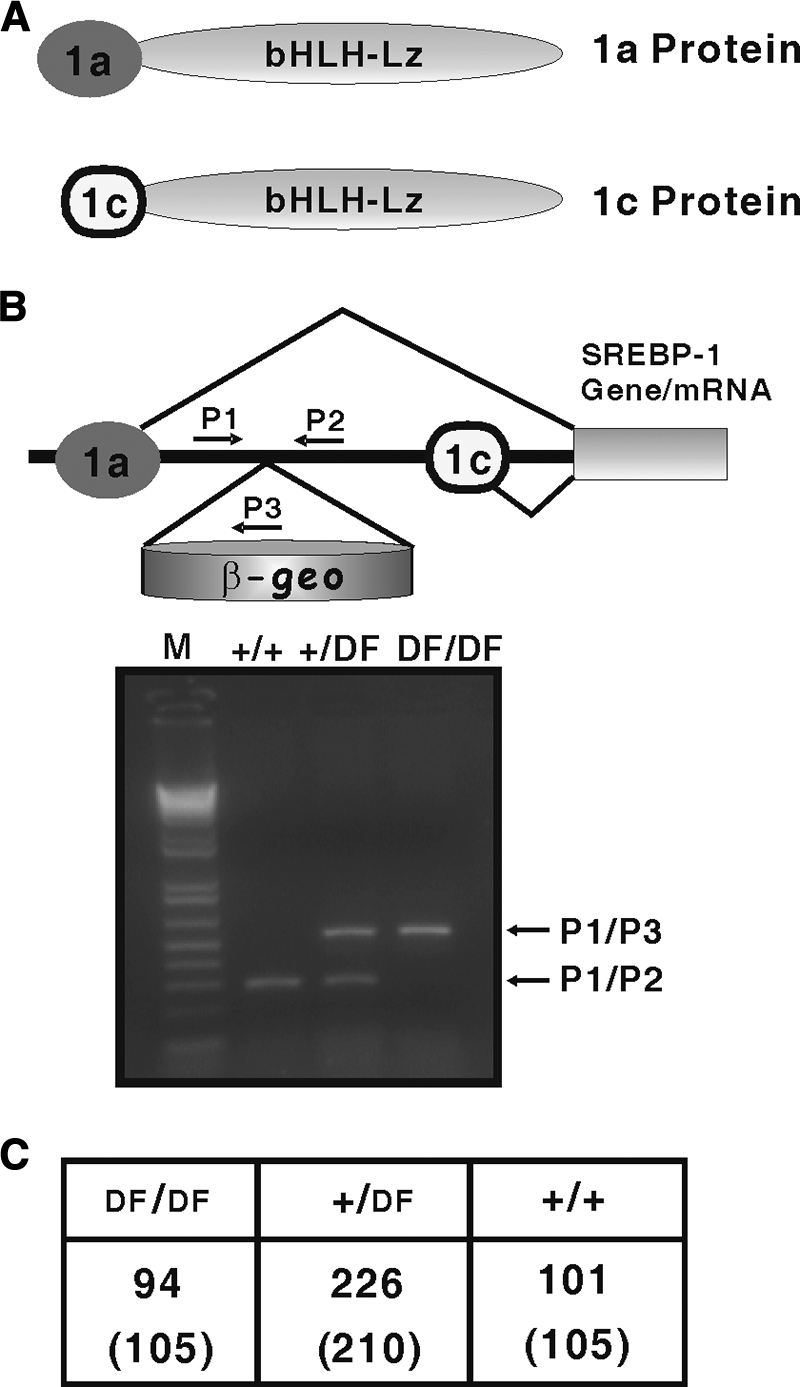
Gene structure of the two SREBP-1 isoforms (SREBP-1a and SREBP-1c) and generation of SREBP-1a deficient mice. (A) Schematic diagram of SREBP-1a and SREBP-1c, indicating that the only difference is with different amino-terminal domains. (B) The β-geo gene-trap cassette was located between the unique 5′ first exons for SREBP-1a and SREBP-1c, as described in Materials and Methods. PCR genotyping, using the indicated oligonucleotide primers, yielded 120-bp fragments for wild-type alleles (+/+) and 750-bp fragments for targeted (DF/DF) alleles. (C) Frequency of different genotypes in the offspring of heterozygous offspring. Littermates were genotyped over a 2-year period. The first row reflects the actual number of viable mice by genotype. The second row reflects the theoretical number of mice for each group based on Mendelian genetics.
The mice were weaned at 21 days of age, housed with a 12-h light/12-h dark cycle, and fed a rodent chow diet (Harlan Teklad catalog no. 2920X). The mice were weaned at 21 days of age. At 6 to 8 weeks of age, mice were separated into three groups of six animals each. For the fasting group, animals were fasted 24 h. For the refeeding group, animals were fasted 24 h and then refed with a high-carbohydrate diet (Harlan Teklad catalog no. TD88122) for 12 h. Each group was set up in a staggered fashion so that all animals were sacrificed at the end of the dark cycle (8 a.m.) on the same day.
Microarray expression profiling and Cyber-T analysis.
Six- to 8-week-old mice (15 wild type and 15 1aDf) were maintained on a normal chow diet as described above and sacrificed at the end of the dark cycle. Total RNA was prepared from each mouse separately, and equal amounts from five different individuals were pooled together into three samples from each genotype. Approximately 500 ng of RNA from each pool was used to hybridize to a separate microarray slide covering the entire mouse transcriptome (Mouse Gene 1.0 ST Array GeneChips; Affymetrix) at the UCI microarray facility. The results for the triplicate chips were analyzed by GeneChip operating software (Affymetrix) and GeneSpring software (Agilent Technologies). The data were further analyzed by the Cyber-T statistical analysis program (http://cybert.microarray.ics.uci.edu) to determine significance and confidence for differential levels of expressed genes (3). For statistical and biological significance, we set the posterior probability of differential expression at >0.95 and fold change at 1.5.
RNA isolation and real-time quantitative RT-PCR.
Total RNA was isolated from livers of wild-type and 1aDf mice after the Trizol method (Invitrogen). cDNA was synthesized by cDNA superscript kit (Bio-Rad) and used for quantitative reverse transcription-PCR (RT-PCR) with an iQ5 real-time PCR detection system (Bio-Rad). mRNA levels were normalized for expression of ribosomal protein L32 mRNA as a control and calculated by the comparative threshold cycle method. Plasmids containing partial cDNAs for SREBP-1a, -1c, and -2 that encompass the oligonucleotides used for PCR were isolated and the purified DNA was quantified by A260. Serial dilutions of the plasmid DNAs were included in each quantitative PCR (qPCR) analysis for use as a standard curve for quantitation. All qPCR reactions were repeated in triplicate. The qPCR primers pairs for Acacb were 5′-GGGCTCCCTGGATGACAAC-3′ and 5′-GCTCTTCCGGGAGGAGTTCT-3′. All other primer pairs have been described previously (4, 8).
Immunoblotting.
Proteins were prepared from fed, fast, and refed livers of wild-type and 1aDf mice. Tissues were washed with ice-cold phosphate-buffered saline (PBS) containing a mixture of protease inhibition cocktails (Sigma) and 2 μg of phenylmethylsulfonyl fluoride/ml to remove serum. Total proteins were resolved by 6 to 10% Tris-HCl sodium dodecyl sulfate-polyacrylamide gel electrophoresis (SDS-PAGE) and transferred onto nitrocellulose (Bio-Rad). ACC2 was detected using anti-ACC2 antibody (kindly provided by K. S. Kim) (14). Anti-α-tubulin was from Santa Cruz (B-7; SC-5286). All immunoblots were developed by using horseradish peroxidase-conjugated secondary antibody with an ECL detection system (GE Healthcare).
ChIP.
Equal portions of freshly isolated livers from three mice per group were pooled and placed in 40 ml of ice-cold PBS containing a mixture of protease inhibition cocktails (Sigma), 2 μg of phenylmethylsulfonyl fluoride/ml, 1 mM EDTA, and 1 mM EGTA. The tissue was disrupted in a Tissue-Mizer at the lowest setting, and dimethyl adipimidate (catalog no. 20660; Pierce) was added to a final concentration of 10 mM. The samples were rotated on a shaker at room temperature for 10 min. Formaldehyde was then added from a 37% stock (vol/vol) to a final concentration of 1%, and the samples were returned to the shaker for an additional 6 min. Glycine was added to a final concentration of 0.125 M, and the samples were then returned to the shaker for an additional 5 min. Cells were collected by centrifugation at 2,000 × g in a Sorval RC3B at 4°C. The cell pellet was washed once with homogenization buffer A (10 mM HEPES [pH 7.6], 25 mM KCl, 1 mM EDTA, 1 mM EGTA, 2 M sucrose, 10% glycerol, and 0.15 mM spermine plus the protease inhibitors as listed above). The final pellet was resuspended in buffer A and homogenized in a Dounce homogenizer with a B-pestle to release the nuclei. The solution was layered over buffer A and centrifuged in a Beckman ultracentrifuge for 1 h at 26,000 × g at 4°C. The nuclear pellet was resuspended in nuclear lysis buffer (1% SDS, 50 mM Tris [pH 7.6], 10 mM EDTA), and nuclei were disrupted by using an ultrasonic model W-220F sonicator, on a setting of five pulses for 10 s each to shear the chromatin. Chromatin size was checked by agarose electrophoresis to ensure that the average size was between 200 and 600 bp before we continued with the analysis. Aliquots were then used for immunoprecipitation experiments with an SREBP-1 antibody prepared against a recombinant fusion protein as described previously (11) or a commercial antibody to p300 (catalog no. 05-257; Millipore). ChIP samples were then processed as described previously (4, 8). Final DNA samples were analyzed by qPCR in triplicate. qPCR primers used for the mouse promoters were as follows: ACC2-SRE forward, 5′-GCAGGTAAGTAAGTGTGCTG-3′; ACC2-SRE reverse, 5′-GCCACCAGTTCCATTCTCAG-3′; FAS-SRE forward, 5′-ATCCTGGTCTCCAAGGTG-3′; FAS-SRE reverse 5′-TAGGCAATAGGGTGATGGG-3′; HMGCR forward, 5′-GCTCGGAGACCAATAGGA-3′; HMGCR reverse, 5′-CCGCCAATAAGGAAGGAT-3′; mUlk2 forward, 5′-TTACCATGGCTTTGTAATGC-3′; mUlk2 reverse, 5′-CCTAAGGGATAGGGTCTGAC-3′; L32 forward, 5′-ACATTTGCCCTGAATGTGGT-3′; and L32 reverse, 5′-ATCCTCTTGCCCTGACCTT-3′. The data were analyzed by using a Student t test and, unless noted otherwise in the individual figure legends, the pairwise comparisons were all significantly different with P values of <0.05.
Plasma analysis.
Blood from individual mice from the three groups (fed, fast, and refed) were collected into tubes coated with EDTA. Individual plasma obtained after centrifugation was analyzed for total cholesterol, triglycerides, β-hydroxybutyrate, free fatty acids, and glucose by using commercial kits (Stanbio Laboratories, Texas).
Measurements of hepatic triglycerides and cholesterol.
Hepatic triglyceride and cholesterol was measured by a modification of the method described before (6). Briefly, 100 mg of liver samples were homogenized in PBS (1 ml) by using a polytron homogenizer at 4°C and processed immediately for the measurements of triglycerides and cholesterol. Total lipids were extracted by using chloroform-methanol (2:1) for overnight at 4°C and dried under nitrogen gas and stored at −20°C until the measurement of the lipids. Dried lipid extracts were resuspended in 200 μl of ethanol, and the cholesterol and triglycerides were measured by using commercially available kits (Thermo Fisher Scientific, Virginia). These hepatic lipid data were normalized by liver weight.
Statistical analysis.
Three to five experiments of all studies were performed, using triplicate replications of each sample. The data are represented as means ± the standard deviations. All data sets were analyzed for statistical significance by using a two-tailed unpaired Student t test. All P values of <0.05 were considered significant. Statistical analysis was carried out by using Microsoft Excel (Microsoft).
RESULTS
SRBEP-1a-deficient mice are viable.
The mouse and other mammalian Srebf1 genes encode two major SREBP-1 isoforms that are identical except for their amino-terminal domains, which are encoded by alternate first exons (Fig. 1A). Because the unique 5′ exons are separated by a large intron, it is possible to inactivate one without altering the expression of the other. SREBP-1c was specifically targeted by deleting its unique first exon (11). To inactivate the 1a isoform, we took advantage of a mutant ES cell line from BayGenomics containing a β-geo gene-trap insertion within the intron separating the two alternate 5′ exons of Srebf1. This mutant allele produces a hybrid mRNA containing sequences from the unique SREBP-1a 5′ exon fused to sequences encoding β-geo (19), and the production of the fusion transcript is regulated by the SREBP-1a promoter and regulatory elements. The strong splice acceptor from the β-geo cassette suppresses splicing from exon 1 of SREBP-1a to exon 2 (which is common to SREBP-1a and -1c) (Fig. 1B). These ES cells were used to establish a mouse line, which was genotyped either with Southern blots or with a specific PCR genotyping protocol shown in Fig. 1B.
When heterozygous knockout mice were intercrossed, homozygotes were born at the predicted Mendelian frequency (data from >400 weaned mice, Fig. 1C). To determine how the insertional mutation affected SREBP gene expression, we analyzed RNA and protein from livers of adult animals by using qPCR and immunoblotting. Expression of each transcript was measured along with an appropriate standard curve, allowing for accurate comparisons of mRNA levels (Fig. 2). SREBP-1a RNA was significantly decreased in the homozygous 1aDf mice (KO in Fig. 2A). As expected, SREBP-1c was expressed at ∼10-fold higher absolute levels in wild-type liver mRNA, and there were no significant differences in 1c or SREBP-2 mRNA levels in wild-type and 1aDf mice.
FIG. 2.

Relative amounts of SREBP expression levels in livers of wild-type and 1aDf mice. Total RNA was isolated from individual wild-type and 1aDf mice livers (6- to 8-week-old male mice); equal amounts of RNA from each mouse were pooled and used for the quantitative RT-PCR assay. Gene expression level of SREBP-1a (A), SREBP-1c (B), and SREBP-2 (C) are shown as the quantitative expression levels calculated by comparison to qPCR values obtained with a standard curve of serially diluted linear plasmid cDNA. The data are plotted as femptograms of RNA normalized to ribosomal L32 samples analyzed in parallel. Bars represent the standard deviations. (D) SREBP-1 and 2 protein levels. Nuclear protein was prepared from the pooled livers of wild-type and 1aDf mice (n = 6, male). Aliquots (50 μg) of nuclear protein were size fractionated by SDS-PAGE and then electrophoretically transferred to a nitrocellulose filter. Immunoblot analysis was carried out with anti-SREBP-1 immunoglobulin G (IgG) or anti-SREBP-2 IgG as the primary antibody. *, P < 0.001, indicating a statistically significant difference between wild-type and 1aDf mice.
Because SREBP-1c is the major form of SRBEP-1 in the liver, total SREBP-1 protein levels did not change between genotypes, as determined by immunoblotting with hepatic nuclear extracts. There were also no differences in SREBP-2 protein levels. Thus, the β-geo insertion results in a decrease in SREBP-1a mRNA with no significant effects on hepatic SREBP-1c or -2. We have also compared SREBP mRNA expression in 12 other tissues in adult mice; and SREBP-1a mRNA levels in laDf mice are consistently <5% of wild-type levels (see Table S1 in the supplemental material), and there were no significant effects on SREBP-1c or -2 expression (not shown). These results indicate that a targeted knockdown of just SREBP-1a does not have any significant effect on viability.
ACC2 gene expression is regulated by SREBP-1a.
When SREBP target promoters are analyzed for activation by cotransfected SREBP expression vectors, SREBP-1a is more than 10- to 100-fold more active than SREBP-1c on a per molecule basis when transfected at limiting levels (7, 16, 20). This is due to their different activation domains, where SREBP-1a interacts strongly with coactivators, but SREBP-1c lacks the residues required for efficient interaction with these key components of the RNA polymerase II transcriptional apparatus (20). Thus, even though SREBP-1c is ∼10-fold more abundant than SREBP-1a in the liver, it is possible that SREBP-1a contributes significantly to overall hepatic SREBP-1 activity because of its more potent activation domain.
To determine whether expression of any hepatic genes might be sensitive to the loss of SREBP-1a, we compared hepatic gene expression in wild-type versus 1aDf animals by microarray profiling and found only a few genes whose expression was altered when assessed with a stringent statistical test (3) (Table 1) . In this analysis, a Bayesian statistical calculation in the Cyber-T program was used to improve the reliability and significance in the analysis of variance for individual genes (3). Of the genes affected, the only ones downregulated in the 1aDf livers that are known to be associated with lipid metabolism are Srebf1 itself and Acacb.
TABLE 1.
Microarray mRNA expression data from the liver of wild-type versus 1aDf mice
| Gene accession no. | Gene symbol | Fold expression | PPDEa |
|---|---|---|---|
| NM_178704 | Dpy19I3 | +1.75 | 0.9539 |
| NM_009720 | Atox1 | -1.6 | 0.9895 |
| NM_011480 | Srebf1 | -1.80 | 0.9984 |
| NM_133904 | Acacb | -1.86 | 0.9951 |
| NM_013881 | Ulk2 | -1.9 | 0.9998 |
| NM_00103609 | Tex24 | -2.29 | 0.9971 |
PPDE, posterior probability of differential expression.
Acacb encodes ACC2, which is critical for producing malonyl-CoA in proximity to the mitochondrial membrane where the CPT-1 shuttle transports long-chain fatty acids into the mitochondrion. This step is inhibited by malonyl-CoA and is considered to be rate-limiting for fatty acid oxidation.
To determine whether the microarray results accurately reflect hepatic Acacb expression levels, we analyzed Acacb, along with SREBPs and other SREBP target genes in fatty acid metabolism, by gene-specific qPCR with RNA from nine mice of each genotype. In this analysis, SREBP-1a and Acacb, were lower in the 1aDf animals but other tested lipid metabolic genes were unaffected (Fig. 3). We also compared expression of the other genes that were identified as differentially expressed genes in the microarray analysis (see Fig. S1 in the supplemental material). Expression differences for most of these were confirmed.
FIG. 3.

Relative mRNA expression levels in livers from wild-type and 1aDf mice. Total RNA was prepared individually from livers of nine wild-type and nine 1aDf mice (all 6- to 8-week-old males), and the mRNA expression levels were measured for key genes by qPCR as indicated. The data are plotted as the relative expression. SREBP-1a (A), SREBP-1c (B), SREBP-2 (C), FAS (Fasn) (D), ACC1 (Acaca) (E), and ACC2 (Acacb) (F) are represented by the fold change and normalized to an internal control (the L32 mRNA level).
Coactivator recruitment to the Acacb promoter is dependent on SREBP-1a.
A previous report documented that Acacb is regulated by SREBP-1 in the liver (14). However, unlike other known SREBP-1 target genes, our experiments indicate Acacb is uniquely dependent on hepatic SREBP-1a for efficient expression. Because both SREBP-1a and -1c have an identical DNA-binding domain and, because the total SREBP-1 protein levels are equivalent (Fig. 2), we predicted that SREBP-1 binding to the Acacb promoter would be similar in wild-type and 1aDf mice. We also predicted that because of the weak activation domain in SREBP-1c, coactivator recruitment and possibly histone acetylation predictive of active gene expression would be reduced in the 1aDf mice. This idea was tested by ChIP studies with liver chromatin prepared from both groups of mice. SREBP-1 recruitment to the Acacb promoter in liver DNA was indistinguishable in wild-type and 1aDf mice, but the recruitment of the p300 coactivator was reduced significantly in the 1aDf mice (Fig. 4A). Recruitment of p300 to the Ulk2 gene promoter, another gene where expression was sensitive to the loss of SREBP-1a, was also severely blunted in the 1aDf chromatin (Fig. 4B). In contrast, and consistent with our mRNA expression analyses (Fig. 3 and 5) recruitment of both SREBP-1 and p300 to the fatty acid synthase (FAS) and HMG CoA reductase proximal promoters was similar in wild-type and 1aDf mice (Fig. 4C and D). p300 possesses histone acetyltransferase activity and also recruits other proteins with HAT activity (13, 23). Therefore, we also monitored the acetylation of histone H3 at K9, which is a marker for increased gene expression. The ChIP analysis in Fig. 4E shows that H3 K9 acetylation at the Acacb promoter was also reduced relative to wild-type mice. These ChIP studies are entirely consistent with our previous SREBP-1-coactivator interaction studies performed with recombinant proteins in vitro and in vivo in cultured cells that showed p300 and CBP interacted much more strongly with SREBP-1a than SREBP-1c (20).
FIG. 4.

SREBP-1 and p300 bind to the Acacb promoter. For ChIP analysis, chromatin was extracted from the livers of chow-fed mice (all 6- to 8-week-old males). Chromatin from wild-type or 1aDf male mice (n = 6 in each group) were pooled and analyzed for recruitment of SREBP-1 (SR1) and p300 to promoters for the indicated genes in panels A to D. HMGCR, HMG CoA reductase. (E) The level of promoter-associated acetylated histone H3 was also determined for the Acacb promoter. These ChIP studies were performed as described in Materials and Methods. The quantity of DNA in the precipitation with either the SREBP-1 (SR1) or acetylated histone H3 (AcH3) antibodies was normalized to input chromatin and plotted relative to the IgG background. (F) Model illustrating the differences in the activation domain and coactivator recruitment with SREBP-1a and -1c, as supported in the present study and an earlier report from our laboratory (20).
FIG. 5.

Effect of fasting and refeeding on SREBP mRNA and protein in livers of wild-type and 1aDf mice. mRNA expression level for SRBEP-1a (A), SREBP-1c (B), and SREBP-2 (C) in livers from wild-type and 1aDf mice from fed mice, mice fasted for 24 h, or mice fasted for 24 h and then refed a high-carbohydrate/low-fat diet for 12 h. Total RNA from livers of mice was pooled (n = 6/group) and subjected to qPCR quantification, as described in Materials and Methods. qPCR data were normalized to the L32 expression. Each value represents the amount of mRNA relative to that in the fed wild-type mice (set arbitrarily as 1). (D) Protein levels for SRBEP-1 and SREBP-2. Equal amounts from livers (n = 6/group) were pooled, nuclear proteins were extracted, and 50-μg aliquots were analyzed by SDS-PAGE and immunoblot analysis for SREBP-1 (BP-1) and SREBP-2 (BP-2). *, P < 0.001; +, P < 0.01; #, P < 0.05.
Regulation of fatty acid storage through ACC2 is impaired in SREBP-1a-deficient mice.
ACC2 is an important regulator of fatty acid metabolism because its activity partitions hepatic fatty acids into triglycerides for storage in the cytosol and assembly of triglycerides rich lipoproteins or into mitochondria for fatty acid oxidation and ketone body production. The metabolic decision governing this partitioning is critical during fasting when fatty acids originating from adipose tissue are delivered to the liver. Hepatic fatty acids derived from adipose are used directly for energy generation, converted to ketone bodies, and delivered to other tissues or stored as cytosolic triglyceride droplets that can be mobilized during more prolonged stretches of food deprivation.
When Acacb was inactivated in mice, the mutant exhibited reduced hepatic triglyceride storage and elevated plasma ketone body levels during fasting. These results are consistent with a role for ACC2 in regulating fatty acid partitioning into cytosolic triglyceride or mitochondria for oxidation and ketone body production (1). Therefore, we hypothesized the 1aDf mice might display a similar defect in regulating fatty acid metabolism during fasting.
Accordingly, we compared the responses of wild-type and 1aDf mice to a standard fasting-refeeding protocol. First, we assessed gene expression for the three SREBP isoforms (Fig. 5). SREBP-1a mRNA was modestly affected by the fasting-refeeding protocol in wild-type mice, while the 1aDf mice expressed very low levels of SREBP-1a mRNA under all of the conditions tested (Fig. 5A). As expected (4), SREBP-1c mRNA levels fell dramatically during a 24-h fast and increased during the refeeding phase, both in wild-type and 1aDf mice (Fig. 5B). SREBP-2 mRNA levels exhibited only minor fluctuation with the feeding protocol, and there were no significant differences between wild-type and 1aDf groups (Fig. 5C). SREBP nuclear protein levels followed the patterns predicted by the SREBP-1c and SREBP-2 mRNA results.
We also analyzed expression of key lipogenic genes including Acacb (Fig. 6). Acacb expression was downregulated by fasting and upregulated by refeeding in wild-type mice; a similar response was observed in the 1aDf mice. However, in each group, the Acacb mRNA level was significantly lower in 1aDf mice. ACC2 protein levels were also significantly lower in the 1aDf samples, as judged by immunoblotting. In wild-type mice, ACC2 protein was not decreased by fasting but was induced by the refeeding regimen. Fatty acid synthase (Fasn) and ACC1 (Acaca) mRNA levels exhibited the expected response of SREBP-1c-controlled lipogenic genes, and there were no differences in the expression of these genes in wild-type versus 1aDf mice.
FIG. 6.

Effect of fasting and refeeding on SREBP-1 target genes in livers of wild-type and 1aDf mice. The total RNA samples analyzed in Fig. 5 were analyzed for FAS (Fasn) (A), ACC1 (Acaca) (B), and ACC2 (Acacb) (C) by qPCR as described in the legend to Fig. 5. (D) Equal aliquots of total protein from pooled liver preparations were subjected to SDS-PAGE and immunoblot analysis with either the ACC2-specific antibody or an α-tubulin-specific antibody (as a control).
We also compared the changes in metabolic parameters in blood and tissues. Plasma levels of glucose, nonesterified fatty acids, β-hydroxybutyrate, cholesterol, and triglycerides showed the expected fluctuations with fasting and refeeding, but there were only minor differences between wild-type and 1aDf mice after 24 h of fasting (Fig. 7 and see Fig. S2 in the supplemental material). The same was true for adipose tissue mass (Fig. 7) and hepatic levels of cholesterol (data not shown). Ketone body production at 24 h of fasting was not different between genotypes; however, consistent with our hypothesis, the hepatic triglyceride stores were significantly lower in the fasting samples from 1aDf mice (Fig. 7).
FIG. 7.

Loss of SREBP-1a results in decreased hepatic triglycerides and elevated ketones upon fasting. Liver and serum from individual mice were analyzed for triglyceride and ketone body levels as described in Materials and Methods. At 24 h, hepatic triglyceride levels (A) were decreased significantly, and serum ketone body levels (B) were not different. However, at longer fasting times, the hepatic triglyceride and serum ketone body production were significantly higher (C and D). Panels E and F show serum levels of nonesterified fatty acids and the weights of major adipose tissue stores for gonadal (GON), retroperitoneal (RT), and inguinal (ING) in wild-type and 1aDF mice relative to whole body weight, respectively. The bars represent means ± the standard errors of the mean for six mice in each group, and data are plotted for wild-type (□) and 1aDf (▪) mice. *, Significantly different from wild-type mice; **, significantly different from fed to fasting mice.
Because there were reduced but appreciable levels of ACC2 mRNA in 1aDf mice, we hypothesized that the 1aDf mice may not fully mimic the phenotype of the ACC2−/− mice and that the effects on ketone body production may only be revealed after prolonged fasting. Accordingly, we fasted wild-type and 1aDf mice for 36 or 48 h and measured hepatic triglyceride levels and serum ketone body production (Fig. 7). Consistent with our hypothesis, in addition to the decreased hepatic triglycerides, the levels of serum β-hydroxybutyrate were significantly higher after the prolonged fast in 1aDf mice.
DISCUSSION
Most mutant mice lacking both SREBP-1 isoforms die during embryonic development, and the small percentage that survive express elevated levels of SREBP-2 (17). Mice lacking only the 1c isoform are completely viable (11), which leads us to suspect that SREBP-1a might be absolutely required for development. However, the total viability of mice with a deficiency of SREBP-1a in our study showed that this was not the case. There are two potential explanations for this finding. The first and most likely is that either one of the SREBP-1 isoforms is sufficient for normal embryonic development. The second possibility is that trace amounts of SREBP-1a are expressed in critical cells during development and that the “leaky expression” from our gene-trap allele is sufficient for normal embryogenesis. Although we cannot completely discount the latter possibility, it seems unlikely to us, given that levels of SREBP-1a mRNA expression in the 1aDf mice were extremely low in each of 13 different adult mouse tissues tested (see Table S1 in the supplemental material).
SREBPs are well known to regulate the core pathways for the synthesis of cholesterol and fatty acids, but the current observations have uncovered a special role for the 1a isoform in balancing the choice between fatty acid oxidation and triglyceride synthesis in the liver. Because the two SREBP-1 isoforms have identical DNA binding and dimerization domains, they are predicted to bind DNA identically. However, their activation domains are distinct, and prior studies show they activate target genes with different potencies (20). SREBP-1c is by far the more abundant isoform in liver, so any functions that are equally performed by both isoforms would not be affected by the loss of SREBP-1a. Indeed, the fact that we identified only a few differentially expressed genes in wild-type versus 1aDf mice indicates that most functions of SREBP-1 in the liver can be carried out by SREBP-1c. A key finding of the current study is that Acacb expression was significantly perturbed in the 1aDf mice, indicating that SREBP-1c is not sufficient for controlling its expression.
Genes such as Acacb and their promoters, which are sensitive to the loss of SREBP-1a, must have a combination and organization of transcription factor binding sites that depend on the stronger activation domain of SREBP-1a to recruit the required coactivator proteins for efficient gene expression. In support of this concept, our previous work revealed that SREBPs are weak transcription factors by themselves and that without additional coregulatory binding sites and the corresponding activator proteins, SREBPs are ineffective in activating gene expression (15). We also showed that SREBPs synergize with different transcription factors through activation domains that are promoter specific (2, 24) and in our studies of Fasn expression, we showed that SREBP-1a functions efficiently with just NF-Y as a coregulator, whereas SREBBP-1c requires both NF-Y and Sp1 for high-level activation (12). These previous studies were based largely on cotransfection studies with plasmid-borne promoter templates, and the present results provide direct in vivo evidence to support the molecular mechanisms suggested by these earlier transfection studies.
To address the mechanism by which Acacb gene expression might be uniquely dependent on SREBP-1a in vivo, we showed that efficient recruitment of the p300 coactivator protein was reduced at the Acacb promoter in the 1aDf mice despite wild-type levels of total SREBP-1 binding (Fig. 4). The reduced recruitment of p300 by the SREBP-1c-bound promoter complex is sufficient to account for the decreased Acacb expression observed in 1aDf mice.
ACC2 is highly expressed in skeletal muscle and heart, two tissues with a high rate of fatty acid oxidation but a low rate of fatty acid synthesis (22). Hepatic expression of ACC2 presents an interesting metabolic challenge because the liver has a high capacity for both fatty acid synthesis and oxidation and must regulate these opposing activities according to physiologic demand (Fig. 8) and to prevent a futile metabolic cycle. ACC2 is critical for this process, particularly during fasting. We show that reduced hepatic ACC2 activity from a deficiency in SREBP-1a leads to an unbalanced partitioning of fatty acyl-CoAs between the mitochondrion and the cytosol. The reduction in malonyl-CoA levels close to the mitochondrial membrane increases the activity of the CPT-1 shuttle system. This leads to uncontrolled transport of fatty acyl-CoAs into the mitochondrion, where they are oxidized and converted to excess ketone bodies at the expense of storing the surplus acyl-CoAs in the form of cytosolic triglycerides. It is noteworthy that the phenotype of SREBP-1a deficiency is quite similar to the hepatic phenotype displayed by mice with a knockout of Acacb (1).
FIG. 8.

Model for ACC1 and 2 in regulation of fatty acid partitioning in liver.
A potential physiological explanation for why SREBP-1c cannot functionally substitute for SREBP-1a in the activation of ACC2 is suggested by the fact that Acacb is not a simple lipogenic target gene required for fatty acid biosynthesis. If SREBP-1c expression levels controlled ACC2, then ACC2 levels would fall precipitously during fasting, along with other SREBP-1c-controlled lipogenic genes. However, ACC2 levels need to be maintained during fasting at a sufficiently high level to regulate CPT-1 activity for fatty acyl-CoA partitioning as fatty acids are mobilized from adipose tissue and delivered to the liver. It makes sense that ACC2 would be controlled by SREBP-1a, because that isoform, in contrast to SREBP-1c, does not fall significantly during fasting.
The metabolic decision of whether to store or oxidize acyl-CoAs is fundamental to the development of nonalcoholic fatty liver disease, which is often associated with metabolic syndrome and hepatic insulin resistance (5). By establishing a role for SREBP-1a in this process, our studies suggest a novel avenue for further investigation and therapeutic intervention in nonalcoholic fatty liver disease.
Supplementary Material
Acknowledgments
We thank Mary Bennett, Michelle Dragojlovic, and the UCI microarray facility for technical assistance and K. S. Kim for the antibody to ACC2.
This study was supported in part by a grant from the National Institutes of Health (HL48044).
Footnotes
Published ahead of print on 29 June 2009.
Supplemental material for this article may be found at http://mcb.asm.org/.
REFERENCES
- 1.Abu-Elheiga, L., M. M. Matzuk, K. A. Abo-Hashema, and S. J. Wakil. 2001. Continuous fatty acid oxidation and reduced fat storage in mice lacking acetyl-CoA carboxylase 2. Science 2912613-2616. [DOI] [PubMed] [Google Scholar]
- 2.Athanikar, J. N., H. B. Sanchez, and T. F. Osborne. 1997. Promoter selective transcriptional synergy mediated by SREBP and Sp1: a critical role for the Btd domain of Sp1. Mol. Cell. Biol. 175193-5200. [DOI] [PMC free article] [PubMed] [Google Scholar]
- 3.Baldi, P., and A. D. Long. 2001. A Bayesian framework for the analysis of microarray expression data: regularized t-test and statistical inferences of gene changes. Bioinformatics. 17509-519. [DOI] [PubMed] [Google Scholar]
- 4.Bennett, M. K., Y.-K. Seo, S. Datta, D.-J. Shin, and T. F. Osborne. 2008. Selective binding of SREBP isoforms and co-regulatory proteins to promoters for lipid metabolic genes in liver. J. Biol. Chem. 28315628-15637. [DOI] [PMC free article] [PubMed] [Google Scholar]
- 5.Browning, J. D., and J. D. Horton. 2004. Molecular mediators of hepatic steatosis and liver injury. J. Clin. Investig. 114147-152. [DOI] [PMC free article] [PubMed] [Google Scholar]
- 6.Chandler, C. E., D. E. Wilder, J. L. Pettini, Y. E. Savoy, S. F. Petras, G. Chang, J. Vincent, and H. J. Harwood, Jr. 2003. CP-346086: an MTP inhibitor that lowers plasma cholesterol and triglycerides in experimental animals and in humans. J. Lipid Res. 441887-1901. [DOI] [PubMed] [Google Scholar]
- 7.Datta, S., and T. F. Osborne. 2005. Activation domains from both monomers contribute to transcriptional stimulation by SREBP dimers. J. Biol. Chem. 2803338-3345. [DOI] [PubMed] [Google Scholar]
- 8.Datta, S., L. Wang, D. D. Moore, and T. F. Osborne. 2006. Regulation of 3-hydroxy-3-methylglutaryl coenzyme a reductase promoter by nuclear receptors liver receptor homologue-1 and small heterodimer partner: a mechanism for differential regulation of cholesterol synthesis and uptake. J. Biol. Chem. 281807-812. [DOI] [PubMed] [Google Scholar]
- 9.Espenshade, P. J., and A. L. Hughes. 2007. Regulation of sterol synthesis in eukaryotes. Annu. Rev. Genet. 41401-427. [DOI] [PubMed] [Google Scholar]
- 10.Horton, J. D., J. L. Goldstein, and M. S. Brown. 2002. SREBPs: activators of the complete program of cholesterol and fatty acid synthesis in the liver. J. Clin. Investig. 1091125-1131. [DOI] [PMC free article] [PubMed] [Google Scholar]
- 11.Liang, G., J. Yang, J. D. Horton, R. E. Hammer, J. L. Goldstein, and M. S. Brown. 2002. Diminished hepatic response to fasting/refeeding and liver X receptor agonists in mice with selective deficiency of sterol regulatory element-binding protein-1c. J. Biol. Chem. 2779520-9528. [DOI] [PubMed] [Google Scholar]
- 12.Magaña, M. M., S.-H. Koo, H. C. Towle, and T. F. Osborne. 2000. Different sterol regulatory element binding protein-1 isoforms utilize distinct co-regulatory factors to activate the promoter for fatty acid synthase. J. Biol. Chem. 2754726-4733. [DOI] [PubMed] [Google Scholar]
- 13.Ogryzko, V. V., R. L. Schlitz, V. Russanova, B. H. Howard, and Y. Nakatani. 1996. The transcriptional coactivators p300 and CBP are histone acetyltransferases. Cell 87953-959. [DOI] [PubMed] [Google Scholar]
- 14.Oh, S. Y., S. K. Park, J. W. Kim, Y. H. Ahn, S. W. Park, and K. S. Kim. 2003. Acetyl-CoA carboxylase beta gene is regulated by sterol regulatory element-binding protein-1 in liver. J. Biol. Chem. 27828410-28417. [DOI] [PubMed] [Google Scholar]
- 15.Sanchez, H. B., L. Yieh, and T. F. Osborne. 1995. Cooperation by sterol regulatory element-binding protein and Sp1 in sterol regulation of low density lipoprotein receptor gene. J. Biol. Chem. 2701161-1169. [DOI] [PubMed] [Google Scholar]
- 16.Shimano, H., J. D. Horton, L. Shimomura, R. E. Hammer, M. S. Brown, and J. L. Goldstein. 1997. Isoform 1c of sterol regulatory element binding protein is less active than isoform 1a in livers of transgenic mice and cultured cells. J. Clin. Investig. 99846-854. [DOI] [PMC free article] [PubMed] [Google Scholar]
- 17.Shimano, H., I. Shimomura, R. E. Hammer, J. Herz, M. S. Brown, J. L. Goldstein, and J. D. Horton. 1997. Elevated levels of SREBP-2 and cholesterol synthesis in livers of mice homozygous for a targeted disruption of the SREBP-1 gene. J. Clin. Investig. 1002115-2124. [DOI] [PMC free article] [PubMed] [Google Scholar]
- 18.Shimomura, I., H. Shimano, J. D. Horton, J. L. Goldstein, and M. S. Brown. 1997. Differential expression of exons 1a and 1c in mRNAs for sterol regulatory element binding protein-1 in human and mouse organs and cultured cells. J. Clin. Investig. 99838-845. [DOI] [PMC free article] [PubMed] [Google Scholar]
- 19.Stryke, D., M. Kawamoto, C. C. Huang, S. J. Johns, L. A. King, C. A. Harper, E. C. Meng, R. E. Lee, A. Yee, L. L'Italien, P. T. Chuang, S. G. Young, W. C. Skarnes, P. C. Babbitt, and T. E. Ferrin. 2003. BayGenomics: a resource of insertional mutations in mouse embryonic stem cells. Nucleic Acids Res. 31278-281. [DOI] [PMC free article] [PubMed] [Google Scholar]
- 20.Toth, J. I., S. Datta, J. N. Athanikar, L. P. Freedman, and T. F. Osborne. 2004. Selective coactivator interactions in gene activation by SREBP-1a and -1c. Mol. Cell. Biol. 248288-8300. [DOI] [PMC free article] [PubMed] [Google Scholar]
- 21.Townley, D. J., B. J. Avery, B. Rosen, and W. C. Skarnes. 1997. Rapid sequence analysis of gene trap integrations to generate a resource of insertional mutations in mice. Genome Res. 7293-298. [DOI] [PubMed] [Google Scholar]
- 22.Wakil, S. J., and L. A. Abu-Elheiga. 2008. Fatty acid metabolism: target for metabolic syndrome. J. Lipid Res. 50(Suppl.)S138-S143. [DOI] [PMC free article] [PubMed] [Google Scholar]
- 23.Yang, X.-J., V. V. Ogryzko, J.-I. Nishikawa, B. H. Howard, and Y. Nakatani. 1996. A p300/CBP-associated factor that competes with the adenoviral oncoprotein E1A. Nature 382319-324. [DOI] [PubMed] [Google Scholar]
- 24.Yieh, L., H. B. Sanchez, and T. F. Osborne. 1995. Domains of transcription factor Sp1 required for synergistic activation with sterol regulatory element binding protein-1 of low-density lipoprotein receptor promoter. Proc. Natl. Acad. Sci. USA 926102-6106. [DOI] [PMC free article] [PubMed] [Google Scholar]
Associated Data
This section collects any data citations, data availability statements, or supplementary materials included in this article.