

The crystal structure of Sda, a DNA-replication/damage checkpoint inhibitor of sporulation in B. subtilis, has been solved via the MAD method. The subunit arrangement in the crystal has enabled a reappraisal of previous biophysical data, resulting in a new model for the behaviour of the protein in solution.
Keywords: Sda, sporulation histidine kinase inhibitors
Abstract
The crystal structure of the DNA-damage checkpoint inhibitor of sporulation, Sda, from Bacillus subtilis, has been solved by the MAD technique using selenomethionine-substituted protein. The structure closely resembles that previously solved by NMR, as well as the structure of a homologue from Geobacillus stearothermophilus solved in complex with the histidine kinase KinB. The structure contains three molecules in the asymmetric unit. The unusual trimeric arrangement, which lacks simple internal symmetry, appears to be preserved in solution based on an essentially ideal fit to previously acquired scattering data for Sda in solution. This interpretation contradicts previous findings that Sda was monomeric or dimeric in solution. This study demonstrates the difficulties that can be associated with the characterization of small proteins and the value of combining multiple biophysical techniques. It also emphasizes the importance of understanding the physical principles behind these techniques and therefore their limitations.
1. Introduction
The signal transduction pathway directing sporulation in Bacillus subtilis is primarily triggered by the sensor histidine kinase KinA (Trach & Hoch, 1993 ▶). In response to an as yet unknown cue, KinA utilizes ATP to autophosphorylate at a conserved histidine residue. The phosphate moiety is then sequentially passed via two other proteins, Spo0F and Spo0B, to the master sporulation transcription factor Spo0A, which directly or indirectly influences hundreds of genes involved in sporulation (Piggot & Hilbert, 2004 ▶). Various checkpoints exist to ensure that sporulation onset is not triggered inappropriately. One of these checkpoints involves the Sda protein. The gene for Sda was originally identified as the focus of mutations that permitted sporulation in strains that are ordinarily incapable of sporulating owing to defects in the DNA-replication initiation protein DnaA (hence, suppressor of dnaA; Burkholder et al., 2001 ▶).
Sda was shown to bind to KinA and to inhibit its function (Burkholder et al., 2001 ▶) and the structure of this small 46-amino-acid protein from B. subtilis was solved by NMR (Rowland et al., 2004 ▶). Sda was predicted to bind the KinA dimer near the hinge regions connecting the catalytic and ATP-binding (CA) domains to the four-helix bundle dimerization and histidine phosphotransfer (DHp) domain. Its inhibitory function was proposed to result from bound Sda impeding the CA-domain movement required to access the target histidine residues on the DHp ‘stalk’ (Rowland et al., 2004 ▶). This hypothesis was contradicted by a model derived from small-angle X-ray (SAXS) and neutron (SANS) scattering data that showed Sda molecules bound to either side of the DHp stalk at the end distal to that linking the DHp and CA domains (Whitten et al., 2007 ▶). An otherwise unrelated inhibitor of KinA, KipI, was shown to bind this same surface of the DHp domain (Jacques et al., 2008 ▶). Our KinA–Sda model, in which the Sda molecules do not directly contact the CA domains, was subsequently confirmed by genetic and biochemical methods (Cunningham & Burkholder, 2009 ▶) and by a recent cocrystal structure of the related Geobacillus stearothermophilus Sda (Gst-Sda) bound to a homologous kinase, KinB (Bick et al., 2009 ▶). In this communication, we report the crystal structure of Sda from B. subtilis (Bsu-Sda), which crystallizes with three Sda molecules in the asymmetric unit. We discuss this structure in relation to both the NMR-derived structure of Bsu-Sda (Rowland et al., 2004 ▶) and the KinB–Sda structure from G. stearothermophilus (Gst-Sda; Bick et al., 2009 ▶) and in relation to a re-evaluation of previously reported small-angle X-ray scattering data (Whitten et al., 2007 ▶).
2. Methods
2.1. Protein expression, purification and crystallization
Bsu-Sda was expressed as a GST fusion from pSLR65 (Rowland et al., 2004 ▶) within an Escherichia coli BL21 (DE3) host and purified as previously described (Whitten et al., 2007 ▶). Selenomethionyl labelling was performed using the Overnight Express Autoinduction System 2 (Novagen). Cleavage of the purified protein with thrombin released an Sda protein 48 residues in length comprising the 46 residues of Sda attached to two additional N-terminal residues (GS; confirmed by whole-protein mass spectrometry). Crystals of Sda were obtained by the hanging-drop vapour-diffusion method, in which 2 µl protein solution [7.8 mg ml−1 in 50 mM tris(hydroxymethyl)aminomethane pH 8.5, 200 mM NaCl] was mixed with 2 µl reservoir solution [15% polyethylene glycol 5000 monomethyl ether, 0.1 M 2-(N-morpholino)ethanesulfonic acid pH 6.3] and trays were incubated at 293 K. The crystal was cryoprotected by dipping it for a few seconds in reservoir solution doped with 2-methyl-2,4-pentanediol [20%(v/v)] before flash-cooling in a cold nitrogen stream (100 K; Oxford Cryostream).
2.2. Data collection and processing
Diffraction data were recorded at 100 K at three wavelengths corresponding to the peak (λ = 0.97945 Å), the inflection point (λ = 0.97959 Å) and a high-energy remote (λ = 0.94945 Å) of a selenium K-edge absorption profile on beamline 23ID-D at the Advanced Photon Source (Argonne, USA) using a MAR300 CCD detector. The data were integrated and scaled with HKL-2000 (Otwinowski & Minor, 1997 ▶).
2.3. Structure solution and refinement
Initial attempts to solve the structure of the native crystals by molecular replacement using the NMR structure as the search model were unsuccessful, possibly owing to our expectation that there would be two molecules in the asymmetric unit. This assumption was supported by the calculation of a Matthews coefficient (Matthews, 1968 ▶), which yielded a reasonable solvent content of 54% for two molecules per asymmetric unit, and by small-angle X-ray scattering (SAXS) data that we had interpreted as indicating that Sda was a dimer in solution (Whitten et al., 2007 ▶) rather than a monomer as reported previously based on NMR and multiple-angle laser light-scattering (MALLS) data (Rowland et al., 2004 ▶). Initial calculations with SOLVE (Terwilliger, 2003 ▶) using the three-wavelength diffraction data clearly identified five anomalous difference Patterson peaks in space group P41212 rather than the four peaks expected for a dimer (each Sda contains two selenomethionine residues). Solvent flattening and density modification using RESOLVE (Terwilliger, 2003 ▶) yielded easily traceable maps that clearly revealed three molecules of Sda per asymmetric unit (solvent content ∼28%), one of which was missing N-terminal residues including the N-terminal selenomethionine (see Fig. 1 ▶). Manual map inspection and model building were performed with Coot (Emsley & Cowtan, 2004 ▶) and positional refinement was performed with REFMAC5 (Murshudov et al., 1997 ▶). Structure validation, including Ramachandran analysis (Table 1 ▶), was performed with MolProbity (Lovell et al., 2003 ▶). The calculation of contact surface areas between molecules was performed with PISA (Krissinel & Henrick, 2007 ▶). Images were prepared with PyMOL (http://www.pymol.org).
Figure 1.
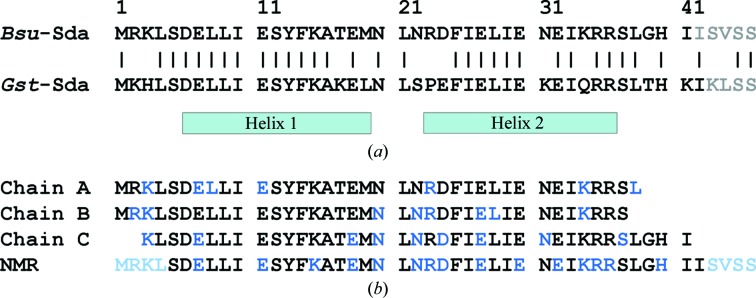
Sda amino-acid sequences. (a) Sequence homology between Sda from B. subtilis (Bsu) and G. stearothermophilus (Gst). Helical segments are indicated. C-terminal residues absent in either crystal structure are coloured grey. (b) Residues refined in the three molecules found in the asymmetric unit of Bsu-Sda and in the NMR ensemble (PDB entry 1pv0). The side chains of the residues indicated by blue text are represented by poor electron density and therefore were not modelled in the crystal structure, nor were they refined to unique positions in the NMR ensemble. Residues in light blue text were not refined to unique positions in the NMR ensemble.
Table 1. Data-collection and refinement statistics.
(a).
Data collection for selenomethionine Sda crystal in space group P41212. Values in parentheses are for the highest resolution shell.
| Peak | Inflection | Remote | |
|---|---|---|---|
| Wavelength () | 0.97945 | 0.97959 | 0.94945 |
| Unit-cell parameters () | a = b = 37.0, c = 167.2 | a = b = 37.0, c = 167.3 | a = b = 37.0, c = 167.3 |
| Resolution limits () | 501.97 | 501.97 | 501.91 |
| Completeness (%) | 99.5 (99.9) | 99.5 (99.4) | 99.2 (98.9) |
| Unique reflections† | 15638 | 15608 | 17072 |
| Redundancy | 3.6 (3.1) | 3.6 (3.1) | 3.4 (3.0) |
| R merge ‡ | 0.060 (0.56) | 0.059 (0.62) | 0.056 (0.94) |
| Average I/(I) | 16.4 (2.19) | 16.8 (2.15) | 17.5 (1.56) |
| Wilson B value (2) | 32.6 | 33.7 | 34.2 |
(b).
Refinement statistics on peak data.
| Non-H atoms | 888 |
| Water molecules | 8 |
| R.m.s.d. bond lengths () | 0.010 |
| R.m.s.d. bond angles () | 1.1 |
| R.m.s.d. peptide planarity () | 4.2 |
| Ramachandran plot favoured (%) | 98.1 |
| Ramachandran plot accepted (%) | 2 |
| Ramachandran plot outliers (%) | 0 |
| Mean B value (2) | 29.9 |
| R.m.s.d. B, main chain (2) | 2.0 |
| R.m.s.d. B, side chain (2) | 5.1 |
| R | 0.23 |
| R free | 0.30 |
| PDB code | 3fyr |
Friedel pairs have been treated as individual reflections for the purposes of scaling, but were combined for the purposes of refinement.
R
merge = 

 .
.
2.4. Mass spectrometry
Sda molecules were released from a crystal which was briefly washed in trifluoroacetic acid (0.1%) before being dissolved in water (6 µl). Whole-protein mass spectrometry was then performed as described previously (Whitten et al., 2007 ▶).
2.5. Small-angle X-ray scattering analysis
The SAXS data re-evaluated in this study are those reported by Whitten et al. (2007 ▶). Briefly, SAXS data on Sda and its buffer (2 and 6 h exposures, respectively) were collected at 293 K on a Bruker Nanostar instrument with three-pinhole collimation. Sda monomer, dimer, trimer, tetramer and hexamer atomic models were evaluated against the SAXS data using the program CRYSOL (Svergun et al., 1995 ▶). Ab initio shape-restoration calculations were performed using DAMMIN (Svergun, 1999 ▶) with P1 symmetry and the resultant dummy-atom models were averaged and filtered using DAMAVER (Volkov & Svergun, 2003 ▶) with the default parameters. The average normalized spatial discrepancy value for the 12 DAMMIN calculations performed was 0.46, with a standard deviation of 0.01, indicating that the solutions are highly consistent. Alignment of atomic models with the averaged and filtered model from DAMAVER was optimized using SUPCOMB13 (Kozin & Svergun, 2001 ▶). The volume of the models was calculated using NUCPROT (Voss & Gerstein, 2005 ▶). The possibility that multiple oligomers were present in solution was assessed using OLIGOMER (Konarev et al., 2003 ▶).
2.6. Multiple-angle laser light scattering
MALLS was performed on samples eluting from a Pharmacia HR 10/30 Superdex 75 column pumped by an ÄKTA HPLC (Amersham Pharmacia Biotech) at 0.5 ml min−1 in either ‘original’ buffer (50 mM sodium phosphate pH 7.9, 300 mM NaCl, 0.02% NaN3; Rowland et al., 2004 ▶) or SAXS buffer (50 mM Tris pH 8.5, 50 mM NaCl; Whitten et al., 2007 ▶). The column eluate was plumbed into a miniDAWN Tristar laser light-scattering photometer and then into an Optilab DSP interferometric refractometer (both from Wyatt Technology Corporation). Samples were loaded onto the column via a 1 ml loop. Sda was loaded at 2 mg ml−1 (injections of 0.5 and 0.05 ml). Bovine pancreatic trypsin inhibitor (BPTI; Roche) was loaded at 1 mg ml−1 (0.5 ml injection). Sda samples were dialysed in the appropriate column buffer prior to injection. Molecular-weight estimates were determined using Debye fitting and reported errors are standard deviations on the molecular-weight estimates.
3. Results and discussion
3.1. Sda structure solution and comparison with NMR ensemble
The crystal structure of selenomethionine-substituted Bsu-Sda was solved by the MAD method and comprised three molecules per asymmetric unit. The residues modelled are presented in Fig. 1 ▶(b), where those in blue text represent residues for which insufficient electron density resulted in side chains being truncated to their Cβ atoms. The relatively large gulf between the R and R free crystal structure-quality indicators (Table 1 ▶) might reflect the fact that only 79% of residues could be resolved for the three molecules and of these 20% were not modelled beyond atom Cβ (that is, only 75% of nonsolvent electrons have been modelled). Whole-protein mass spectrometry of a washed and redissolved crystal gave a single peak at m/z = 5690 (corresponding to the expected molecular weight), confirming the predominance of molecules comprising all 48 residues in the crystal (data not shown). We can therefore attribute the absence of electron density to structural disorder rather than proteolysis. The three Bsu-Sda molecules of the asymmetric unit all share the same basic antiparallel helical hairpin fold (Fig. 2 ▶ a); overlaying the Cα backbones yielded root-mean-square deviations (r.m.s.d.s) of 0.53, 0.51 and 0.73 Å for the superposition of molecules A on B, A on C and B on C (for 37, 35 and 35 aligned Cα atoms), respectively. This fold is also essentially the same as that observed for the NMR ensemble of Bsu-Sda (PDB code 1pv0; Rowland et al., 2004 ▶); the first of 25 calculated structures (the Cα atoms of which closely overlay each other) superpose on chains A, B and C of the crystal structure with r.m.s.d.s of 0.73, 0.72 and 0.94 Å (for 33, 33 and 37 aligned Cα atoms), respectively. The residues of the NMR ensemble for which side chains are ill-defined largely correlate with those that are also poorly defined in the electron density (Fig. 1 ▶ b, blue text) and those C-terminal residues that the ensemble suggests are disordered (Fig. 1 ▶ b, light blue text) are absent in the crystal structures.
Figure 2.

Sda crystal and NMR structures. (a) The Cα traces of the three subunits of the asymmetric unit (A, green; B, light blue; C, magenta) are superposed with each other and with well ordered residues of model A of the NMR structure (red) and Gst-Sda from the Gst-Sda–KinB complex (grey). The side of the molecule which interacts with the histidine kinase is indicated by residue Phe25 from Gst-Sda (grey sticks). (b) Stick representation of Bsu-Sda (chain A, green backbone) superposed with Gst-Sda (grey). Residues which form a hydrophobic surface centred on Phe25 are labelled (Bsu-Sda sequence). (c) Superposition of the interaction surfaces formed between Gst-Sda and Gst-KinB (yellow and orange, respectively), Bsu-Sda chains C and B (magenta and light blue, respectively) and Bsu-Sda chains B and A* (pink and blue, respectively). Residues that form a hydrophobic pocket for Phe25 of Sda are labelled (those in parentheses are the analogous residues from Gst–KinB; orange).
3.2. Comparison with homologue from G. stearothermophilus
The Bsu-Sda crystal structure is also very similar to that of the Sda molecule cocrystallized in complex with KinB from G. stearothermophilus (Gst-Sda; PDB code 3d36; Bick et al., 2009 ▶; Fig. 2 ▶ a). This structural homology is unsurprising given that 33 of the 46 residues (∼72%) are identical in Sda from the two species (Fig. 1 ▶ a). Gst-Sda superposes onto the A, B and C chains of Bsu-Sda with r.m.s.d.s of 0.38, 0.67 and 0.62 Å (for 37, 37 and 39 aligned Cα atoms), respectively. The extreme N-terminal residues of Bsu-Sda (which are disordered in the NMR structure) fold back onto one surface of the helical hairpin as in Gst-Sda, where in the Sda–KinB complex they contribute to the interaction with KinB. A superposition of the residues from the two organisms which comprise this hydrophobic surface centred about the invariant Phe25 is shown in Fig. 2 ▶(b). The extreme C-terminal residues of the C chain of Bsu-Sda, as in the NMR structure and in Gst-Sda, fold back onto the other surface of the hairpin where they project away from the DHp domain in the Gst-Sda–KinB complex. Equivalent C-terminal folds are not possible in the A and B chains of Bsu-Sda owing to steric clashes with symmetry-related molecules (see below).
3.3. Sda arrangement in the crystal
On cursory inspection, the three molecules in the asymmetric unit pack against each other in an unusual arrangement unrelated by simple rotation about twofold or threefold axes (Fig. 3 ▶). However, the generation of symmetry-related molecules by rotation about a crystallographic twofold axis reveals a tightly packed arrangement of six molecules (chains A, B, C, A*, B* and C* in Fig. 3 ▶). The disordered C-termini of these units are located on the periphery of this ensemble, where they make no obvious contribution to intermolecular packing. When the surface areas of contact are calculated between the different pairs of this ensemble, two significant surfaces of interaction are evident: that between molecules B and C and that between molecules B and A* (or the equivalent A and B*; Fig. 3 ▶ and Table 2 ▶). Interestingly, the more minor interactions within the asymmetric unit trimer between molecules A and C and between molecules A and B sum to approximately the same surface area as the B–C (or A–B*) interaction, suggesting a stable trimer that might persist in solution. The size of the B–C or A–B* buried surfaces is comparable to that buried in the Gst-Sda–KinB complex (Table 2 ▶). Significantly, the surfaces of interaction between molecules B and C and between molecules B and A* both involve Phe25, which projects from one face of the molecule (Fig. 2 ▶ c, magenta and pink molecules) and inserts into a hydrophobic pocket on the other face of the partner molecule (Fig. 2 ▶ c, light blue and blue molecules). In fact, the two different head-to-tail arrangements both house Phe25 in the same hydrophobic pocket (lined by Ile10, Tyr13 and Phe14), but in a slightly different orientation in each case (Fig. 2 ▶ c; compare the light blue and blue molecules). This hydrophobic pocket is similar to the pocket in the DHp domain of the Gst-KinB histidine kinase (Fig. 2 ▶ c; lined by residues Gly224, Phe225 and Leu228, and shown as orange surface and sticks).
Figure 3.

Arrangement of Sda molecules in the crystal. Molecules A, B and C constitute the asymmetric unit. The residue number for the terminus of each chain modelled is indicated. Molecules A*, B* and C* are related to the asymmetric unit by rotation about a twofold crystal symmetry axis (perpendicular to the middle of the image).
Table 2. Buried surface interfaces for each molecule as calculated by PISA (Krissinel Henrick, 2007 ▶).
| Subunit 1 | Subunit 2 | Subunit 3 | Contact area (2) |
|---|---|---|---|
| Bsu-Sda chain B | Bsu-Sda chain C | 571 | |
| Bsu-Sda chain B | Bsu-Sda chain A* | 510 | |
| Bsu-Sda chain A | Bsu-Sda chain C | 307 | |
| Bsu-Sda chain A | Bsu-Sda chain B | 234 | |
| Bsu-Sda chain A | Bsu-Sda chain B | Bsu-Sda chain C | 1112 |
| Bsu-Sda chain B | Bsu-Sda chain C | Bsu-Sda chain A* | 1081 |
| Gst-KinB | Gst-Sda | 649 |
3.4. Solution state of Sda
The solution state of Bsu-Sda has been subject to different interpretations; it was first described as a monomer based on NMR and MALLS data (Rowland et al., 2004 ▶) and subsequently as a dimer based on SAXS data (Whitten et al., 2007 ▶). In the case of the SAXS data the biophysical parameters [the radius of gyration (R g) and maximum linear dimension (D max)] were inconsistent with a monomer model. We were able to reasonably fit the SAXS data with dimer models generated from the NMR structure whilst imposing a P2 symmetry constraint (the best χ2 value reported was 1.08; see Fig. 4 ▶ i). This model has a minimal interaction surface between the two molecules, with some steric clashes in this region. We now have the opportunity to evaluate new monomer and multimer models derived directly from the crystal structure. Models evaluated included the Sda monomer (chain A), the dimers A–B* and B–C, the trimers A–B–C (asymmetric unit) and B–C–A*, the tetramer A–B–A*–B* and the hexamer A–B–C–A*–B*–C* (Fig. 3 ▶). The monomer, tetramer and hexamer models do not fit the data, with χ2 values of 5.6, 4.79 and 19.3, respectively. Theoretical monomer and hexamer scattering profiles overlayed with the data are shown in Figs. 4 ▶(a) and 4 ▶(b). The two dimer models fit the data significantly better but are still far from ideal fits, with χ2 values of 2.2 and 2.0 (Figs. 4 ▶ c and 4 ▶ d, respectively). In contrast, the trimer models fit the data best (Figs. 4 ▶ e and 4 ▶ f), with χ2 = 0.85 for the A–B–C trimer (asymmetric unit) and χ2 = 1.1 for the B–C–A* trimer. A statistical significance test (F-test) comparing these trimer χ2 values indicates that the difference between the fit of these models to the data is significant (p-value of 0.96), favouring the asymmetric unit trimer model. Additionally, in the A–B–C trimer model each constituent Sda molecule makes intermolecular contacts with the other two in the ensemble (this is not the case with the B–C–A* trimer), suggesting that such a species might be more stable in solution.
Figure 4.

Sda solution model fits to SAXS data. (a) Subunit A. (b) A–B–C–A*–B*–C* hexamer. (d) B–C dimer. (d) A–B* dimer. (e) A–B–C trimer. (f) B–C–A* trimer. (g) B–C dimer with disordered residues modelled. (h) A–B–C trimer with disordered residues modelled. (i) Original NMR structure modelled as a dimer. The A, B and C subunits are coloured as in Fig. 3 ▶, mass-enhanced models are coloured blue and the NMR dimer is shown in orange. χ2 values are reported in the top right corner of each panel.
The superposition of the A–B–C trimer model onto the molecular envelope generated from the SAXS data using shape restoration is shown in Fig. 5 ▶. Interestingly, the volume of the averaged dummy-atom reconstructions output by DAMAVER (20 620 Å3) for the SAXS data is near-identical to that calculated for a trimer constructed of full-length 48-residue monomers (20 820 Å3). However, the trimer model based on the crystal structure which best fits the scattering data is missing approximately 25% of the total mass owing to disorder. Attempts to include the missing mass in the form of side chains and/or terminal residues were made for various dimeric and trimeric states (examples are shown in Figs. 4 ▶ g and 4 ▶ h), but the calculations performed using such models assume that the added residues are rigid and none of these augmented models resulted in a superior fit to the SAXS data (χ2 = 1.45 and 3.29 for the dimer and trimer, respectively; see Figs. 4 ▶ g and 4 ▶ h).
Figure 5.
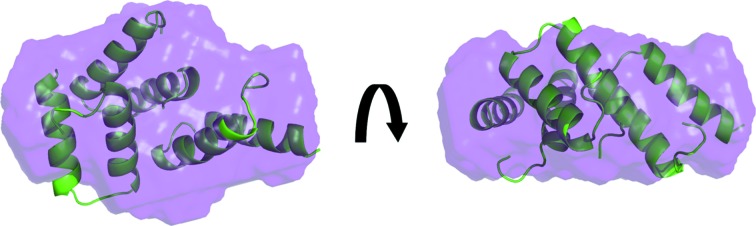
Sda trimer A–B–C positioned inside a dummy-atom enveloped generated by DAMMIN (Svergun, 1999 ▶) and DAMAVER (Volkov & Svergun, 2003 ▶) to model the SAXS data.
Sda is known to complex its target histidine kinases as a monomer (Whitten et al., 2007 ▶; Bick et al., 2009 ▶), suggesting that any larger complexes observed in vitro must be capable of dissociation. In order to address the possibility that multiple Sda species exist in equilibrium, fits to the scattering data were calculated with various combinations of monomer, dimer, trimer, tetramer and hexamer using OLIGOMER (Table 3 ▶). OLIGOMER calculates the mass fraction of a particular species in solution assuming that multiple species are contributing to the scattering. The program also calculates the χ2 of the resultant fit to the data, as well as a fidelity value describing the probability that the fits are statistically consistent with the data. The best χ2 and fidelity values are obtained in calculations 2, 4, 6, 7 and 9–11, all of which include the A–B–C trimer model (Table 3 ▶, in bold). In each case the trimer is calculated to be the dominant species in solution. The OLIGOMER calculation that samples only monomer and dimer species is incapable of reasonably fitting the data (calculation 1). Calculations 3, 5 and 8, which also lack the trimer model, output reasonable χ2 values but are less likely to be correct according to the fidelity values. Hence, these results indicate that the A–B–C trimer found in the asymmetric unit (possibly in equilibrium with a small amount of monomer and dimer) best fits the SAXS data and is the most likely oligomeric state of Sda in solution at the concentration investigated by SAXS.
Table 3. Modelling the SAXS data with a mixture of different oligomers of Sda.
The values are the calculated fractions of each component and the overall fit for each calculation. Results including trimer models are given in bold. Ensemble components (with reference to Fig. 3 ▶): monomer = A; dimer = B C; trimer = A B C; hexamer = A B C A*B*C*. Calculations involving all combinations of ensembles including the tetramer A B A*B* were also performed but have been omitted for simplicity. The results for these tetramer-containing ensembles were the same: those including trimers yielded 2 values close to 1 with high fidelities but with little or no contribution from the tetramer species; those without trimers yielded low fidelity values with little contribution from the tetramer component.
| Fractions error | |||||||
|---|---|---|---|---|---|---|---|
| Calc. | Ensemble | Monomer | Dimer | Trimer | Hexamer | 2 | Fidelity |
| 1 | Mon Dim | 0.19 0.05 | 0.81 0.03 | 1.93 | 3.9 1015 | ||
| 2 | Mon Tri | 0.01 0.08 | 0.99 0.03 | 0.85 | 0.96 | ||
| 3 | Mon Hex | 0.88 0.01 | 0.12 0.00 | 1.00 | 0.50 | ||
| 4 | Dim Tri | 0.01 0.09 | 0.99 0.06 | 0.85 | 0.96 | ||
| 5 | Dim Hex | 0.95 0.02 | 0.05 0.01 | 1.77 | 1.1 1011 | ||
| 6 | Tri Hex | 1.00 0.00 | 0.00 0.00 | 0.85 | 0.96 | ||
| 7 | Mon Dim Tri | 0.01 0.08 | 0.00 0.09 | 0.99 0.06 | 0.85 | 0.96 | |
| 8 | Mon Dim Hex | 0.81 0.06 | 0.08 0.05 | 0.11 0.01 | 0.99 | 0.56 | |
| 9 | Mon Tri Hex | 0.08 0.26 | 0.91 0.16 | 0.01 0.04 | 0.85 | 0.96 | |
| 10 | Dim Tri Hex | 0.01 0.09 | 0.99 0.06 | 0.00 0.00 | 0.85 | 0.96 | |
| 11 | Mon Dim Tri Hex | 0.08 0.26 | 0.00 0.09 | 0.91 0.16 | 0.01 0.04 | 0.85 | 0.96 |
In order to reconcile this conclusion with the MALLS data reported with the NMR structure, we performed MALLS on Sda eluting from a gel-filtration column using essentially the same instrumentation and buffer conditions as originally reported (50 mM sodium phosphate pH 7.9, 300 mM NaCl, 0.02% NaN3 pH 7.9; Rowland et al., 2004 ▶) and under the buffer conditions used for the SAXS measurement (50 mM Tris pH 8.5, 50 mM NaCl; Whitten et al., 2007 ▶). At the Sda concentrations we investigated using MALLS, the Sda preparation behaved identically in both buffer conditions, although the molecular-weight estimates determined for the eluting peaks showed a concentration dependence. The expected molecular weights for the trimeric, dimeric and monomeric states of Sda are 17.1, 11.4 and 5.7 kDa, respectively. At (high) concentrations approaching the refractive-index limit of the instrument, the Sda elution peak returned molecular-weight estimates of ∼9.3 ± 0.1 kDa (maximum peak concentration of ∼0.9 mg ml−1 ≃ 160 µM; Fig. 6 ▶, red trace and data points). At (low) concentrations approaching the light-scattering detection limit, the Sda peak eluted fractionally later, returning a molecular-weight estimate of ∼7.2 ± 0.4 kDa (maximum peak concentration of ∼0.1 mg ml−1 ≃ 20 µM; Fig. 6 ▶, magenta trace and data points). Both high- and low-concentration Sda peaks are asymmetric in shape (noticeably steeper on the earlier eluting side), which is indicative of a polydisperse population of molecules within the peak. This is also evidenced by the ‘frown-like’ distribution of the molecular-weight estimates, which are lower on either side of the peak maximum corresponding to lower local protein concentrations. The behaviour of the A 280 and molecular-weight estimate profiles of the Sda samples contrast with those from bovine pancreatic trypsin inhibitor (BPTI), a 6.5 kDa protein that does not oligomerize, examined under the same conditions (Fig. 6 ▶, blue trace and scatter points). At the higher concentration of Sda investigated by MALLS the eluting peak is probably populated by a greater proportion of dimers (and maybe trimers) than at the lower concentration. These data clearly indicate that the oligomeric state of Sda is concentration dependent, that the equilibrium constant for these oligomerizations are in the micromolar range and that the rates of association and dissociation for the oligomerizations are such that monomeric and multimeric species are not partitioned by the gel-filtration column. It should be noted that the concentrations examined by MALLS are considerably lower than those used for the SAXS analysis or for NMR (>5 mg ml−1 ≃ 1 mM), where a greater proportion of the trimer species, which is an excellent fit to the SAXS data, would be expected. Hence, it is probable that the apparent contradiction noted between the molecular-weight estimates returned by SAXS and MALLS was merely a reflection of sample concentration.
Figure 6.

MALLS-derived molecular weights for Sda eluting from a gel-filtration column at high (red) and low (magenta) relative concentrations. The solid lines correspond to A 280 traces, whilst the scatter plots indicate molecular-weight estimates calculated for different parts of the elution profile. Data for bovine pancreatic trypsin inhibitor (BPTI; monomer at 6.5 kDa) run under identical conditions are included for reference (blue trace and scatter points). The plots have been scaled for clarity: ×0.7 for BPTI and ×5 for low-concentration Sda. The profiles and relative elution times for the three samples were identical in high-salt and low-salt buffers (detailed in §2.6).
It seems unlikely that the sample used for NMR studies could have been a tight trimer as this would have led to intermolecular NOEs being mistakenly interpreted as intramolecular NOEs, which would have inevitably introduced errors in the structure. However, if the trimer was in equilibrium with smaller species, as suggested by the new MALLS data (discussed above), and the exchange between the two (or more) states occurs on the so-called intermediate exchange timescale, the intermolecular NOEs could have been severely broadened and become essentially invisible relative to the monomer signal.
3.5. Caveats for SAXS interpretation of small proteins
The SAXS data are clearly inconsistent with the monomeric model of Sda (Fig. 4 ▶ a). The scattering experiment was repeated under identical solution conditions to the NMR experiment (pH, ionic strength and concentration), with no observable change in the data. Our analysis of the forward scattering intensity [I(0)] appeared to be consistent with a dimeric species (Whitten et al., 2007 ▶). However, the I(0)-derived mass of a protein in solution is dependent on an accurate estimate of concentration, as well as on assumptions that the partial specific volume is comparable to a known protein standard (in this case lysozyme). Sda has a very low molar absorption coefficient as it contains only one tyrosine residue and no tryptophan residues (∊280 = 1490 M −1 cm−1), making accurate concentration determination by this method highly susceptible to overestimation owing to minor contamination with more strongly absorbing species. The structure of Sda also reveals a large disordered component that lacks a significant hydrophobic interior. Hence, the partial specific volume might be expected to deviate significantly from that of more typical globular proteins (such as lysozyme). It is likely that both concentration overestimation and an incorrect partial specific volume assumption resulted in our misinterpretation of the I(0) data.
Our current model for the solution state of Sda, consistent with all the biophysical techniques employed, is that at high concentration the molecule oligomerizes into a weakly associated trimer in equilibrium with low concentrations of dimeric and monomeric species. Whilst the SAXS sample was one of high concentration and purity, the concentration dependence noted for the oligomeric state (new MALLS data) is consistent with the expectation that in vivo Sda functions as a monomer.
4. Concluding remarks
The availability of the crystal structure of Sda, which on its own yielded little clue as to the solution state of the molecule, has unwittingly provided a model template which allows a reappraisal of previous biophysical results, the analysis of which was likely to have been misled by issues of concentration determination and intrinsic flexibility. This study therefore highlights the caution that must be exercised during interpretation of biophysical data, especially when applied to small proteins that fall outside the usual parameters of detectability and rigidity, as well as highlighting the value of combining complementary techniques to probe the solution behaviour of biological macromolecules.
Supplementary Material
PDB reference: Sda, 3fyr, r3fyrsf
Acknowledgments
We thank Mika Jormakka for the collection of diffraction data at the Advanced Photon Source (USA). The General Medicine and Cancer Institutes Collaborative Access Team (GM/CA-CAT), which operates beamline 23ID-D, is supported by the US National Cancer Institute and the US National Institute of General Medical Science. Dr Jormakka’s visit to the APS was supported by the Australian National Science and Technology Organization (ANSTO). We thank Ben Crossett for performing mass spectrometry using the Australian Proteome Analysis Facility established under the Australian Government’s Major National Facilities Program. We thank Andrew Whitten for helpful discussions. DAJ was supported by an Australian Institute of Nuclear Science and Engineering Postgraduate Research Award. This research was supported by an Australian Research Council Federation Fellowship (FF0457488 awarded to JT), NHMRC project grant 511206 awarded to GFK and NHMRC project grant 352434 awarded to GFK and JMG.
References
- Bick, M. J., Lamour, V., Rajashankar, K. R., Gordiyenko, Y., Robinson, C. V. & Darst, S. A. (2009). J. Mol. Biol. 386, 163–177. [DOI] [PMC free article] [PubMed]
- Burkholder, W. F., Kurtser, I. & Grossman, A. D. (2001). Cell, 104, 269–279. [DOI] [PubMed]
- Cunningham, K. A. & Burkholder, W. F. (2009). Mol. Microbiol. 71, 659–677. [DOI] [PubMed]
- Emsley, P. & Cowtan, K. (2004). Acta Cryst. D60, 2126–2132. [DOI] [PubMed]
- Jacques, D. A., Langley, D. B., Jeffries, C. M., Cunningham, K. A., Burkholder, W. F., Guss, J. M. & Trewhella, J. (2008). J. Mol. Biol. 384, 422–435. [DOI] [PubMed]
- Konarev, P. V., Volkov, V. V., Sokolova, A. V., Koch, M. H. J. & Svergun, D. I. (2003). J. Appl. Cryst. 36, 1277–1282.
- Kozin, M. B. & Svergun, D. I. (2001). J. Appl. Cryst. 34, 33–41.
- Krissinel, E. & Henrick, K. (2007). J. Mol. Biol. 372, 774–797. [DOI] [PubMed]
- Lovell, S. C., Davis, I. W., Arendall, W. B. III, de Bakker, P. I., Word, J. M., Prisant, M. G., Richardson, J. S. & Richardson, D. C. (2003). Proteins, 50, 437–450. [DOI] [PubMed]
- Matthews, B. W. (1968). J. Mol. Biol. 33, 491–497. [DOI] [PubMed]
- Murshudov, G. N., Vagin, A. A. & Dodson, E. J. (1997). Acta Cryst. D53, 240–255. [DOI] [PubMed]
- Otwinowski, Z. & Minor, W. (1997). Methods Enzymol. 276, 307–326. [DOI] [PubMed]
- Piggot, P. J. & Hilbert, D. W. (2004). Curr. Opin. Microbiol. 7, 579–586. [DOI] [PubMed]
- Rowland, S. L., Burkholder, W. F., Cunningham, K. A., Maciejewski, M. W., Grossman, A. D. & King, G. F. (2004). Mol. Cell, 13, 689–701. [DOI] [PubMed]
- Svergun, D. I. (1999). Biophys. J. 76, 2879–2886. [DOI] [PMC free article] [PubMed]
- Svergun, D., Barberato, C. & Koch, M. H. J. (1995). J. Appl. Cryst. 28, 768–773.
- Terwilliger, T. C. (2003). Methods Enzymol. 374, 22–37. [DOI] [PubMed]
- Trach, K. A. & Hoch, J. A. (1993). Mol. Microbiol. 8, 69–79. [DOI] [PubMed]
- Volkov, V. V. & Svergun, D. I. (2003). J. Appl. Cryst. 36, 860–864.
- Voss, N. R. & Gerstein, M. (2005). J. Mol. Biol. 346, 477–492. [DOI] [PubMed]
- Whitten, A. E., Jacques, D. A., Hammouda, B., Hanley, T., King, G. F., Guss, J. M., Trewhella, J. & Langley, D. B. (2007). J. Mol. Biol. 368, 407–420. [DOI] [PubMed]
Associated Data
This section collects any data citations, data availability statements, or supplementary materials included in this article.
Supplementary Materials
PDB reference: Sda, 3fyr, r3fyrsf