Abstract
We present a remanence measurement method using a superconducting quantum interference device (SQUID) to detect trace amount of magnetic nanoparticles (MNPs). Based on this method, a one-dimensional scanning system was established for imaging by utilizing superparamagnetic iron oxide nanoparticles (NPs) as contrast agents. The system was calibrated with 25 nm diameter Fe2O3 NPs, and the sensitivity of the NPs was found to be 10 ng at a distance of 1.7 cm and the spatial resolution was ∼1 cm. A theoretical model of this system was developed and applied to the deconvolution of scanned images of phantoms with two NP injection spots. Using the developed SQUID system, we were able to determine not only the amount and horizontal positions of the injections, but also their depths in the phantoms.
1. Introduction
Over the past decade, in vivo imaging techniques using magnetic nanoparticles (MNPs) as contrast agents for disease diagnosis, especially cancers, have undergone rapid development (McCarthy and Weissleder 2008, Sun et al 2008). The earlier the tissue lesion is detected, the better the chances that it can be treated. The use of superconducting quantum interference devices (SQUIDs), the most sensitive magnetic sensors to date (Mahdi and Mapps 1998), stands out as a promising technique for imaging of MNPs.
SQUID imaging, a non-invasive method, has been used in past studies to track the naturally occurring magnetic particles in human organs, for example, examination of human liver iron stores (Brittenham et al 1982) and iron accumulation in lungs (Cohen 1973). Further application of SQUID to targeted MNPs was also attempted, such as locating the sentinel lymph node for breast cancer detection (Tanaka et al 2002) and biological immunoassays (Chemla et al 2000, Enpuku et al 2003b, Weitschies et al 1997). This strategy is even more promising as the quality of MNPs has been greatly improved with higher bio-compatibility achieved and multiple functional ligands conjugated to the surfaces (Shi et al 2008, Wang et al 2007). The detection method of SQUID is closely related to the size-dependent magnetic properties of MNPs. When the magnetic particles become much smaller than the maximum single domain size, the thermal energy becomes high enough to randomize the orientation of both individual particles and the internal magnetic moments (Gubin et al 2005). In this case, the particles show no remanence after the biasing field is turned off. This unique behavior of MNPs is called superparamagnetism and the magnetization mechanisms are known as Brownian relaxation and Néel relaxation (Landau and Lifschitz 1975, Andrä and Nowak 1998). Based on these magnetic properties, there are three primary methods for detection of the magnetic signal emanating from the MNPs: remanence (Enpuku et al 2003a, Kawagishi et al 2004, Kotitz et al 1997, Tsukamoto et al 2005), relaxation (Chemla et al 2000, Grossman et al 2004, Haller et al 2001, Lange et al 2002, Lee et al 2002) and susceptibility (Enpuku et al 1999, 2001, Tanaka et al 2003) measurements. In all of these methods, the detection is based on changes in the magnetic field produced by the MNPs.
The remanence measurement was selected due to the higher sensitivity of NPs with less size dependence than the magnetic relaxation method. The Fe3O4 NPs used for remanence detection typically have an average diameter of 25 nm (Enpuku et al 2003a, Kawagishi et al 2004, Kotitz et al 1997, Tsukamoto et al 2005). Around this size, Brownian rotation occurs on the micro-second scale, which is not observable, whereas Néel relaxation can take many hours. Contrast arises when the NPs are bound to the target. Remanence measurement typically requires the movement of the sample to generate a magnetic signal change for the SQUID to detect. Instead of using lateral movement as previously reported (Kawagishi et al 2004, Tsukamoto et al 2005), our system utilizes vertical oscillation which frees the horizontal plane for translational scanning. A 1D scanning stage based on this remanence method is described in this paper with tentative studies on reconstructing the NPs’ distribution from the image. This method complements existing SQUID measurement techniques and excels due to its high sensitivity and portability.
2. Experimental procedures
2.1. SQUID setup
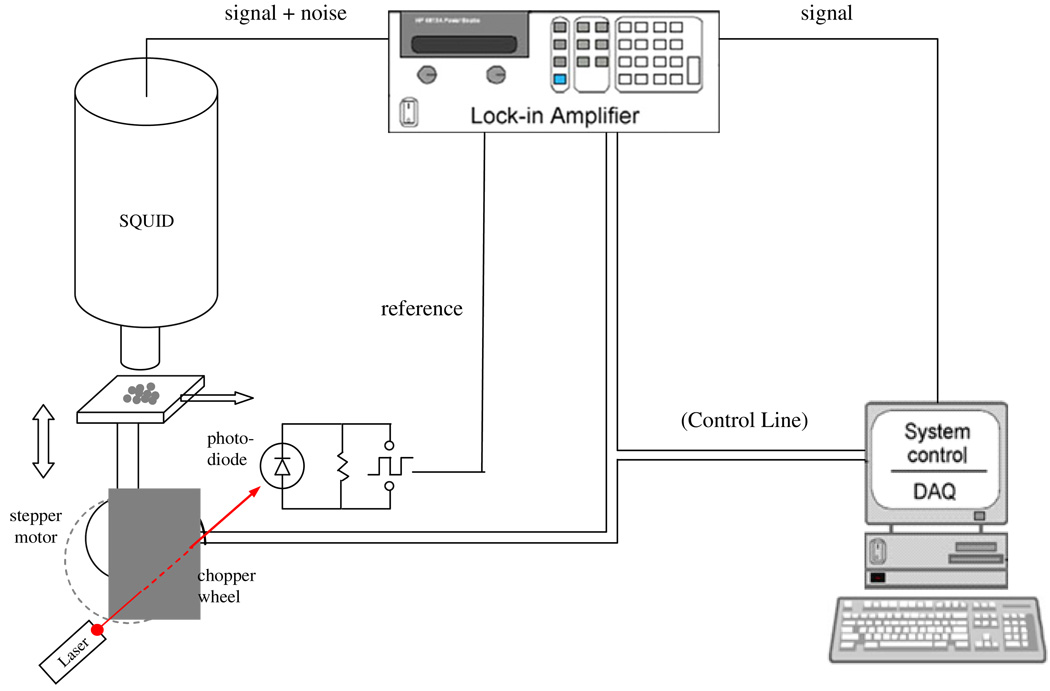
The SQUID used was Model 601 DC LTS, a second-order gradiometer system, provided by Tristan Technology Inc. Figure 1 shows a schematic diagram of the experimental setup. The sample was vertically oscillated and a lock-in amplifier was connected to the SQUID output to amplify the signal and filter out noise. Two stepping motors were used to create vertical oscillation and horizontal translation, respectively. One of the stepping motors rotated off-center, driving the sample containing MNPs to move up and down under the SQUID sensor at a chosen frequency (f). This motor has a semicircular chopper attached to its axle with a laser diode and a photodiode located on different sides of the chopper. The laser beam and the photodiode were aligned so that the photodiode could generate on/off states when the chopper rotated. Hence, a square wave of frequency (f) was formed and sent to the lock-in amplifier as the reference signal. The lock-in amplifier filters out noises at frequencies other than f. In the experiment, a vertical oscillation of the sample at 2 Hz with amplitude of 0.3 cm was used. The second stepping motor drives the translation stage, which moves the sample horizontally in one dimension, with a typical step size of 0.25 cm. Measurements were able to be performed without the use of an electromagnetically shielded room due to the noise rejection of the phase sensitive detection.
Figure 1.
Schematic representation of the remanence experimental setup that uses vertical oscillation to generate magnetic field change and uses the horizontal direction for translation.
The lock-in amplifier applies a low-pass filter with a 3 Hz cutoff to the signal generated by the SQUID to remove the interference from the power cables (60 Hz and its harmonics) and random events. The time constant was set to 3 s to ensure sufficient time for the low-pass filter to achieve equilibrium. The system was fully controlled by a computer through a Lab View interface. During the movement of the translation stage from one location to another, the data acquisition was suspended for about 20 s and resumed when the lock-in amplifier reached equilibrium.
2.2. Dry nanoparticle preparation
γ-Fe2O3 (99+%, Alfa Aesar, USA) NPs with an average diameter of 25 ± 19 nm were used. NPs were suspended in deionized water and vortexed to achieve good dispersion. Serial dilutions were prepared and each was loaded onto a piece of 0.5 × 0.5 cm2 filter paper. The loaded filter paper was magnetized in the vertical direction under a 1 T magnetic field for approximately 30 s by using a permanent magnet. The residual magnetization was measured by SQUID. The samples prepared in this way were used for quantitative calibration.
The spatial resolution study used samples prepared in the same way. Filter paper with different areas, 1 × 1 cm2 and 0.2 × 0.2 cm2, were scanned instead of testing the influence of sample size. The 1D scanning stage translated the samples at a step size of 0.25 cm and at each position the signal was averaged over 15 measurements before moving on.
2.3. Tissue mimicking phantom measurements
To represent tissue imaging conditions, a cylindrical tissue sample (hotdog) was used as a phantom. A small volume (5 µL or less) of NP fluid was injected by a microsyringe into selected sites. A phantom segment (3 cm long) was first magnetized and pre-scanned along its cylindrical axis before any injection of NPs. After NPs were injected, it was magnetized and scanned again and the pre-scan was subtracted to acquire the net signal. The injection sites were selected at lateral separations of 1, 1.5 and 2 cm and at depths of 0.5 and 1 cm below the upper surface.
3. Theoretical model
A theoretical model of the depth dependence of the remanence measurement has been developed. The x–z coordinate system and the angle θ are defined as shown in figure 2, changing from 0 to π representing a scan of sample along the x-axis. As a second-order gradiometer, the SQUID has three sets of pick-up coils, with diameters of 1 cm and negligible thickness in each set. Separations between adjacent sets are 5 cm. Distance between the Dewar’s inside bottom and the middle of the closest coil is 0.2 cm and D denotes the Dewar’s tail separation (0.9 cm). During sample’s oscillation, a and b are the nearest and farthest distances, respectively, between the sample and the Dewar’s bottom. Two assumptions were made.
The ensemble of magnetized NPs is regarded as a single magnetic moment.
The magnetic flux threading each coil is approximately equal to the product of the central field strength and the coil area.
Figure 2.
Schematic illustration of the theoretical model.
The magnetic field produced by a magnetic moment can be expressed as
| (1) |
In our case, the expression can be reduced to the z-component:
| (2) |
By multiplying the area and number of turns of each set of pick-up coils to this field (Bz) and considering the polarity of each set, the net flux can be calculated. The sample oscillation is simulated by changing the parameter h (figure 2). The flux achieves maximum and minimum values during the change. Half of the maximum and minimum difference is recorded as the signal amplitude. This amplitude is numerically calculated and compared with the SQUID measurement. Equation (2) has zeros at θ = 0.62 (<π/2) and 2.53 (>π/2) located on either side of the central peak, indicating that the signal minima will be detected around these two points. Note that the magnetic flux changes sign as scanning of NPs passes through the two minima, which means a π-phase shift in the lock-in amplifier phase reading.
4. Results and discussion
4.1. Calibration and sensitivity
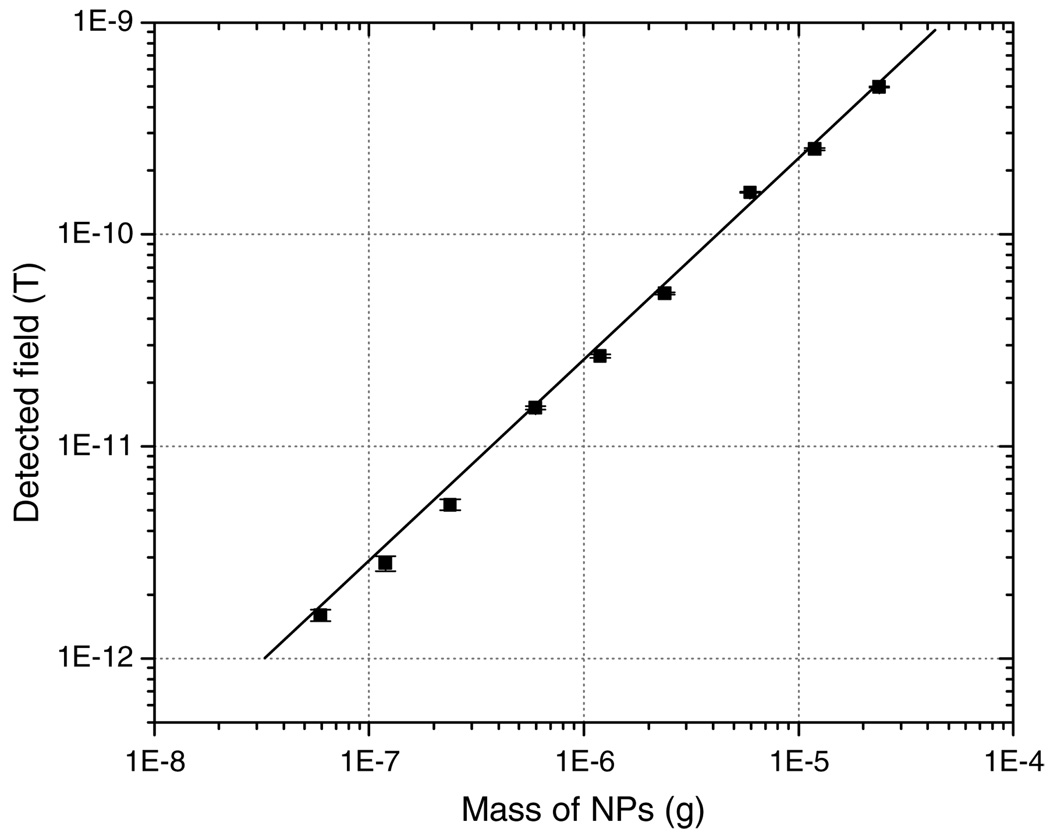
A series of Fe2O3 samples with various iron masses ranging from 42 ng to 17 µg were measured for calibration. A linear relationship (with coefficient of regression R2 = 0.98) between the mass of nanoparticles and the detected magnetic field was observed (figure 3). During the measurement, a constant background field of about (3 ±0.5) × 10−13 T was present. Therefore with a signal-to-noise ratio of 1, the minimum detectable limit was 10 ng of particles with the sample at a distance of 1.7 cm from the SQUID lowest coil. The distance is calculated by adding B and D (see section 3 and figure 2), the distance from the bottom of the Dewar to the equilibrium position of the oscillation. This sensitivity is similar to, or slightly better than, previously reported remanence methods (Kawagishi et al 2004, Tsukamoto et al 2005, Enpuku et al 2006).
Figure 3.
A calibration curve shows a linear relationship between the detected magnetic field and iron mass of Fe2O3 NPs. All data points were obtained by averaging over 60 measurements with background field of 3 × 10⁻¹³ T subtracted.
It is important to recognize that not all the NPs are observed in the measurement. Instead, only particles with relaxation time longer than the measurement time scale can be detected. In our experimental setup, the integration time of the lock-in amplifier is 3 s, which means that NPs with relaxation time shorter than 3 s make no contribution to the signal. In the application of the system to in vivo imaging, for the NPs bound to the target, they are immobilized and the magnetic moments decay through the Néel mechanism only, which is predicted by
| (3) |
where τ0 = 10−9 s and K is the magnetic anisotropy constant. Assuming the bulk γ-Fe2O3 K value (2.5 × 10⁴ J m−3) (Grossman et al 2004), the relaxation time of NPs with d = 25 nm is 3 × 10¹² s, meaning that these immobilized NPs provide measurable signals. For other particles that are not bound to any tissue, the Brownian mechanism dominates the relaxation process and has a time constant described by
| (4) |
where η is the medium viscosity and VH is the hydrodynamic volume. Taking the viscosity of water (η = 10−3 kg m−1 s−1), the NPs need to agglomerate to 2 µm in diameter (equivalently a cluster of 512 000 NPs) to achieve relaxation time around 3 s. Particles of this size are too large to be allowed in the body and will be filtered out. To avoid such agglomeration from occurring, an appropriate surfactant coating for better bio-compatibility needs to be applied to the NPs reducing the particle interaction, as has been achieved by our group (Shi et al 2008).
As long as the lock-in amplifier’s range did not change, the fluctuation of the detected signal was always about 0.5 × 10⁻¹³ T, independent of the sample’s mass. For higher fields arising from more particles, the SQUID signal exceeds the lock-in amplifier’s current range and a higher range must be used. Though this higher range of amplification results in larger standard deviations, the relative error (ratio of the standard deviation to the measuring range) remained constant. In all measurements, the SQUID was used with a gain corresponding to a conversion constant of 16.2 nT V−1. Although higher gains are available, they do not enhance the sensitivity because both signal and noise are increased by the same amount.
4.2. Lateral spatial resolution of the scanning system
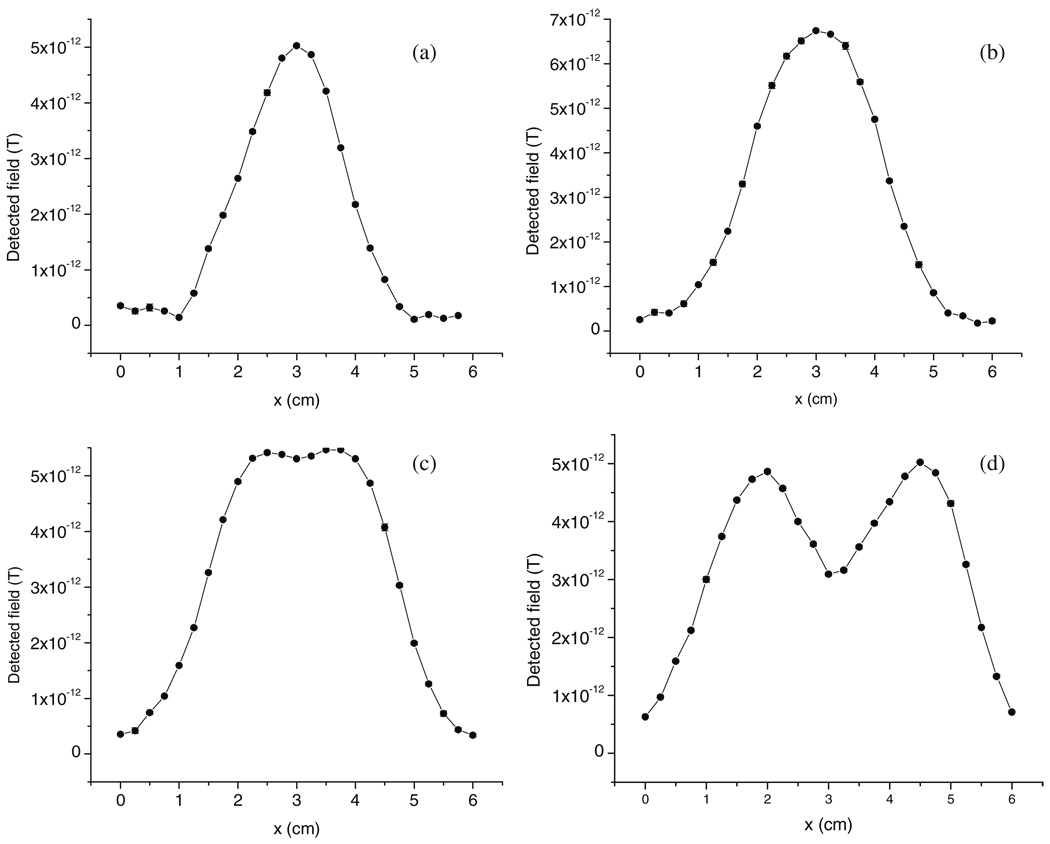
Two Fe2O3 NP samples with the same mass (300 ng in each) and area (∼1 × 1 cm2) were positioned with various separations and scanned under the SQUID system. The oscillation amplitude (0.3 cm) and the distance from the SQUID coil (1.7 cm) remained consistent. Figure 4(a) shows a typical profile over only one Fe2O3 NP sample. A large center peak as well as two side minima was observed. This agrees with the prediction of the theoretical model. The reason for the two minima was explained in section 3 and is due to the near zero magnetic flux threading the lowest pick-up coils. The half-peak width is approximately 2 cm, implying that the minimal identifiable distance between two samples should be about 2 cm. This prediction is confirmed by the SQUID measurements on samples with two spots at various separation distances, 1.5–2.5 cm from center to center. These samples were scanned along the line connecting their centers. The signals generated show that individual spots can only be identified when the center-to-center separation is larger than 2 cm, i.e. the edge-to-edge separation equals 1 cm (figures 4(b)–(d)). Smaller spots with areas approximately 0.2 × 0.2 cm2 were also tested. The measured results show the minimal edge-to-edge separation to again be 1 cm, suggesting that the spatial resolution limit is physically restricted by the pick-up coil size, which is 1 cm in diameter.
Figure 4.
(a) A typical scanning profile of a 300 ng Fe2O3 NP sample spot with a 1 × 1 cm2 sample area. Two similar sample spots (as in (a)) were scanned in-line at different separations: (b) 1.5 cm, (c) 2 cm and (d) 2.5 cm.
4.3. Correlation of peak width and NP position
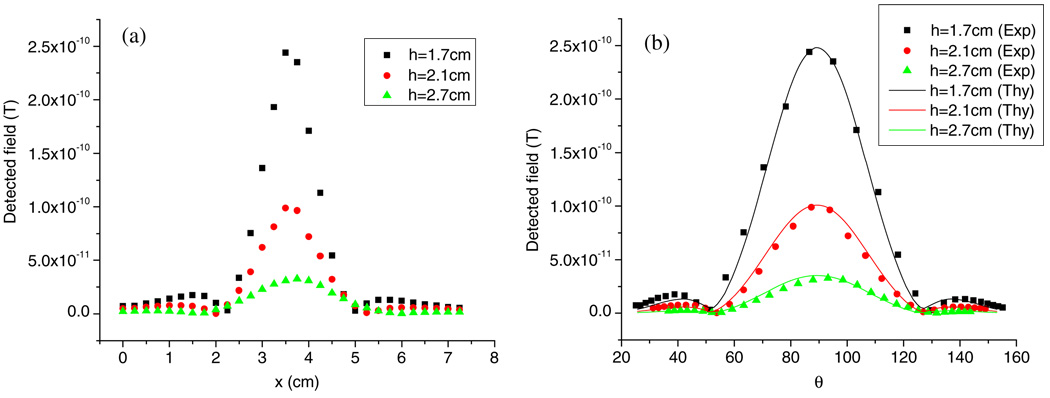
In the spatial resolution study when a single sample spot was scanned, a central signal peak with two subsidiary minima was generated. The peak width, defined as the separation of the two minima, was found to be dependent on the vertical distance between the sample and the SQUID pick-up coils. In order to have significant signal at a greater distance, 11.9 µg Fe2O3 NPs was measured with its oscillation center to the closest pick-up coil at 1.7, 2.1 and 2.7 cm while the oscillation amplitude was kept constant (0.3 cm). The peak widths were approximately 2.75, 3.25 and 4 cm, respectively. The scanned curves are shown in figure 5(a), where larger distance results in wider central peak.
Figure 5.
Relationship between the scanned peak width and NPs’ vertical position. (a) Experimental data when the sample to pick-up coil distances are 1.7, 2.1 and 2.7 cm; (b) theoretical fittings (solid lines) are consistent with experimental data (dots).
To compare the experimental data with the theoretical predictions, the x-position was converted into the angle θ as defined in section 3 and re-plotted in figure 5(b) (represented by dots). Simulations were performed at these vertical sample-to-coil distances (h = 1.7, 2.1 and 2.7 cm) using the parameters in the system setup. Due to the unknown magnetic remnant moment of the NPs, a common factor was used to normalize all three simulated curves to agree with the experimental data. The fitting results are shown in figure 5(b) by solid lines. Based on this calculation and the mass of the NPs used, the remnant mass magnetization of the Fe2O3 NPs was estimated to be 1.1 emu g−1. As can be seen from the plot, the angle spanned by the minima is almost constant, which agrees with the model because of the vanishing Bz field. Further computation with larger ranges of vertical sample-to-coil distance (h = 1.3–3 cm) shows that the angle changes within the range of 52.2–52.8°, with a minimum at h = 1.85 cm. This near-constant span angle dictates that the wider peak in terms of distance along the scan direction implies that the sample is farther away from the detector.
This remanence estimation will contain uncertainty due to the model’s assumptions. The finite sample area, the non-uniformity of field threading, the pick-up coils and the lock-in amplifier’s gain will all contribute to this uncertainty. However, due to the constancy of the normalization factor, the measurements can be calibrated with standard samples. Since the NPs’ position relates to the scanned peak maximum and width, the determination of the particles’ position and mass will be unique.
4.4. Reconstruction of NPs’ distribution from images
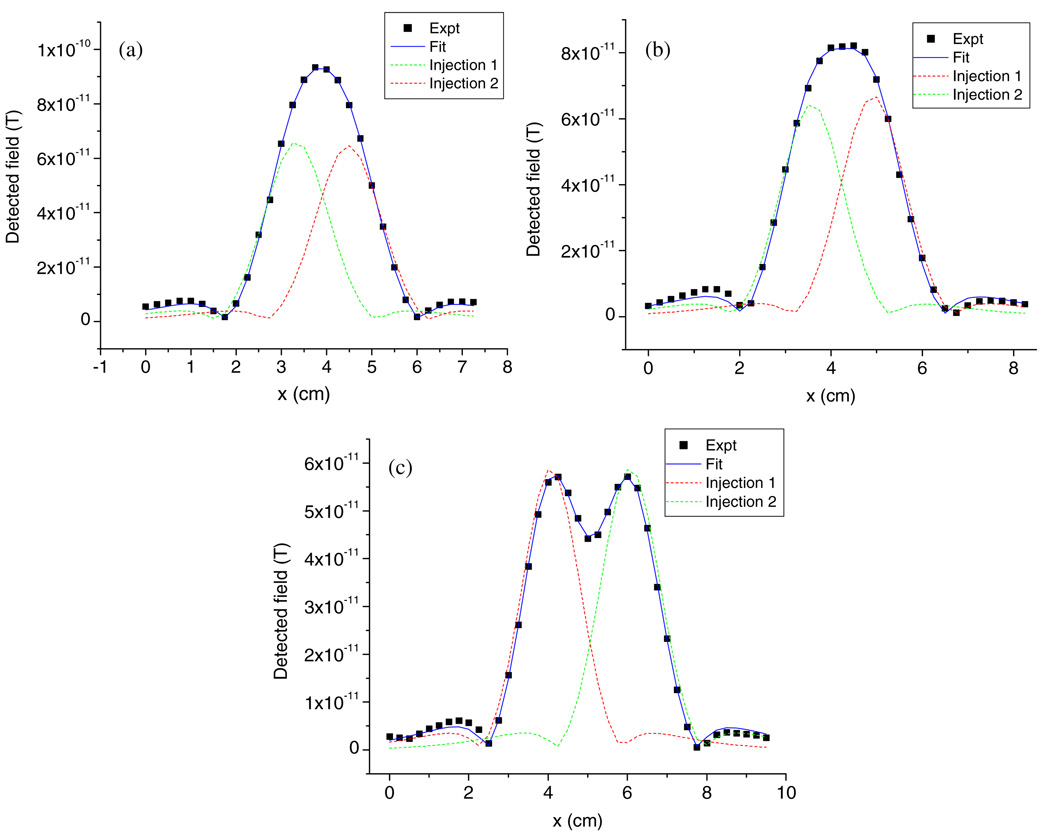
To resolve NPs not only in the lateral direction but also at different depths, hotdog phantoms were used as matrices and injected with NPs at two points. In the first study, a 5 µL injection containing 10 µg NPs was injected at 0.5 cm below the upper surface with separations at 1, 1.5 and 2 cm. During the SQUID measurement, the distance from the lowest coils to the upper surface was kept the same as before (1.7 cm). This distance was subtracted from the z-distance parameter determined by the model to calculate the actual depth of the NPs in the sample. Pre-scan curves were subtracted from the scan results, and net signals are plotted in figure 6. To fit the experimental data, the model needs to incorporate two NP sources simultaneously. One cannot simply add individual curves together because signals from the two sources are not always in phase. Instead, the Levenberg-Marquardt algorithm was applied until the best fitting was achieved. In figure 6, the solid lines are the best fittings after considering that both sources and the dashed lines represent signals from single sources in the absence of the other. In the regions where their central and shoulder peaks overlap, they are in phase and reinforce each other.
Figure 6.
Phantom study of the same amount of Fe2O3 NP injection (10 µg) at different lateral separations (a) 1 cm, (b) 1.5 cm and (c) 2 cm below the upper surface by 0.5 cm.
The fitting results are summarized in table 1. When the lateral separation of the injections is larger than the spatial resolution limit of the SQUID scanning system (cases b and c), one can tell from the resultant curves (figures 6(b) and (c)) that there are more than one NP injection in the phantoms. To fit the curves, it is necessary that two remanence sources are used in the model and the results match the experimental controls. As the separation decreases down to 1 cm, within the resolution limit, only a single peak is observed. Two scenarios need to be evaluated: one injection and two injections to figure out which case is more reasonable. If one remanence source is considered in the model, the fitting residuals are five times higher than assuming two sources, suggesting that the two-injection assumption is closer to the real case. The fitting results with one injection turn out to be 1.32 cm in depth and 47.31 µg in amount. Since we know that the total injected amount of NPs is 20 µg (table 1), which is much less than 47.31 µg, the possibility of one injection can be ruled out.
Table 1.
Phantom study of the same amount of NP injection at different separations.
| Experimental controls | Fitting results | ||||||
|---|---|---|---|---|---|---|---|
| Lateral separation (cm) |
Depth in phantom (cm) |
Amount of NPs (µg) |
Lateral separation (cm) |
Depth in phantom (cm) |
Amount of NPs (µg) |
||
| Case a | Injection 1 | 1 | 0.5 | 10 | 3.33 | 0.57 | 9.76 |
| Injection 2 | 0.5 | 10 | 4.45 | 0.61 | 10.33 | ||
| Case b | Injection 1 | 1.5 | 0.5 | 10 | 3.55 | 0.52 | 8.67 |
| Injection 2 | 0.5 | 10 | 4.93 | 0.57 | 9.85 | ||
| Case c | Injection 1 | 2 | 0.5 | 10 | 4.08 | 0.59 | 9.17 |
| Injection 2 | 0.5 | 10 | 6.07 | 0.64 | 10.69 | ||
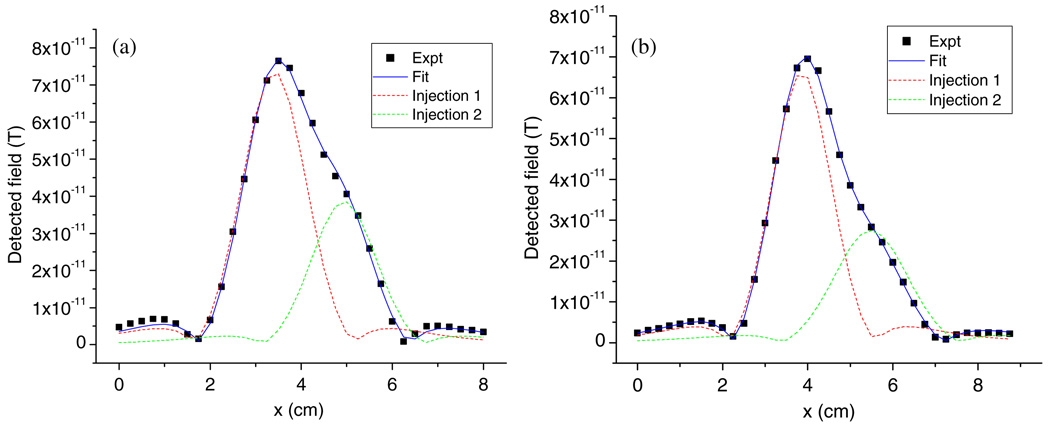
Since the peaks in the SQUID image can be affected by both the mass of the NPs and the vertical distance to the pick-up coils, similar scanning peaks may be observed due to fewer NPs that are positioned nearer the detector, as compared with more NPs that are farther away. Our image fitting algorithm is able to discriminate between these two cases. To demonstrate this, one phantom was injected at two spots with 10 µg and 5 µg Fe2O3 NPs at a depth of 0.5 cm below the upper surface. A second phantom was prepared by injecting two locations both with 10 µg: one injection was at a depth of 0.5 cm and the other at a depth of 1 cm. The horizontal separation of the injections in both cases was 1.5 cm. The data dots in figure 7 display similar scanning patterns acquired from these two phantoms both having a smaller peak on the right side of the major one. One of them is generated by the phantom with spots having different NP masses (figure 7(a)), while the other one is due to the phantom that had the NPs at different depths (figure 7(b)). By comparing these two curves, we can differentiate between them. On the right side of the major peak (the lower portion), figure 7(b) has a larger shoulder than figure 7(a), implying a wider peak generated by the second injection spot in (b). Due to the near-constant span angle, this wider peak means the second injection is deeper than (a). The fitting parameters supported the observation and quantitatively determined the difference of the two cases: the NP injections on the right side are 5.92 µg at 0.58 cm deep and 8.82 µg at 1.03 cm, respectively (table 2).
Figure 7.
Phantom study of different amounts of Fe2O3 NP injection at the same lateral separation (1.5 cm). (a) 10 µg and 5 µg both at 0.5 cm below the upper surface; (b) 10 µg at 0.5 cm and 1 cm below the upper surface, respectively.
Table 2.
Phantom study of different amounts of NP injection at different depths.
| Experimental controls | Fitting results | ||||||
|---|---|---|---|---|---|---|---|
| Lateral separation (cm) |
Depth in phantom (cm) |
Amount of NPs (µg) |
Lateral separation (cm) |
Depth in phantom (cm) |
Amount of NPs (µg) |
||
| Case a | Injection 1 | 1.5 | 0.5 | 10 | 3.40 | 0.56 | 10.62 |
| Injection 2 | 0.5 | 5 | 4.94 | 0.58 | 5.92 | ||
| Case b | Injection 1 | 1.5 | 0.5 | 10 | 3.88 | 0.52 | 8.86 |
| Injection 2 | 1.0 | 10 | 5.48 | 1.03 | 8.82 | ||
These experiments to reconstruct the NPs’ distribution in phantoms illustrate the ability of SQUID measurement to capture both the amount and position of the magnetic field generated by the source. Further studies will expand the scanning system into two dimensions and incorporate the influence of source size for the SQUID imaging system to be a feasible tool in the in vivo cancer detection.
5. Conclusions
A 1D scanning SQUID remanence measurement system has been developed for detecting nanogram amounts of MNPs as in vivo contrast agents. This method achieves good noise reduction ability by using phase lock detection, thus leading to high sensitivity (10 ng of the 25 nm Fe2O3 NPs can be detected at a distance of 1.7 cm). Based on this system, a theoretical model was developed which exhibits excellent agreement with the experiments. The model also suggests a way to locate the NPs in tissue and quantitatively determines the amount, providing a means for detection of early stage tumors and thereby offering an alternative imaging technique for clinical applications.
Acknowledgments
This project has been funded in whole or in part by the National Institutes of Health (NIH) (under the contract nos NIH 1 RO1 EB002657, NOI-CO-97111 and NIH 1 RO1 CA119409) and the Michigan Economic Development Corporation-Life Sciences Corridor Fund (under award GR-472).
References
- Andrä W, Nowak H. Magnetism in Medicine. Berlin: Wiley-VCH; 1998. [Google Scholar]
- Brittenham GM, Farrell DE, Harris JW, Feldman ES, Danish EH, Muir WA, Tripp JH, Bellon EM. Magnetic-susceptibility measurement of human iron stores. New Engl. J. Med. 1982;307:1671–1675. doi: 10.1056/NEJM198212303072703. [DOI] [PubMed] [Google Scholar]
- Chemla YR, Crossman HL, Poon Y, McDermott R, Stevens R, Alper MD, Clarke J. Ultrasensitive magnetic biosensor for homogeneous immunoassay. Proc. Natl Acad. Sci. USA. 2000;97:14268–14272. doi: 10.1073/pnas.97.26.14268. [DOI] [PMC free article] [PubMed] [Google Scholar]
- Cohen D. Ferromagnetic contamination in lungs and other organs of human body. Science. 1973;180:745–748. doi: 10.1126/science.180.4087.745. [DOI] [PubMed] [Google Scholar]
- Enpuku K, Kuroda D, Ohba A, Yang TQ, Yoshinaga K, Nakahara T, Kuma E, Hamasaki N. Biological immunoassay utilizing magnetic marker and high T-c superconducting quantum interference device magnetometer. Japan. J. Appl. Phys. 2003a;42:L1436–L1438. [Google Scholar]
- Enpuku K, Kuroda D, Yang TQ, Yoshinaga K. High Tc SQUID system and magnetic marker for biological immunoassays. IEEE Trans. Appl. Supercond. 2003b;13:371–376. [Google Scholar]
- Enpuku K, Minotani T, Gima T, Kuroki Y, Itoh Y, Yamashita M, Katakura Y, Kuhara S. Detection of magnetic nanoparticles with superconducting quantum interference device (SQUID) magnetometer and application to immunoassays. Japan. J. Appl. Phys. 1999;38:L1102–L1105. [Google Scholar]
- Enpuku K, Minotani T, Hotta M, Nakahodo A. Application of high T-c SQUID magnetometer to biological immunoassays. IEEE Trans. Appl. Supercond. 2001;11:661–664. [Google Scholar]
- Enpuku K, Soejima K, Nishimoto T, Kuma H, Hamasaki N, Tsukamoto A, Saitoh K, Kandori A. Quantitative evaluation of magnetic immunoassay with remanence measurement. Supercond. Sci. Technol. 2006;19:S257–S260. [Google Scholar]
- Grossman HL, Myers WR, Vreeland VJ, Bruehl R, Alper MD, Bertozzi CR, Clarke J. Detection of bacteria in suspension by using a superconducting quantum interference device. Proc. Natl Acad. Sci. USA. 2004;101:129–134. doi: 10.1073/pnas.0307128101. [DOI] [PMC free article] [PubMed] [Google Scholar]
- Gubin SP, Koksharov YA, Khomutov GB, Yurkov GY. Magnetic nanoparticles: preparation methods, structure and properties. Usp. Khim. 2005;74:539–574. [Google Scholar]
- Haller A, Matz H, Hartwig S, Kerberger T, Atzpadin H, Trahms L. Low T-c SQUID measurement system for magnetic relaxation immunoassays in unshielded environment. IEEE Trans. Appl. Supercond. 2001;11:1371–1374. [Google Scholar]
- Kawagishi K, Itozaki H, Kondo T, Komori K, Kotitz R. Detection of fine magnetic particles coated on a thread using an HTS-SQUID. Physica. 2004;C 412–114:1491–1495. [Google Scholar]
- Kotitz R, Matz H, Trahms L, Koch H, Weitschies W, Rheinlander T, Semmler W, Bunte T. SQUID based remanence measurements for immunoassays. IEEE Trans. Appl. Supercond. 1997;7:3678–3681. [Google Scholar]
- Landau LD, Lifschitz EM. Electrodynamics of Continuous Media. Oxford: Pergamon; 1975. [Google Scholar]
- Lange J, Kotitz R, Haller A, Trahms L, Semmler W, Weitschies W. Magnetorelaxometry—a new binding specific detection method based on magnetic nanoparticles. J. Magn. Magn. Mater. 2002;252:381–383. [Google Scholar]
- Lee S, Myers WR, Grossman HL, Cho HM, Chemla YR, Clarke J. Magnetic gradiometer based on a high-transition temperature superconducting quantum interference device for improved sensitivity of a biosensor. Appl. Phys. Lett. 2002;81:3094–3096. [Google Scholar]
- Mahdi AE, Mapps DJ. High-T-c SQUIDs: the ultra sensitive sensors for non-destructive testing and biomagnetism. 2nd European Conf. on Magnetic Sensors and Actuators; Sheffield, England: Elsevier; 1998. pp. 367–370. [Google Scholar]
- McCarthy JR, Weissleder R. Multifunctional magnetic nanoparticles for targeted imaging and therapy. Adv. Drug Deliv. Rev. 2008;60:1241–1251. doi: 10.1016/j.addr.2008.03.014. [DOI] [PMC free article] [PubMed] [Google Scholar]
- Shi XY, Wang SH, Swanson SD, Ge S, Cao ZY, Van Antwerp M, Landmark KJ, Baker JR. Dendrimer-functionalized shell-crosslinked iron oxide nanoparticles for in vivo magnetic resonance imaging of tumors. Adv. Mater. 2008;20:1671–1678. [Google Scholar]
- Sun C, Lee JSH, Zhang MQ. Magnetic nanoparticles in MR imaging and drug delivery. Adv. Drug Deliv. Rev. 2008;60:1252–1265. doi: 10.1016/j.addr.2008.03.018. [DOI] [PMC free article] [PubMed] [Google Scholar]
- Tanaka S, Mizoguchi T, Ota H, Kondo Y. Lymph-node detection system using a high T-c SQUID and ultra-small particles. IEICE Trans. Electron. 2002;E85 C:687–690. [Google Scholar]
- Tanaka S, Ota H, Kondo Y, Tamaki Y, Kobayashi S, Noguchi S. Detection of magnetic nanoparticles in lymph nodes of rat by high T-C SQUID. IEEE Trans. Appl. Supercond. 2003;13:377–380. [Google Scholar]
- Tsukamoto A, et al. Development of multisample biological immunoassay system using HTS SQUID and magnetic nanoparticles. IEEE Trans. Appl. Supercond. 2005;15:656–659. [Google Scholar]
- Wang SH, Shi XY, Van Antwerp M, Cao ZY, Swanson SD, Bi XD, Baker JR. Dendrimer-functionalized iron oxide nanoparticles for specific targeting and imaging of cancer cells. Adv. Funct. Mater. 2007;17:3043–3050. [Google Scholar]
- Weitschies W, Kotitz R, Bunte T, Trahms L. Determination of relaxing or remanent nanoparticle magnetization provides a novel binding-specific technique for the evaluation of immunoassays. Pharm. Pharmacol. Lett. 1997;7:1–7. [Google Scholar]


