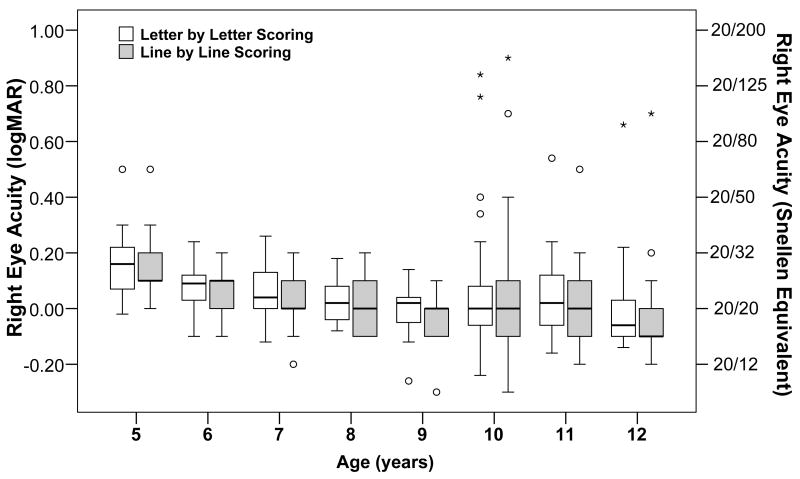
Figure 1.
Box plots of visual acuity results for each age group, plotted as logarithm of the minimum angle of resolution (logMAR), with Snellen equivalent values provided on the right-hand axis. At each age, results are shown for letter by letter scoring (in which visual acuity is based on the total number of letters correctly identified when the child is asked to read all letters on the Early Treatment Diabetic Retinopathy Study (ETDRS) chart), and for line by line scoring (in which visual acuity is based on the last line on which the child correctly identified at least three letters). The median is identified by a line inside the box. The length of the box is the inter-quartile range (IQR) (25% to 75%). Values more than three IQR’s from the end of a box are labeled as extreme, denoted with an asterisk (*), and values more than 1.5 IQR’s but less than 3 IQR’s from the end of the box are labeled as outliers (o). Whiskers represent the maximum and minimum values excluding outliers.

