Abstract
The specific membrane capacitance and conductivity of mammalian cells, which reflect their surface morphological complexities and membrane barrier functions, respectively, have been shown to respond to cell physiologic and pathologic changes. Here, the effects of induced apoptosis on these membrane properties of cultured human promyelocytic HL-60 cells are reported. Changes in membrane capacitance and conductivity were deduced from measurements of cellular dielectrophoretic crossover frequencies following treatment with genistein (GEN). The apparent specific cell membrane capacitance of HL-60 cells fell from an initial value of 17.6±0.9 to 9.1±0.5 mF/m2 4 h after treatment. Changes began within minutes of treatment and preceded both the externalization of phosphatidylserine (PS), as gauged by the Annexin V assay, and the appearance of a sub-G1 cell subpopulation, as determined through ethidium bromide staining of DNA. Treatment by the broad spectrum caspase inhibitor N-benzyloxycarbony-Val-Ala-Asp(O-methyl)-fluoromethyketone (zVAD-fmk) did not prevent these early cell membrane dielectric responses, suggesting that the caspase system was not involved. Although membrane conductivity did not alter during the first 4 h of GEN treatment, it rose significantly and progressively thereafter. Finally, as the barrier function failed and the cells became necrotic, it increased by many orders of magnitude. The effective membrane capacitance and conductivity findings serve to focus attention on the membrane as a site for early participation in apoptosis. In conjunction with our prior reports of the use of dielectric methods for cell manipulation and separation, these results demonstrate that dielectrophoretic technologies should be applicable to the rapid detection, separation, and quantification of normal, apoptotic, and necrotic cells from cell mixtures.
Keywords: Apoptosis, Dielectrophoresis, Membrane capacitance, Membrane conductance, DEP crossover method, Detection of apoptotic cells
1. Introduction
In recent years, apoptosis has attracted increasing attention. In particular, its study has led to the development of new strategies for cancer chemotherapy [1]. One area of intense interest is the earliest detectable, obligatory events that precede caspase activation. Identification of such events would contribute to a more complete understanding of the initiation of apoptosis, and perhaps provide additional targets for its modification and detection. Among the many differences between normal cells and those undergoing apoptosis, one consistently observed alteration has been at the plasma membrane [2] where cells exposed to an apoptotic initiator show loss of structural features such as microvilli, and later, the formation of blebs [3,4]. Downregulation of phospholipid translocase and activation of nonspecific lipid scram-blase have been reported [5,6] to catalyze rapid bi-directional trans-bilayer movement of phospholipids with resultant randomization of the lipid distribution. These effects destroy the normal compositional asymmetry between the inner and outer leaflet, causing the externalization of phosphatidylserine (PS) [7], which may be revealed by the Annexin V assay, and used as an index for apoptosis. Various apoptosis-inducing agents rapidly modify the transport properties of the channels that control transmembrane ion fluxes [8], leading to the suggestion that such flux perturbations alter the cytoplasmic pH, activate phospholipase, and trigger the production of ceramide, an important messenger in apoptosis [9]. Because of these findings, attention has been focused upon an early and potentially obligatory role for plasma-membrane-associated mechanisms in apoptosis.
Dielectrophoresis (DEP) is the movement of particles, for example, cells, in inhomogeneous electrical fields based on differences in the permittivities of the particles and their surroundings [10–13]. The study of cellular DEP responses as a function of the frequency of the applied electrical field allows cell membrane capacitance and conductivity to be deduced with single cell discrimination. It has been shown previously that these membrane dielectric properties are highly characteristic of, and rapidly affected by, alterations in physiological activities and induction of pathologic states in cells [14–20]. Such differences can be not only used for cell characterization, but also exploited for selective cell manipulation, separation and sorting [21–24]. For this reason, we have examined the changes in cell membrane dielectric properties accompanying induced apoptosis to discover if they: (1) suggest an early role of the plasma membrane in the apoptotic cascade, and (2) if such changes could be used to discriminate between, manipulate and separate apoptotic and necrotic cells from normal cells, including those of the blood.
To achieve these goals, we have studied the exposure of the human myelogenous HL-60 cell line to genistein (GEN) as a model system. GEN, a topoisomerase and tyrosine protein kinase inhibitor, induces apoptosis at all phases of the HL-60 cell cycle [25,26]. Introduced into HL-60 cell cultures at a concentration of 100 μg/ml, GEN induces a progressively increasing hypodiploid sub-G1 population after 4 h, whereas cell membrane integrity is maintained until after approximately 8 h when the cells become necrotic [25,27]. We investigated the dielectric properties of the cells by the DEP crossover method [17,28] in which cells are suspended in a low-conductivity, isotonic solution and subjected to an inhomogeneous AC electrical field that causes them to experience translational DEP forces. At low-AC field frequencies, cells are repelled from the electrodes, whereas at high frequencies, they become attracted toward electrode edges. At a particular, intermediate crossover frequency, fcrossover, the dielectric properties of the cell and the suspending solution balance and the cells experience no net force. This frequency can be easily determined by observing the reversal of cell motion as the frequency is adjusted.
We correlated the cell dielectric properties deduced from these measurements with DNA content and PS externalization as a function of time for the first 8 h after treatment, and also with scanning electron microscopic (SEM) examinations of the evolution of the cell surface morphology. The broad-spectrum caspase inhibitor N-benzyloxycarbony-Val-Ala-Asp(O-methyl)-fluoromethyketone (zVAD-fmk) was used in some cultures to block the apoptotic process, which allowed us to determine that the changes in cell dielectric properties started early in the apoptotic process and preceded caspase activation. Our results show that DEP methods have potential for early detection and separation of apoptotic, necrotic, and normal cells, and for the quantification of an apoptotic population in a cell mixture.
2. Materials and methods
2.1. Cell culture and chemicals
Cells of the human myelogenous leukemia cell line HL-60 were seeded at 1.6×10⁵ cells/ml and grown in 10 ml of RPMI medium supplemented with 10% fetal bovine serum, 1 mM glutamine and 20 mM Hepes buffer (Gibco, Grand Island, NY). Cell cultures were maintained in 25 cm2 vented culture flasks (Greiner, Germany) at 37 °C under a 5% CO2/95% air atmosphere in a humidified incubator. Cells growing in mid-log phase were used 48 h after seeding when the cell concentration had reached ~0.8×10⁶ cells/ml. Cell viability was above 98% as judged by trypan blue dye exclusion. Fresh stock solutions of GEN (G-6776, Sigma, St. Louis, MO) and zVAD-fmk (FK-009, Enzyme Systems Products, Livermore, CA) were prepared in DMSO at a concentration of 5 mg/ml and 20 mM, respectively. To induce apoptosis, a 1:50 dilution of the GEN stock solution was added to the cell culture to give a final GEN concentration of 100 μg/ml. In some cultures, 0.5 μl/ml of the zVAD-fmk stock solution was added at 0.5 h before and 2.5 h after the addition of GEN, to inhibit caspase activation. Treated cultures were maintained alongside control samples in an incubator and aliquots of each were withdrawn when needed for measurements.
2.2. Cell DNA analysis and the Annexin V assay
To study the changes in the cell DNA content histogram, aliquots of ~106 cells were removed from control and GEN-treated HL-60 cultures at appropriate times, centrifuged at 223×g for 10 min at 4 °C, resuspended in 200 μl ice-cold phosphate-buffered saline (PBS), fixed by the addition of 2 ml ice-cold 70% ethanol, and left for at least 1 h at 4 °C. After fixation, cells were washed once at 223×g for 10 min at 4 °C, and resuspended in 800 μl ice-cold PBS containing 0.5% Triton X-100 (T8787, Sigma). Then, 40 μl of 2.5 mg/ml Rnase A (50 u/mg, Boehringer Mannheim, Germany) and 160 μl of 250 μg/ml propidium iodide (PI) (P-4170, Sigma) were added, and samples were incubated at 37 °C for at least 30 min. Aliquots of cells were also removed from control and GEN-treated HL-60 cultures at appropriate times and stained with Annexin V (APOPTEST™-FITC, cat. no.: A700, Nexins Research, 4474 ND Kattendijke, The Netherlands) following the standard protocol from the company. The stained samples were investigated with a Bryte HS™ flow cytometer (Bio-Rad Microscience, Hemel Hempstead, UK).
2.3. DEP crossover frequency measurements
The electrode chamber was fabricated by gluing a 15 mm diameter×1 mm thick O-ring over a glass substrate that supported the DEP electrode array patterned by standard photolithography as described previously [29]. The electrode array was comprised of plain parallel elements connected alternately to bus lines on either side of the substrate. The parallel elements were 12 mm long, 100 μm wide, and separated by 100-μm gaps. To make DEP crossover frequency measurements, a 3-V peak-to-peak sinusoidal signal (HP 8116A, Hewlett-Packard, Palo Alto, CA) was applied to the electrode array.
The cell sample was diluted in isotonic (280 mOs/kg) 8.5% (wt./wt.) sucrose plus 0.3% (wt./wt.) dextrose buffer adjusted to the desired conductivity with RPMI. For each experiment, 180 μl of cell suspension was pipetted into the chamber and a cover slip was gently pressed over the center to form a full, sealed chamber so as to prevent cells from drifting during measurement. After cells had settled, the electrical field was turned on. Cell movement was measured under a Nikon Diaphot TMD inverted microscope equipped with a CCD video camera and monitor. The crossover frequency of randomly chosen individual cells was recorded as the frequency at which their DEP-induced motion changed direction. The diameter of each cell was measured from the video monitor and calibrated against a stage micrometer. Unless specified otherwise, the crossover frequencies and diameters for 20 cells were determined in less than 20 min for each condition studied.
For cells like HL-60 whose dielectric responses are well described by the Single Shell model [17,30,31], the product of the cell radius and crossover frequency, r×fcrossover, is an approximately linear function of medium conductivity, σmed, for 0.01<σmed<0.2 S/m. The effective specific membrane capacitance, Cmem=(εmem)/d, and conductance, Gmem=(σmem)/d, where d is the membrane thickness, and εmem and σmem are the membrane permittivity and conductivity, are derived from the slope and σmem axis intercept of the linear dependency by the following relations [18,28]:
| (1) |
and
| (2) |
In this study, we followed r×fcrossover at a medium conductivity of 0.056 S/m from 0 to 8 h following the GEN treatment of cells, and measured r×fcrossover as a function of medium conductivity at 0, 1, 2, and 4 h to derive the plasma membrane capacitance and conductance values.
2.4. Scanning electron microscopy
Cells from control and treated cultures were washed in serum-free RPMI at 223×g for 10 min at room temperature and resuspended in 8.75% (wt./wt.) sucrose solution (280 mOs/kg) for 15 min. Cells were then centrifuged and fixed at 37 °C in modified Karnovsky’s fixative (280 mOs/kg, pH 7.5) for at least 30 min. Cell specimens were examined using a scanning electron microscope (Model S520, Hitachi Denshi, Tokyo, Japan). Each specimen was first scanned to evaluate the cell size and morphological distribution. Then images of representative cells were recorded at a direct magnification of ×1000 to ×5000 onto Polaroid films (Polaroid, Medical Products, Cambridge, MA).
3. Results
3.1. HL-60 cells undergo apoptotic death after GEN treatment
After adding GEN at 100 μg/ml to HL-60 cell cultures, cell viability remained above 90% for up to 8 h, as determined using the trypan blue dye-exclusion method. The results for DNA content as studied by flow cytometry are presented in Fig. 1. Cells undergoing apoptosis can be recognized by their diminished susceptibility to staining with PI, resulting in a sub-G1 peak in the DNA frequency histogram [25]. At 2 h post-GEN treatment, there was no significant evidence of this alteration in treated cells. However, the sub-G1 population increased thereafter from ~22% of the total cells at 4 h, to ~26% at 6 h, ~45% at 8 h, and ~52% at 10 h. We also observed a decrease in forward light scattering beginning at 2 h post-treatment, but no alteration of side scattering, indicating a reduction in cell size. These results are consistent with previous studies of the characteristics of HL-60 cells undergoing apoptosis [25,32] and indicate that in our cultures, GEN-induced apoptosis of HL-60 cells proceeded in accord with published reports.
Fig. 1.
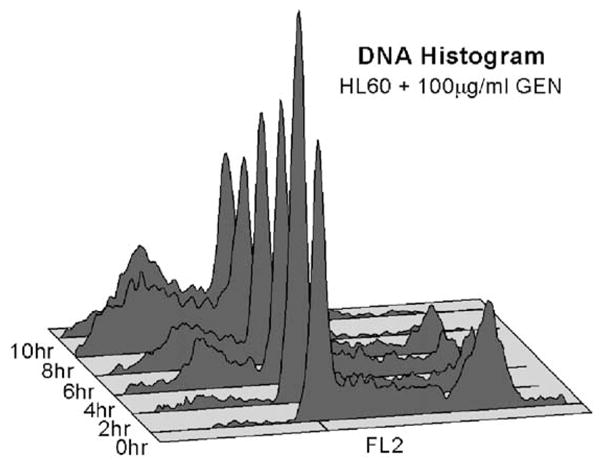
Flow cytometry study of DNA content histograms for HL-60 cells showing cell frequency versus DNA content from 0 to 10 h after 100 μg/ml GEN treatment.
A study with the PS-binding protein Annexin V (Fig. 2) is also consistent with earlier reports. Apoptotic cells have significant translocation of PS to the out leaflet of cell membrane, and will be stained by Annexin V. We found that the number of Annexin V positive cells 1 h post-treatment was not significantly different from that of control cells, and only became so 2 h after treatment. Specifically, Annexin V positive cells represented ~5.7% of the whole cell population, at both 0 and 1 h. This proportion increased to 22.3% at 2 h post-treatment, 27.2% at 3 h, 47.9% at 4 h, 56.7% at 5 h, and 62.4% at 6 h.
Fig. 2.
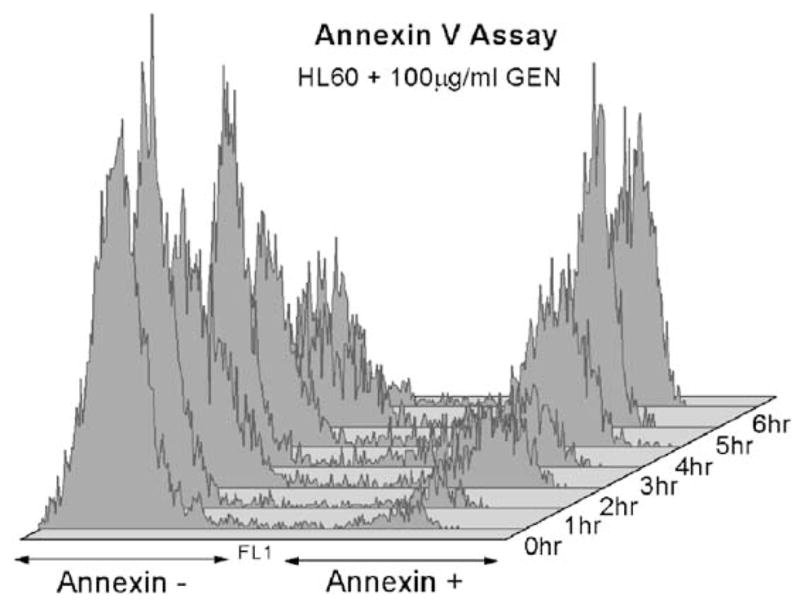
Flow cytometry results of the Annexin V assay on HL-60 cells from 0 to 6 h after 100 μg/ml GEN treatment. A significant Annexin V-positive subpopulation relative to 0 h begins to appear at 2 h.
3.2. The DEP crossover frequency increases as apoptosis progresses and the change precedes caspase activation
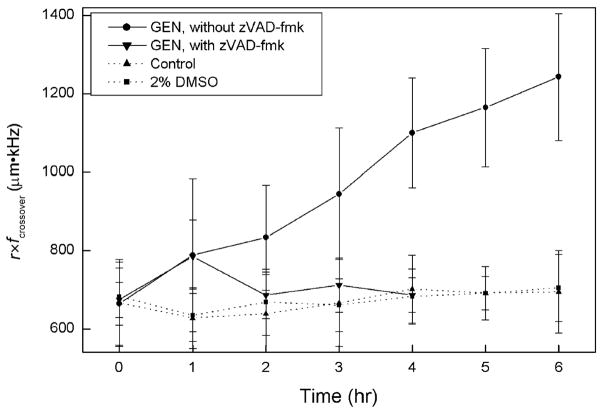
Fig. 3 shows the mean and standard deviation of the product of crossover frequency and cell radius at a medium conductivity of 0.056 S/m as a function of time for untreated and GEN-treated HL-60 cells. Each data point represents 20 individual cells. No significant changes occurred in the mean dielectric properties of untreated cells as reflected by the crossover frequency measurements. This is easily rationalized because the HL-60 cultures used in this study were harvested at ~0.8×10⁶ cells/ml while they were in log phase and at least 20 h before they began to show any dielectric changes due to approach plateau phase at ~1.6×10 cells/ml. Also, for the short duration of the experiments, cells exposed to 2% DMSO (the solvent used to introduce GEN and zVAD-fmk to samples) did not experience a change in the dielectric properties. For the first hour after initiating GEN treatment, the cell radius remained unchanged, but fcrossover increased significantly. Thereafter, r decreased and fcrossover continued to increase with time. This suggested that two distinct morphological responses were occurring in response to GEN.
Fig. 3.
Changes in cell DEP properties following apoptotic initiation with and without the presence of zVAD-fmk. Untreated (Control) cells and cells treated with 2% DMSO are also indicated. The bars show the standard deviation.
To determine whether either of these changes were caspase dependent, we added 10 μM zVAD-fmk to the cell suspension in some experiments at 30 min before and 2.5 h after the addition of GEN. zVAD-fmk is one of the synthetic, cell-permeable peptides that are non-cleavable analogs of caspase substrates, and is commonly used as a broad-spectrum caspase inhibitor [33,34]. Caspase activation is involved in early events during apoptosis and it has been found that its inhibition blocks many features of apoptosis including some morphological changes [34,35]. The effect of zVAD-fmk on our model is also shown in Fig. 3. In this case, the data shown are averages of 100 cells. Interestingly, zVAD-fmk did not inhibit the initial HL-60 DEP response to GEN whereby fcrossover increased in the first hour of treatment with cell size remaining constant. Statistically, the probability that the responses to GEN were the same with or without zVAD-fmk was p=0.999.
After this initial response to GEN, the cell radius of zVAD-fmk-treated cells decreased and the product r×fcrossover fell to the same value observed for untreated cells, and remained at that value for the duration of the experiment. There was no indication in the DNA or Annexin V measurements that any response to GEN had occurred with zVAD-fmk present. Finally, the probability that the GEN-treated groups of cells had the same DEP response as the GEN-untreated groups at 1 h was p<0.001.
3.3. The dielectric properties of necrotic cells are significantly different from those of normal or apoptotic cells
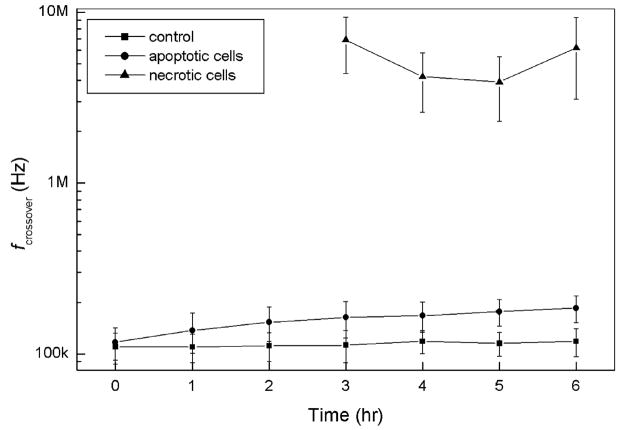
While most of the GEN-treated cells during our crossover frequency measurements remained indistinguishable from control cells under light microscopy, a small subpopulation developed atypically large radii, exhibited roughened surfaces, and showed gross signs of active membrane blebbing compared with control cells. This subpopulation stained positively with trypan blue, showing that cell membrane barrier function had been compromised. The proportion of cells in this subpopulation increased over time from zero at 2 h post-GEN treatment, to approximately 5% of the total cell population at 4 h, and nearly 10% at 6 h. Because these cells were trypan blue-positive, it is considered that they are necrotic cells. At a medium conductivity of 0.056 S/m, the crossover frequencies for control cells were between ~80 and ~130 kHz, and for cells undergoing apoptosis between ~130 and ~200 kHz. In contrast, crossover frequencies for these putatively necrotic cells were in the megahertz range with some above 10 MHz. Fig. 4 shows data of fcrossover versus time for necrotic, apoptotic and normal cultured cells in the form of a log plot. Each data point for the necrotic cells is an average of five cells. The significantly higher fcrossover for necrotic cells can be explained by DEP theory if we assume that the necrotic cells had lost a considerable proportion of their internal ions to the low-conductivity-suspending medium [11]. This assumption is consistent with the indication from trypan blue staining that cell membrane barrier function had been compromised.
Fig. 4.
Changes in cell crossover frequencies following apoptotic initiation. The DEP crossover frequencies for necrotic cells were greatly different from normal or apoptotic cells.
3.4. Alterations in cell membrane capacitance and conductance during apoptosis progression
Membrane capacitance is a measure of the area of the membrane that acts as a barrier toward, and can accumulate, ionic charges in the suspending medium in response to the applied electrical field. Membrane conductance, on the other hand, reflects the net transport of ionic species across the membrane through pores, ion channels, and defects under the influence of the applied field. To quantify these properties, we measured the individual crossover frequency and radius for 20 HL-60 cells at medium conductivities of 0.015, 0.025, 0.035, 0.045, and 0.055 S/m, at 0, 1, 2, and 4 h after GEN was introduced. Fig. 5 shows the averaged r×fcrossover values versus medium conductivity σmed. A least-squares linear fit was performed to provide the slope and ordinate intercept. The specific cell membrane capacitance and conductance were derived using Eqs. (1) and (2). The results are given in Table 1, which demonstrate that apparent cell-specific membrane capacitance decreased as apoptosis progressed.
Fig. 5.
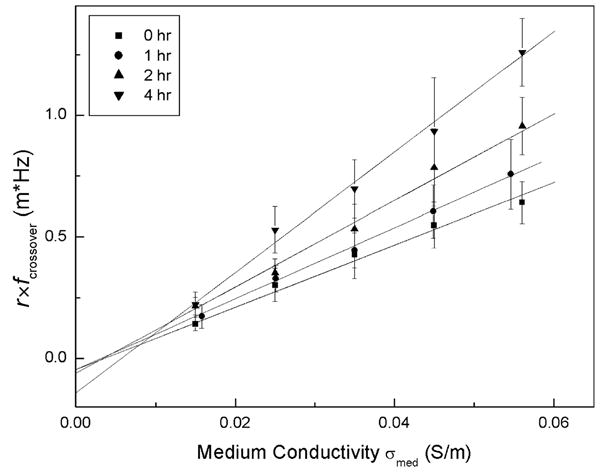
DEP characteristics of HL-60 cells expressed as r× fcrossover versus the suspending medium conductivity σmed following treatment by GEN at 100 μg/ml. Straight lines show least-square linear fits to the data.
Table 1.
Changes in dielectric properties of cell membrane for normal and apoptotic HL-60 cells treated with GEN
| Cmem (mF/m2) | Gmem (S/m2) | |
|---|---|---|
| Untreated cells | 17.5±0.8 | (2.5±1.1)103 |
| GEN, 0 h | 17.6±0.9 | (2.5±1.0)103 |
| GEN, 1 h | 15.9±0.7 | (2.4±1.1)103 |
| GEN, 2 h | 13.1±0.8 | (2.5±1.2)103 |
| GEN, 4 h | 9.1±0.5 | (4.2±1.0)103 |
Alterations in membrane conductance occurred later than the changes seen in membrane capacitance (see Table 1). The 60% increase at 4 h might result from membrane alterations such as looser packing of phospholipids [36] and increased field-dependent ion migration through ion channels during apoptosis rather than the permeabilization of the cells. It is known that cells undergoing apoptosis maintain the barrier function of their plasma membranes for several hours after initiating nuclear damage [25,37]. Membrane permeabilization is considered a relatively late-stage event of apoptosis and results in a huge increase in membrane conductance [11] as confirmed in Fig. 4 for necrotic cells.
Previous studies have shown that differences in the specific plasma membrane capacitance of different cells appear to be dominated by membrane morphological configurations so that a lower limit for its value is expected to correspond to a smooth membrane that is free of surface morphological features [18,38–41]. Therefore, we would expect cell membrane capacitance not to fall below this plateau as apoptosis progresses. Membrane conductance, on the other hand, can conceivably increase independently until the membrane barrier function breaks down completely.
3.5. SEM
Specific membrane capacitance is defined as the capacitance per unit area of the cytoplasmic membrane. As already indicated, previous studies [38,42,43,47] have demonstrated that the cell-specific membrane capacitance varies very little with changes in membrane composition and largely depends on contribution associated with cell plasma membrane surface morphology, such as microvilli, ruffles, folds, etc. These surface features increase the net surface area of the cell membrane and thereby increase Cmem, the capacitance per unit area of the cell surface [11,18,38]. It follows that the specific membrane capacitance, to a significant degree, reflects the complexity of the cell surface morphology.
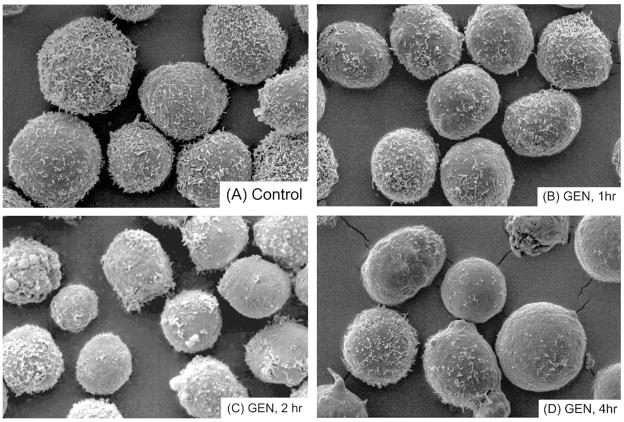
To determine whether the evolution of the cell membrane morphology during induced apoptosis could account for the observed dielectric responses following GEN treatment, SEM was used to examine the cell surfaces. Fig. 6 depicts SEM micrographs of representative cells fixed in isotonic medium at 0, 1, 2, and 4 h after adding GEN. The surfaces of control cells were covered with abundant microvilli (Fig. 6A). As early as 1 h after the introduction of GEN, blebs appeared on the surface of approximately 5% of cells (Fig. 6B). This phenomenon was progressive and blebs were evident on the surfaces of as many as 25% of the cells at 2 h. It was associated with increases in smooth areas of the surface (Fig. 6C) suggesting that microvilli and other membrane features were lost to the blebs. By 4 h, most of the cell surfaces were predominantly smooth with few microvilli (Fig. 6D). The loss of surface area due to decreasing morphological complexity paralleled and was completely consistent with the observed decrease in membrane capacitance during the progression of apoptosis.
Fig. 6.
SEM pictures of HL-60 cells at magnification ×2500 at 0 (A), 1 (B), 2 (C), and 4 h (D) following GEN treatment reveal the evolution of changes in cell membrane morphology as apoptosis progressed.
4. Discussion
Our results show for the first time that membrane dielectric properties clearly reflect cells undergoing apoptosis. As a result, cellular DEP responses clearly delineate apoptotic from normal and necrotic cells of the same lineage under the same incubation conditions. In prior studies, we and others have demonstrated that such measurements by various DEP methods allow progressive alterations of both a physiologic and a pathologic nature to be followed, and that the dielectric changes seen are related to alterations in the cell plasma membranes [14–19,38,39]. Alterations in cellular DEP characteristics appear to be very sensitive measures of the cellular “dielectric-phenotype”, a function of membrane capacitance and conductivity, cell size, and intra-cellular components. Thus, well-defined differences have been identified in lymphocytes during their mitotic cycle [19,39], and in tumor cells undergoing terminal cell division and during retro-transformation [15,18,38]. We believe that it is not coincidental that such alterations also occur during the apoptotic process.
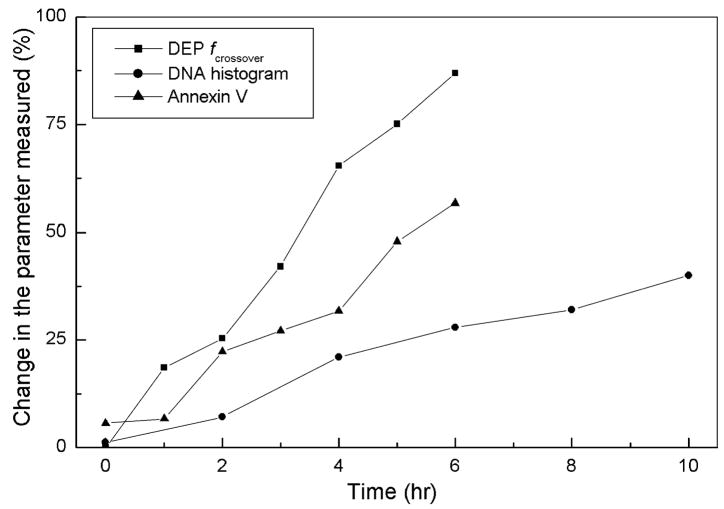
It is noteworthy that the results reported here describe significant alterations in DEP crossover frequency and membrane capacitance as early as 1 h after GEN treatment, and precede caspase activation. It appears therefore, that they preceded or were closely associated in time with some of the earliest described events of this experimental model. For example, while externalization of PS is considered an early event during apoptosis [37], we detected DEP changes at least an hour before we could detect an increase in PS or a sub-diploid cell population. These results indicate that it might be possible to correlate changes in cell dielectric properties with very early stages of apoptosis and use cell DEP characteristics as early and sensitive prognostic markers for apoptosis. We illustrate this point in Fig. 7, where results from Figs. 1–3 are compared for sensitivity. This figure shows that when compared with the percentage of cells in the sub-G1 peak in the DNA histogram, or the number of Annexin V-positive cells in a culture, the DEP crossover method is much more sensitive. (F-tests for these sensitivity plots revealed that the statistical confidence levels that the sensitivity characteristics are different were >99.99% and >99.999%, for DEP vs. Annexin and DEP vs. DNA fragmentation, respectively.)
Fig. 7.
Use of the change in DEP crossover frequency to detect apoptosis is compared with DNA histogram and Annexin V staining methods. These results show that the DEP crossover method is the most sensitive, especially at the early time points.
While the experiments using zVAD-fmk demonstrate clearly that caspase inhibition cause cells to re-establish normal behavior after 1 h, DEP can apparently detect a reversible event that precedes caspase involvement.
The alterations described in this paper accompanying induced apoptosis were not limited to HL-60 cells treated with GEN. Quantitatively similar results in terms of DEP crossover frequencies and morphological alterations were obtained when HL-60 cells were treated with campothecin (data not shown). The campothecin regimen differed somewhat in the timing and synchronicity of events as would be predicted from the differential effect that this agent has on different stages of the cell cycle [7,26]. Preliminary studies on Jurkat cells treated with GEN also demonstrated the sequence of events described in this paper for HL-60 cells (data not shown). Through the application of SEM, we have also demonstrated that a striking alteration and simplification of the cell surface paralleled the observed dielectric alterations.
Morphological simplification of the cell surface has been described previously as an early event in the apoptotic process [3,4,44]. However, to date, no mechanism has been identified to clearly explain this phenomenon. Such morphological changes alone can account for the dielectric alterations demonstrated here, with a possible minor contribution from membrane compositional modifications. Also, at the plasma membrane level, it has been suggested that drastic, very early alterations in the function of ion channels, and especially those related to chloride and potassium homeostasis, are crucial to the subsequent events in the apoptotic sequence [8]. Clearly, it would be of interest to correlate such specific processes with the changes we have observed here. Our findings suggest that further investigation is needed of the plasma membrane as a possible site for early and obligatory participation in apoptosis.
The dielectric changes observed during induced apoptosis have a potentially much wider application than studying cellular structural correlations with signaling events. Cells possessing dissimilar dielectric properties can be selectively manipulated by application of an appropriate electrical field distribution, frequency, and suspending medium conditions [12,21,22,24,45–47]. We have shown that such manipulations do not alter cell viability [48]. Therefore, in addition to further defining cell phenotype, DEP offers considerable potential for cell separation and purification applications. The dielectric characterization and manipulation of biological cells are currently attracting increasing interest. For example, in the past few years, we and others have reported a number of cell separations, including human cancer cells from normal blood cells [21,49,50], viable cells from non-viable ones [46], and the purification of CD34+ cells from blood [45] and from tumor cells [12], as well as a number of blood cell differential analyses [24]. The changes observed here during cell apoptosis are large enough to permit the separation of apoptotic from normal cells by high discrimination methods such as dielectrophoretic field flow fractionation (DEP-FFF) [12]. Although the easier method of DEP-trapping lacks sufficient discrimination for that separation, it could certainly separate normal from necrotic cells given the large dielectric differences in that case [51]. It follows that DEP methods appear to be applicable to the detection of apoptosis and necrosis and to the separation of apoptotic and necrotic cells from normal cells. This is important, for example, for the detection and quantification of apoptotic cells in cell cultures (for drug sensitivity testing), in the blood of patients before and during cancer treatment, and for other diagnostic and prognostic purposes.
Acknowledgments
We thank Jamileh Noshari and Celine Joyce, of the Dielectrophoresis Laboratory for tissue culture, and Kenneth Dunner Jr. of the High Resolution Microscopy Facility for SEM, at the University of Texas M. D. Anderson Cancer Center, and Drs. Ying Huang, and Jun Yang for helpful discussions. We are also grateful to Dr. Jon Schwartz for suggestions and help with the manuscript. This work is supported by Grant R01 DK51065 from the National Institute for Diabetes, Digestive, and Kidney Diseases. SEM was made possible by NIH Core Grant P30-CA16672.
References
- 1.Dive C, Hickman JA. Br J Cancer. 1991;64(1):192–196. doi: 10.1038/bjc.1991.269. [DOI] [PMC free article] [PubMed] [Google Scholar]
- 2.van Engeland M, Kuijpers HJ, Ramaekers FC, Reutelingsperger CP, Schutte B. Exp Cell Res. 1997;235(2):421–430. doi: 10.1006/excr.1997.3738. [DOI] [PubMed] [Google Scholar]
- 3.Wyllie AH. Br J Cancer. 1993;7(2):205–208. doi: 10.1038/bjc.1993.40. [DOI] [PMC free article] [PubMed] [Google Scholar]
- 4.Woodle ES, Kulkarni S. Transplantation. 1998;66(6):681–691. doi: 10.1097/00007890-199809270-00001. [DOI] [PubMed] [Google Scholar]
- 5.Bevers EM, Comfurius P, Dekkers DW, Harmsma M, Zwaal RF. Lupus. 1998;7(Suppl 2):S126–S131. doi: 10.1177/096120339800700228. [DOI] [PubMed] [Google Scholar]
- 6.Zhao J, Zhou Q, Wiedmer T, Sims PJ. J Biol Chem. 1998;273(12):6603–6606. doi: 10.1074/jbc.273.12.6603. [DOI] [PubMed] [Google Scholar]
- 7.O’Brien IE, Reutelingsperger CP, Holdaway KM. Cytometry. 1997;29(1):28–33. [PubMed] [Google Scholar]
- 8.Lang F, Lepple-Wienhues A, Paulmichl M, Szabo I, Siemen D, Gulbins E. Cell Physiol Biochem. 1998;8:285–292. doi: 10.1159/000016290. [DOI] [PubMed] [Google Scholar]
- 9.Marchetti C, Ulisse S, Bruscoli S, Russo FP, Migliorati G, Schiaffella F, Cifone MG, Riccardi C, Fringuelli R. J Pharmacol Exp Ther. 2002;300(3):1053–1062. doi: 10.1124/jpet.300.3.1053. [DOI] [PubMed] [Google Scholar]
- 10.Iglesias FJ, Santamaria C, Asencor FJ, Dominguez A. In: Electrical Manipulation of Cells. Lynch PT, Davey MR, editors. Chapman & Hall; New York: 1996. pp. 71–99. [Google Scholar]
- 11.Zimmermann U, Neil GA. Electromanipulation of Cells. CRC Press; Boca Raton: 1996. [Google Scholar]
- 12.Wang XB, Huang Y, Vykoukal J, Becker FF, Gascoyne PRC. Anal Chem. 2000;72(4):832–839. doi: 10.1021/ac990922o. [DOI] [PMC free article] [PubMed] [Google Scholar]
- 13.Morgan H, Hughes MP, Green NG. Biophys J. 1999;77(1):516–525. doi: 10.1016/S0006-3495(99)76908-0. [DOI] [PMC free article] [PubMed] [Google Scholar]
- 14.Huang Y, Hölzel R, Pethig R, Wang XB. Phys Med Biol. 1992;37:1499–1517. doi: 10.1088/0031-9155/37/7/003. [DOI] [PubMed] [Google Scholar]
- 15.Gascoyne PRC, Pethig R, Burt JPH, Becker FF. Biochim Biophys Acta. 1993;1149:119–126. doi: 10.1016/0005-2736(93)90032-u. [DOI] [PubMed] [Google Scholar]
- 16.Gascoyne PRC, Noshari J, Becker FF, Pethig R. IEEE Trans Ind Appl. 1994;30:829–834. [Google Scholar]
- 17.Gimsa J, Marszalek P, Loewe U, Tsong TY. Biophys J. 1991;60(4):749–760. doi: 10.1016/S0006-3495(91)82109-9. [DOI] [PMC free article] [PubMed] [Google Scholar]
- 18.Huang Y, Wang XB, Becker FF, Gascoyne PRC. Biochim Biophys Acta. 1996;1282:76–84. doi: 10.1016/0005-2736(96)00047-8. [DOI] [PubMed] [Google Scholar]
- 19.Huang Y, Wang XB, Gascoyne PRC, Becker FF. Biochim Biophys Acta. 1999;1417(1):51–62. doi: 10.1016/s0005-2736(98)00253-3. [DOI] [PubMed] [Google Scholar]
- 20.Yang J, Huang Y, Wang XJ, Wang XB, Becker FF, Gascoyne PRC. Biophys J. 1999;76(6):3307–3314. doi: 10.1016/S0006-3495(99)77483-7. [DOI] [PMC free article] [PubMed] [Google Scholar]
- 21.Gascoyne PRC, Wang XB, Huang Y, Becker FF. IEEE Trans Ind Appl. 1997;33(3):670–678. doi: 10.1109/28.585856. [DOI] [PMC free article] [PubMed] [Google Scholar]
- 22.Pethig R, Markx GH. Trends Biotechnol. 1997;15(10):426–432. doi: 10.1016/S0167-7799(97)01096-2. [DOI] [PubMed] [Google Scholar]
- 23.Yang J, Huang Y, Wang XB, Becker FF, Gascoyne PRC. Anal Chem. 1999;71(5):911–918. doi: 10.1021/ac981250p. [DOI] [PubMed] [Google Scholar]
- 24.Yang J, Huang Y, Wang XB, Becker FF, Gascoyne PRC. Biophys J. 2000;78:2680–2689. doi: 10.1016/S0006-3495(00)76812-3. [DOI] [PMC free article] [PubMed] [Google Scholar]
- 25.Darzynkiewicz Z, Bruno S, Del Bino G, Gorczycz W, Hotz MA, Lassota P, Traganos F. Cytometry. 1992;13:795–808. doi: 10.1002/cyto.990130802. [DOI] [PubMed] [Google Scholar]
- 26.Nieves-Neira W, Pommier Y. Int J Cancer. 1999;82:396–404. doi: 10.1002/(sici)1097-0215(19990730)82:3<396::aid-ijc13>3.0.co;2-z. [DOI] [PubMed] [Google Scholar]
- 27.Traganos F, Ardelt B, Halko N, Bruno S, Darzynkiewicz Z. Cancer Res. 1992;52:6200–6208. [PubMed] [Google Scholar]
- 28.Gascoyne PRC, Pethig R, Satayavivad J, Becker FF, Ruchirawat M. Biochim Biophys Acta. 1997;1323:240–252. doi: 10.1016/s0005-2736(96)00191-5. [DOI] [PubMed] [Google Scholar]
- 29.De Gasperis G, Wang XB, Yang J, Becker FF, Gascoyne PRC. Meas Sci Technol. 1998;9:518–529. [Google Scholar]
- 30.Irimajiri A, Hanai T, Inouye A. J Theor Biol. 1979;78(2):251–269. doi: 10.1016/0022-5193(79)90268-6. [DOI] [PubMed] [Google Scholar]
- 31.Jones TB. Electromechanics of Particles. Cambridge Univ. Press; Cambridge, UK: 1995. [Google Scholar]
- 32.Arends MJ, Wyllie AH. Int Rev Exp Pathol. 1991;32:223–254. doi: 10.1016/b978-0-12-364932-4.50010-1. [DOI] [PubMed] [Google Scholar]
- 33.Ekert PG, Silke J, Vaux DL. Cell Death Differ. 1999;6(11):1081–1086. doi: 10.1038/sj.cdd.4400594. [DOI] [PubMed] [Google Scholar]
- 34.Shimizu T, Pommier Y. Leukemia. 1997;11(8):1238–1244. doi: 10.1038/sj.leu.2400734. [DOI] [PubMed] [Google Scholar]
- 35.Zheng TS, Hunot S, Kuida K, Flavell RA. Cell Death Differ. 1999;6(11):1043–1053. doi: 10.1038/sj.cdd.4400593. [DOI] [PubMed] [Google Scholar]
- 36.Mower DA, Jr, Peckham DW, Illera VA, Fishbaugh JK, Stunz LL, Ashman RF. J Immunol. 1994;152(10):4832–4842. [PubMed] [Google Scholar]
- 37.Martin SJ, Reutelingsperger CPM, McGahon AJ, Rader JA, van Schie RCAA, La Face DM, Green DR. J Exp Med. 1995;182:1545–1556. doi: 10.1084/jem.182.5.1545. [DOI] [PMC free article] [PubMed] [Google Scholar]
- 38.Arnold WM, Klarmann BG, Sukhorukov VL, Zimmermann U. Biochem Soc Trans. 1992;20(2):120S. doi: 10.1042/bst020120s. [DOI] [PubMed] [Google Scholar]
- 39.Xun Hu, Arnold WM, Zimmerman U. Biochim Biophys Acta. 1990;1021:191. doi: 10.1016/0005-2736(90)90033-k. [DOI] [PubMed] [Google Scholar]
- 40.Kell DB, Harris CM. J Bioelectr. 1985;4:317. [Google Scholar]
- 41.Wang XB, Huang Y, Gascoyne PRC, Becker FF, Hölzel R, Pethig R. Biochim Biophys Acta. 1994;1193:330–344. doi: 10.1016/0005-2736(94)90170-8. [DOI] [PubMed] [Google Scholar]
- 42.Hu X, Arnold WM, Zimmermann U. Biochim Biophys Acta. 1990;1021:191–200. doi: 10.1016/0005-2736(90)90033-k. [DOI] [PubMed] [Google Scholar]
- 43.Sukhorukov VL, Arnold WM, Zimmermann U. J Membr Biol. 1993;132:27–40. doi: 10.1007/BF00233049. [DOI] [PubMed] [Google Scholar]
- 44.Savill J, Fadok V, Henson P, Haslett C. Immunol Today. 1993;14(3):131–136. doi: 10.1016/0167-5699(93)90215-7. [DOI] [PubMed] [Google Scholar]
- 45.Stephens M, Talary MS, Pethig R, Burnett AK, Mills KI. Bone Marrow Transplant. 1996;18:777–782. [PubMed] [Google Scholar]
- 46.Docoslis A, Kalogerakis N, Behie LA, Kaler KVIS. Biotechnol Bioenerg. 1997;54(3):239–250. doi: 10.1002/(SICI)1097-0290(19970505)54:3<239::AID-BIT5>3.0.CO;2-G. [DOI] [PubMed] [Google Scholar]
- 47.Wang XB, Huang Y, Wang XJ, Becker FF, Gascoyne PRC. Biophys J. 1997;72:1887–1899. doi: 10.1016/S0006-3495(97)78834-9. [DOI] [PMC free article] [PubMed] [Google Scholar]
- 48.Wang XJ, Yang J, Gascoyne PRC. Biochim Biophys Acta. 1999;1426:53–68. doi: 10.1016/s0304-4165(98)00122-6. [DOI] [PMC free article] [PubMed] [Google Scholar]
- 49.Becker FF, Wang XB, Huang Y, Pethig R, Vykoukal JV. J Phys D: Appl Phys. 1994;27:2659–2662. [Google Scholar]
- 50.Huang Y, Wang XB, Becker FF, Gascoyne PRC. Biophys J. 1997;73:1118–1129. doi: 10.1016/S0006-3495(97)78144-X. [DOI] [PMC free article] [PubMed] [Google Scholar]
- 51.Gascoyne PRC, Vykoukal JV. Electrophoresis. 2002 in press. [Google Scholar]


