Abstract
The dielectrophoretic (DEP) crossover method has been applied to the detection of cell responses to toxicants. Time and dose responses of the human cultured leukemia (HL-60) line were measured for paraquat, styrene oxide (SO), N-nitroso-N-methylurea (NMU) and puromycin. These toxicants were chosen because of their different predominant mechanisms of action, namely membrane free radical attack, simultaneous membrane and nucleic acid attack, nucleic acid alkylation, and protein synthesis inhibition, respectively. For all treatments, the specific membrane capacitance (Cmem) of the cells decreased while the specific membrane conductance (Gmem) increased in dose- and time-dependent manners. The DEP responses correlated sensitively with alterations in cell surface morphology, especially folds, microvilli, and blebs, observed by scanning electron microscopy. The DEP method was more sensitive to agents that had a direct action on the membrane than to agents for which membrane alterations were secondary. The responses to paraquat and SO, which directly damaged the cell membrane, could be detected 15 min after exposure, while those for puromycin and NMU, which acted on intracellular targets, could be detected after 30 min. The detection times and dose sensitivity results showed that the DEP method is much faster and more sensitive than conventional cell and higher organism viability testing techniques. The feasibility of producing small instruments for toxicity detection and screening based on cellular dielectric responses is discussed.
Keywords: Dielectrophoresis, DEP crossover method, Membrane capacitance, Membrane conductance, Cell dielectric property, Cell surface morphology
1. Introduction
Increasing use of chemicals in agricultural and industrial activities, particularly in developing countries, results in environmental pollution that affects surface and ground water supplies around the world. Current testing protocols typically involve the collection of water samples in the field and their subsequent transportation and analysis in a centralized laboratory either by chemical means or by biological testing. These methods are either complex, time-consuming, costly, tedious or not sensitive enough to detect toxicity at low levels [1–5]. Hence, there is a need for rapid and efficient screening techniques to detect and evaluate toxicity of chemical pollution in water, especially methods that can be used for testing in the field and for continuous monitoring applications.
AC electric field-induced kinetic effects such as dielectrophoresis have been applied for the study and analysis of microbiological particles and the manipulation of biological cells in small chambers. Dielectrophoresis (DEP) is the translational movement of a particle in a nonuniform AC electric field driven by a force arising from the electrostatic interaction between field-induced polarization in the particle and the nonuniformity of the applied field [6–11]. The DEP response of cells depends upon the membrane capacitance (which reflects membrane thickness, composition and morphologic complexity), the membrane conductance (which reflects the transport of charge carriers across the membrane), and the internal cellular conductivity and permittivity (which reflect the electrical mobility of ion species and the combined properties of cytoplasmic water and intra-cellular barriers to charge movement) [10,12]. The cellular dielectric parameters, particularly the membrane capacitance and conductivity, have been shown to respond sensitively to changes in cell morphology and physiology [9–13]. It may therefore be expected that exposure of cells to toxicants that lead to modifications in these cellular characteristics will result in dielectric changes that can be detected rapidly by DEP. Indeed, Wang et al. [13] have shown rapid DEP responses to genistein, which induces cell apoptosis and later necrosis, and these DEP responses have been closely correlated with cell morphological changes that occur as the apoptotic process proceeds. Geier et al. [7] and Arnold et al. [8], using the related technique of electrorotation, also showed much earlier that the dielectric properties of yeast cells are significantly modified by the exposure to heavy metal and substituted phenols, though the underlying basis for those changes were not established.
In this paper, we show that DEP can be used as a means for rapidly detecting responses of the human myelogenous leukemia HL-60 cell line to toxicant exposure. Four toxicants, representing four distinctly different mechanisms of toxic action, were investigated. Paraquat was selected as a compound that causes lipid peroxidation, resulting in membrane damage and loss of functional integrity of the cell [14–16]. Styrene oxide (SO) was selected as prototypical DNA-damaging agent that also damages the cell membrane through enhancement of lipid peroxidation [17–20]. N-nitroso-N-methylurea (NMU) represented a prototype for alkylating agents that directly damage DNA and other cellular macromolecules through the formation of an electrophilic intermediate [21–23]. Finally, puromycin was selected as a compound that causes extensive inhibition of protein synthesis [24–26]. In order that changes in both the membrane capacitance (Cmem) and membrane conductivity (Gmem) of cells could be detected as a function of toxicant dose and exposure time, the so-called DEP crossover frequency method [10,27] was employed. In this method the frequency of a nonuniform field applied to the cells is adjusted until the motion of the cells towards or away from the electrode stops just prior to reversing direction. At this so-called “crossover frequency” fcross, the dielectric properties of the cell match those of the suspending medium. Measurement of the fcross vs. the conductivity of the suspending medium allows the cell dielectric properties to be deduced [10,27,28]. Changes in fcross are indicative not only of the specific cellular responses to drug or chemical agent exposures but also of the ability of microscale DEP methods such as DEP trapping and DEP field-flow fractionation to detect such exposures. The membrane dielectric responses of HL-60 cells towards toxicant treatments were studied in dose- and time-dependent manners. Dose–cell viability response relationships were investigated and compared with the DEP response data. The results are discussed in terms of the potential usefulness of DEP methods for toxicity detection and applicability of this technology to small, portable instruments for environmental detection and screening applications.
2. Materials and methods
2.1. Materials
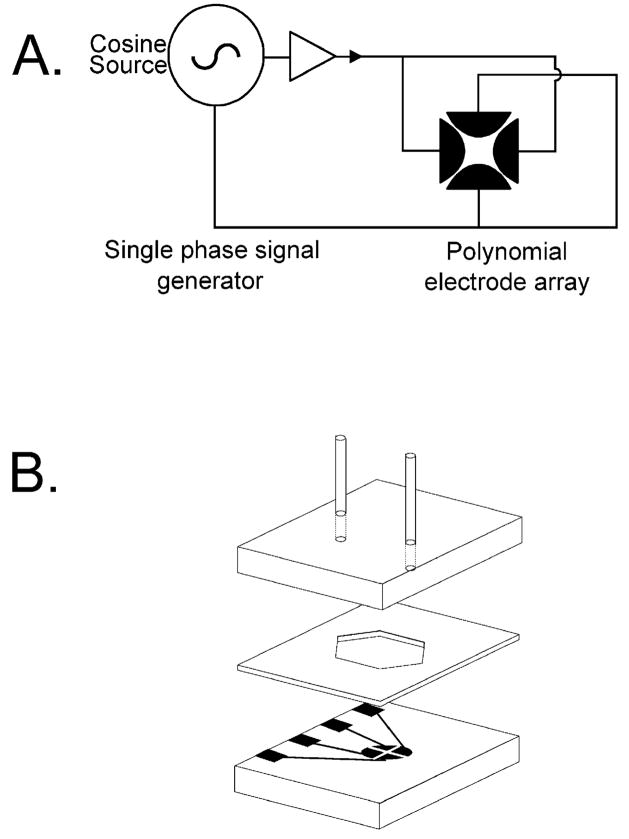
Paraquat dichloride, NMU, puromycin dihydrochloride and dimethyl sulfoxide (DMSO) were obtained from Sigma Chemical Co. (St. Louis, MO). SO was purchased from Fluka AG (Buchs, Switzerland). All chemicals were of analytical grade. DEP studies were conducted using the polynomial electrode [27,28] design shown in Fig. 1A, and electrodes were fabricated by standard photolithography as described earlier. A polynomial electrode with a tip–tip spacing of 200 μm was used in this study. The electrode array was placed in a flow-through chamber shown in Fig. 1B to facilitate easy sample changing.
Fig. 1.
The electrode (A) and chamber configurations (B) used for DEP experiments. The gold-on-glass electrode had a tip–tip spacing diameter of 200 μm.
2.2. Cell preparation
The human leukemia HL-60 cell line was used as a model system in this study. Cells were cultured in RPMI 1640 medium (Gibco) supplemented with 10% fetal bovine serum (Hyclone, Utah), 200 mM L-glutamine, 20 mM HEPES, and 0.5% penicillin and streptomycin, and were maintained in 75-cm2 plastic flasks under a 5% CO2:95% air atmosphere at 37 °C in a humidified incubator. HL-60 cells were harvested at a density of 1.5 × 10⁶/ml while still in log growth phase by gently rocking the flask 48 h after seeding. Cell suspensions were found to have >98% viability by Trypan blue dye exclusion.
2.3. Exposure to toxicants
The effects of toxicant exposure were investigated by adding 10-μl aliquots of a vehicle containing appropriate concentrations of paraquat, NMU, or puromycin (dissolved in nano-pure water), or SO (dissolved in DMSO) into 990 μl of cell suspensions (1% was the maximum final concentration of the vehicle). Control samples were treated with the same volume of vehicle alone. The suspensions were incubated at room temperature for exposure times from 15 to 150 min. The cell suspensions were then washed twice by centrifugation at 223 × g for 10 min and then resuspended at a density of ~5 × 10⁵/ml in isotonic 8.5% (w/v) sucrose plus 0.3% (w/v) dextrose buffer. The conductivities of the final cell suspensions were adjusted with phosphate buffered saline (PBS) to design values and verified with a conductivity meter (EC1481-61; Cole-Parmer Instruments).
2.4. DEP crossover frequency measurements
Cells exhibit motion towards or away from strong field regions under the influence of positive or negative DEP forces in a nonuniform electric field. The DEP crossover frequency is defined as that frequency at which DEP forces change polarity and cells experience zero DEP force [10,27,28]. For the conductivity range and the 200 μm tip–tip polynomial electrode geometry used here, sinusoidal signals between 10 and 500 kHz and up to 1.2 VRMS were applied from a function generator (8116A; Hewlett Packard). Depending on whether the frequency was above or below fcross, motion of cells towards or away from the electrode edges was observed. The DEP crossover frequency was determined for individual cells located ~10 μm from an electrode edge (where the fringing field from the thin electrodes was very inhomogeneous) by adjusting the frequency of the applied field until cell movement ceased [10,27,28]. Cell size was measured from the cell image on the TV monitor and calibrated against a stage micrometer. Measurements were made for cell suspending medium conductivities in the range 20 to 70 mS/m, and crossover frequencies for at least 15 cells were determined for each experimental condition. Finally, the repeatability of the experiment was verified by performing measurements on two or more occasions, for a total of at least 90 cells for each point.
If the Cmem, Gmem and cell geometry are independent of the suspending medium conductivity, a plot of rxfcross versus σm is linear for σm> ~ 0.01 mS/m and Cmem can be derived from the slope as: [10,27–29],
| (1) |
and Gmem can be found from the intercept derived by extrapolating the linear region of the plot back to the σm axis as:
| (2) |
Thus, the specific cell membrane capacitance and conductance can be readily estimated from DEP crossover characteristics of the cells provided the cell mean radius rmean is known.
2.5. Flow cytometric assessment of cell viability
The membrane-permeant DNA stain, SYBR-14 (Molecular Probes, Oregon), was used in combination with propidium iodide (PI; Molecular Probes) to assess the cell viability as described in Ref. [30]. Cell viability was determined by flow cytometric (Bio-Rad, Hercules, CA) analysis of 10,000 cells. Cells with good membrane integrity were bright for SYBR-14 and dark for PI and were assumed viable. Cells lacking membrane integrity were dark for SYBR-14 and bright for PI and were assumed dead. Cells intermediate between these two conditions were considered damaged or dying [30,31].
2.6. Scanning electron microscopy
Cells from control and treated cultures were washed in serum-free RPMI at 223g × 10 min at room temperature and resuspended in 8.75% (wt/wt) sucrose solution (280 mOs/kg) for 15 min. Cells were then centrifuged and fixed at 37 °C in modified Karnovsky’s fixative (280 mOs/kg, pH 7.5) for at least 30 min. Cell specimens were examined using a Hitachi Model S520 scanning electron microscope (Hitachi Denshi, Ltd., Tokyo, Japan) as described previously [32]. Each specimen was first scanned to evaluate the cell size and morphological distribution. Then images of representative cells were recorded at a direct magnification of 1000 × to 5000 × onto Polaroid films (Polaroid Corp., Medical Products, Cambridge, MA).
3. Results
3.1. Changes in cell dielectric properties
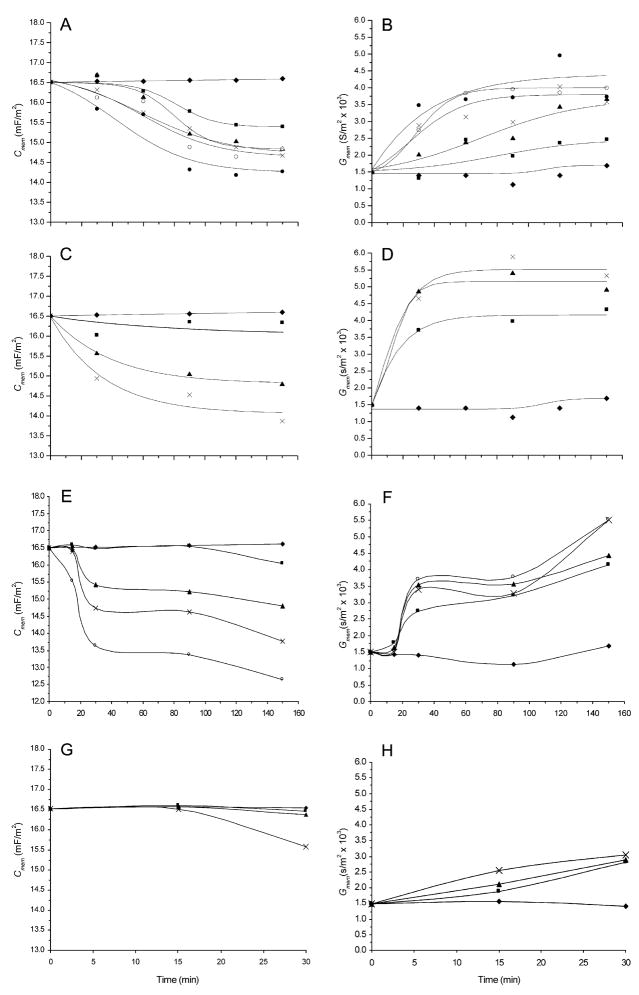
Typical crossover frequency (fcross) results for HL-60 cells as a function of suspension medium conductivity and toxicant treatment are shown in Fig. 2A. fcross increased steadily with increasing conductivity but at different rates and with different intercepts for the different treatments. Fig. 2B shows a typical fcross time course dependency for HL-60 cells for various doses of NMU and it is clear that fcross increased in a dose- and time-dependent manner. All toxicant studies produced qualitatively similar through quantitatively different responses in the cells and the values of Cmem and Gmem derived for such plots are used as the basis of the following analyses. Time– and dose–response curves of Cmem for paraquat, SO, NMU and puromycin treatments are shown in Fig. 3. All toxicants induced a marked dose-dependent decrease in Cmem with time. In contrast, Gmem increased in a dose- and time-dependent manner as also shown in Fig. 3. Paraquat produced cell dielectric responses at lower doses than SO and NMU. For example, the doses that reduced Cmem to 15 mF/m2 at 90 min were 35 μM, 0.5 mM and 0.3 mM for paraquat, SO and NMU treatments, respectively. The Cmem and Gmem responses did not parallel one another and followed different respective course for the different toxicants. For example, while SO produced more change in Gmem than NMU, NMU caused higher changes in Cmem at the same dose. After 90 min of treatment at a concentration of 0.5 mM, Gmem increased to 3280 and 5400 S/m2, while Cmem decreased to 14.6 and 15.04 mF/m2 for NMU and SO, respectively. As expected, there was a threshold dose and time of exposure for each toxicant below which no response in either Cmem or Gmem was observable.
Fig. 2.
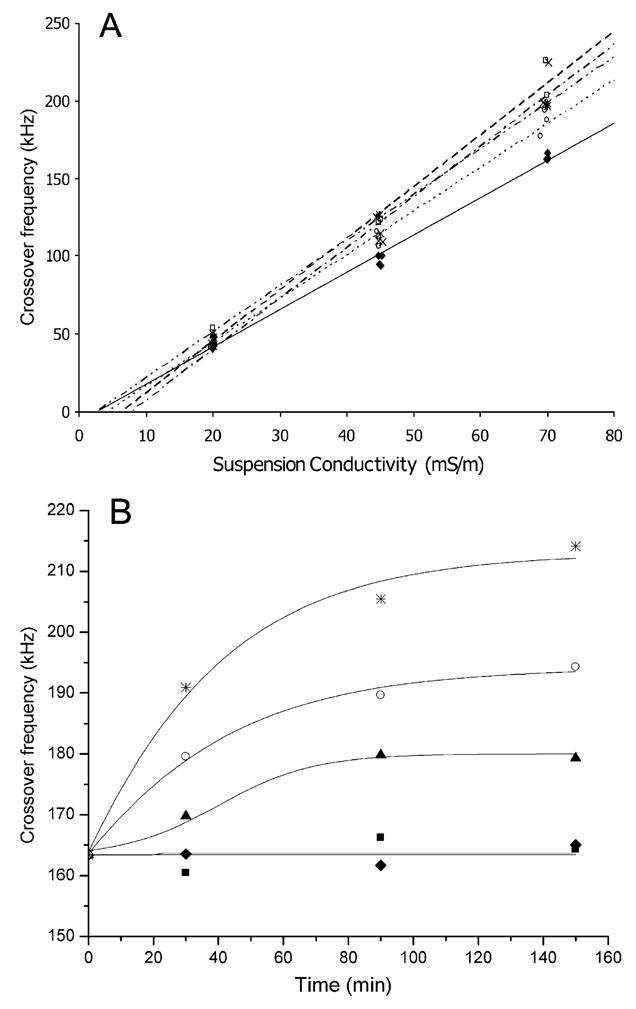
(A) Dependencies of the mean crossover frequency versus suspension medium conductivity for HL-60 cells with no treatment: (—), paraquat treatment (77.76 μM; ···), styrene oxide treatment (2 mM; –·–·–), NMU treatment (1.94 mM; – – –), and puromycin treatment (2 mM; — – —) for 150 min. (B) Time course of the DEP crossover frequency for HL-60 cells with no treatment (■), and NMU treatments of 0.1 mM (◆), 0.2 mM (▲), 0.49 mM (○) and 1.94 mM (*). Each point represents the average of at least 90 cells. The medium conductivity was 70 mS/m.
Fig. 3.
The time dependencies of the dose responses of the dielectric properties of HL-60 cells deduced from DEP crossover frequency analysis as a function of toxicant concentrations. The curves on the left (A, C, E and G) show the specific membrane capacitance (Cmem) responses, while those on the right (B, D, F and H) show the corresponding specific membrane conductance (Gmem) responses. (A–B) paraquat: no treatment (◆), 3.89 μM (■), 9.72 μM (▲), 19.44 μM (×), 38.88 μM (○) and 77.76 μM (●); (C–D) styrene oxide: no treatment (◆), 0.1 mM (■), 0.5 mM (▲) and 2 mM (×); (E –F) NMU: no treatment (◆), 0.1 mM (■), 0.2 mM (▲), 0.49 mM (×) and 1.94 mM (○); and, (G–H) puromycin: no treatment (◆), 0.01 mM (■), 0.05 mM (▲) and 0.1 mM (×). Each point represents the average of at least 90 cells. Curves A–F run from 0–160 minutes; curves G–H run from 0–30 minutes.
These detection-limit values were investigated to determine the lowest doses and shortest exposure times that could be detected for each toxicant by DEP methods. The sensitivities were different for each toxicant. We found that the response of HL-60 cells was approximately constant for a given dose × treatment-time product and the limits of detection for Cmem and Gmem are shown, on this basis, in Table 1. It is clear that the order of sensitivity was paraquat>SO>puromycin>NMU, and changes in Gmem were more sensitive than changes in Cmem. Responses could be seen as soon as 15 min for paraquat and SO treatments but not until 30 min for puromycin (Fig. 3G) and NMU treatments. These minimum response times suggest that while paraquat and SO caused rapid membrane changes, NMU and puromycin led to subcellular damage that took some time to affect the membrane. As we will discuss later, this appeared to be consistent with the known mechanisms of action of these agents.
Table 1.
Threshold detection limits for HL-60 cells by the DEP method for the toxicants studied
| Toxicant action | Toxicant | Threshold total exposure for Cmem (μM·min)a | Threshold total exposure for Gmem (μM·min)a | Minimum detection time (min) | Threshold total exposure for mortality assays (μM·min)a |
|---|---|---|---|---|---|
| Membrane peroxidation through ROS | Paraquat | 292 | 292 | 15 | 467 |
| Membrane peroxidation and DNA damage | SO | 1500 | 750 | 15 | 3000 |
| Protein synthesis inhibitor | Puromycin | 3000 | 750 | 30 | 4500 |
| Alkylating agent | NMU | 6000 | 3000 | 30 | 9000 |
Total exposure is shown as toxicant concentration in μM × exposure time in minutes.
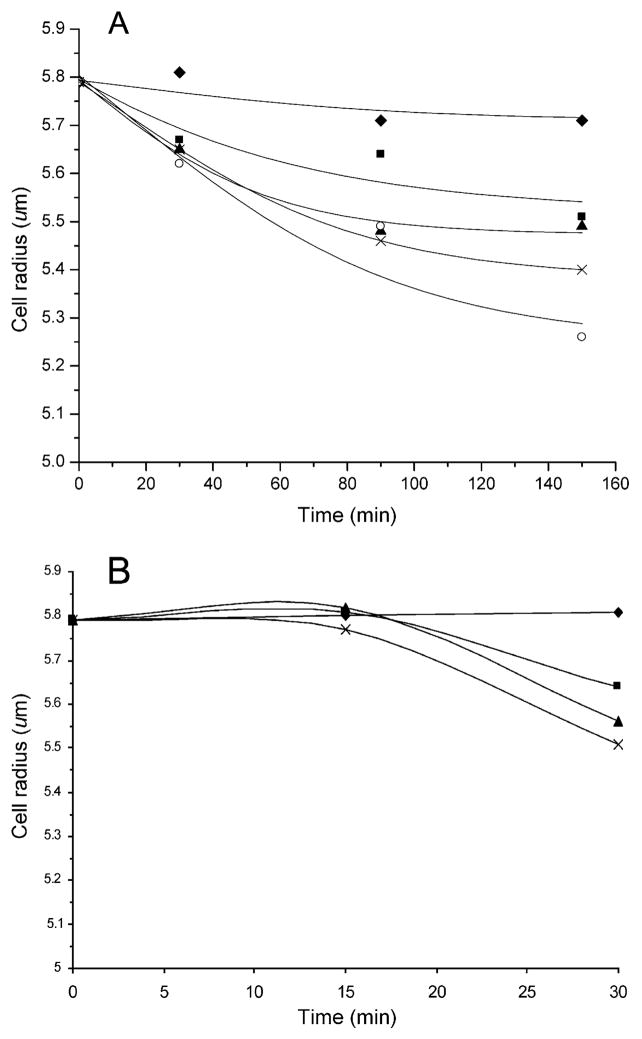
As shown in Fig. 4A and B, the radius of HL-60 cells decreased significantly with NMU and puromycin treatments in a dose- and time-dependent manner, and this decrease became observable after 30 min of treatment. Other toxicant treatments also resulted in a cell size decrease, with paraquat showing the smallest effect.
Fig. 4.
Response of the mean cell radius of HL-60 cells as a function of exposuretimeto(A)NMU:0.1mM(■), 0.2mM(▲), 0.49mM(×), 1.94mM (○) no treatment (◆); and, (B) puromycin: 0.01 mM (■), 0.05 mM (▲), 0.1 mM (×) no treatment (◆). Each point represents the average at least 90 cells.
3.2. Effect of toxicants on cell viability
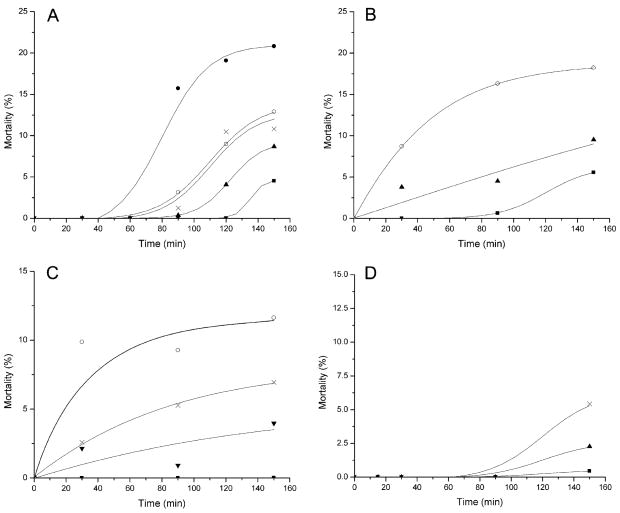
The dose–response relationship of cell viability was investigated to evaluate the potential usefulness of the DEP method in comparison with more conventional toxicological assays involving living organisms. Flow cytometric determination of viability was made at the same doses and durations of exposure that were employed in DEP experiments. The results are shown in Fig. 5. Percent mortality increased in a dose- and time-dependent manner with all the toxicants, however, it did not reach 50% even at the highest doses and longest exposure durations tested. Paraquat caused the highest mortality. For example, 5% mortality at 150 min was induced by 5 μM, 0.2 mM, 0.25 mM and 0.1 mM by paraquat, SO, NMU and puromycin treatments, respectively. Moreover, the mortality dose–response curves for paraquat were steeper than for the other toxicants. These results suggested that at many doses, cell death caused by paraquat occurred more rapidly than the other toxicants. No mortality occurred before 90 min of puromycin treatment. Thresholds for detection for the mortality assay were established and these are also shown in Table 1. For all toxicants the DEP detection threshold exposure limits were significantly lower than those for the mortality assay, indicating that the DEP method was more sensitive.
Fig. 5.
Percentage cell mortality for HL-60 cells as a function of time of exposure to (A) paraquat: 3.89 μM (■), 9.72 μM (▲), 19.44 μM (×), 38.88 μM (○), 77.76 μM (●); (B) styrene oxide: 0.1 mM (■), 0.5 mM (▲), 2 mM (○); (C) NMU: 0.1 mM (■), 0.2 mM (▲), 0.49 mM (×), 1.94 mM (○); and, (D) puromycin: 0.01 mM (■), 0.05 mM (▲), 0.1 mM (×). Each point represents the mean of at least three determinations by flow cytometry each of at least 10,000 cellular events.
3.3. Scanning electron microscopy
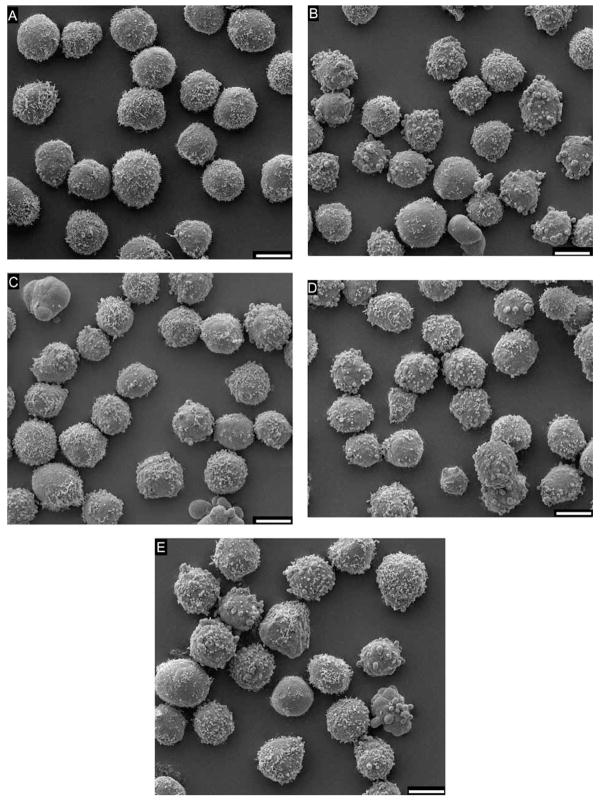
To study the possible relationship between membrane dielectric properties and cell surface morphology, SEM was employed to analyze HL-60 cells at the doses and durations of exposure that observed dielectric responses. Fig. 6 shows representative scanning electron micrographs of HL-60 cells with and without toxicant treatments. Cells in untreated samples exhibited extensive microvilli, with a few demonstrating a combination of coarse microvilli, blebs and smoother surfaces. In contrast, treated cells exhibited a significant progressive loss of microvilli accompanied by an increase in blebs, apparently bare areas, irregularly shaped periphery and a few apoptotic bodies. These toxicant-induced alterations in cell morphology were similar to those that we have shown previously to alter the cell membrane dielectric properties and thereby to affect cellular DEP responses [9–12].
Fig. 6.
Scanning electron micrographs of HL-60 cells showing the appearance of untreated cells in comparison to treated cells at the times that toxicant exposure is first detected by the DEP responses. (A) Untreated cells at 30 min. (B) paraquat 19.44 μM at 15 min. (C) Styrene oxide 0.1 mM at 15 min. (D) NMU 0.2 mM at 30 min. (E) Puromycin 0.1 mM at 30 min. While most untreated cells exhibit complex surface morphology with relatively extensive microvilli, a few demonstrate a combination of coarse microvilli, blebs and smooth surfaces. In contrast, treated cells have generally fewer microvilli, more morphological irregularities, larger areas of smooth surface, significantly more blebbing and occasional apoptotic bodies. Bar length = 10 μm.
4. Discussion
4.1. DEP crossover frequencies
Fig. 2A shows that the product of the DEP crossover frequency of untreated and treated cells depended linearly on the suspending medium conductivity as expected for particles obeying a single shell dielectric model. Similar responses were observed for all the toxicants studied, indicating that the DEP analysis model employed is valid for analyzing the cell toxicity responses reported here. The model shows that the DEP data for time– and dose–response curves can be explained in terms of changes in the specific membrane capacitance and conductance.
4.2. Changes in the specific membrane capacitance (Cmem)
The crossover frequency measurements revealed that the specific membrane capacitance of untreated HL-60 cells was approximately 16.41 (±0.46) mF/m2. It is generally accepted that the specific membrane capacitance for a perfectly flat biological membrane of typical composition is around 9 mF/m2 [10,27] with only very small changes resulting from subtraction changes in membrane composition. The larger value observed for HL-60 cells is consistent with previous findings that membrane-rich morphological features, including microvilli, ruffles, folds and blebs, increase the total membrane area of the cell and thereby increase the observed total cell capacitance [9–12]. Fig. 3 clearly reveals that membrane responses in Cmem result from toxicant treatments in a dose- and time-dependent manner. The changes in membrane capacitance of up to 40% observed here are far too large to be attributable to changes in membrane composition and such large alterations have been correlated with changes in the morphological properties and hence total surface area of cells [9,10,27].
4.3. Changes in the specific membrane conductance (Gmem)
As also shown in Fig. 3, the specific membrane conductance increased in a dose- and time-dependent manner with all toxicant treatments. Due to the near-insulating nature of lipid bilayer, the membrane conductance mainly reflects the net transport of ionic species across the plasma membrane through charge carrier transposition system (pores, ion carriers, channels and pumps) under the influence of the applied electric field [10–12,27]. The observed membrane conductance increases could result from injury to this system or the membrane barrier function. That the barrier function is involved is supported by our observations that a larger change in Gmem was found with paraquat and SO (which are known to induce loss of membrane integrity by lipid peroxidation) than with NMU and puromycin (which attack intracellular targets).
4.4. Mechanism of actions of toxicants
It may be expected that the observed DEP response might reflect the different mechanisms of action of the toxicants studied. Paraquat was selected as a model molecule whose primary target is the cell membrane. The mechanism of toxicity has been elucidated as reactive oxygen free radical attack through redox cycling. Superoxide and, in the presence of transition metals, OH· radicals are formed. Such reactive oxygen species may damage many critical macromolecules, including DNA. A primary target is the cell membrane where chain-reaction lipid peroxidation is initiated, resulting in extensive membrane damage that leads eventually to loss of the functional integrity of the cell [14–16]. SO was selected as a prototype DNA-damaging agent (direct acting carcinogen), but this agent can also cause direct damage to the cell membrane by enhancing lipid peroxidation. SO binds with DNA and forms adducts and strand breaks [17–20]. Unrepaired DNA damage normally induces programmed cell death (apoptosis) which leads to changes in cell morphology, complexity and membrane properties [13,33–35]. NMU was selected as a toxicant whose mode of action is directed specifically at DNA, mainly through alkylation at the N7 position of guanine and less frequently, though critically for carcinogenesis, through alkylation at the O6 position of guanine. Resulting acute cytotoxicity also proceeds via induced apoptosis [21–23]. Finally, Puromycin is known to inhibit protein synthesis and this process also activates apoptosis in several cell types [36,37].
Based on these modes of action, we would expect lipid peroxidation from paraquat and SO to cause changes directly to the cell membrane morphology, integrity and composition [15–17]. By contrast, the agents that act on internal targets (NMU and puromycin) would be expected to induce apoptosis that, based on Ref. [13], would cause changes in cell membrane morphology as a secondary effect that would take longer to manifest itself than direct membrane damage. Because SO can cause membrane and internal damage simultaneously, its characteristics should be mixed. In fact, the time courses of the DEP responses we observed were consistent with these arguments. Paraquat produced early changes in membrane dielectric properties at lower doses than SO, NMU and puromycin, and SO induced more changes in Gmem than NMU and puromycin used at the same doses.
The scanning electron microscopy results confirmed that a reduction in the density of complex surface morphology occurred during the toxicant treatments and that the time course of these changes mirrored that of detectable dielectric changes by DEP. Because we have shown in an accompanying paper [13] that both induced apoptosis and necrosis cause alterations in cell membrane morphology, we would expect all toxicants to lead to membrane changes that can be detected by DEP if they are used at sufficiently high doses to elicit toxic responses. In earlier studies, we have correlated changes in membrane dielectric parameters of lymphocytes with cell cycle following mitotic stimulation [38]. We also showed that increases in membrane capacitance correlate with the loss of growth regulation by oncogene expression [39] and it was found that the initiation of cell cycling caused by oocyte fertilization caused increases in membrane capacitance [40]. Therefore, when used in non-toxic doses, mitogenic stimulants and drugs that arrest cells at points in the cell cycle associated with a greater abundance of microvilli may be expected to result in an effective increase in membrane capacitance [41]. Nevertheless, at higher doses at which toxic effects take hold, even these drugs would likely cause a reduction in cell surface capacitance and increased conductance as apoptosis and/or necrosis ensued.
4.5. Comparison of DEP and mortality detection methods
The DEP technique appears to be more sensitive in detecting toxicants that acted directly on the membrane than in detecting agents whose action resulted in secondary membrane changes. As a result, DEP sensitivity to the agents examined was in the order paraquat>SO>puromycin>NMU. The responses were detectable in less than 15 min for the membrane-acting toxicants paraquat and SO, and 30 min for the internal-acting toxicants NMU and puromycin. As revealed in Table 1, the limits of detection by DEP were significantly lower than for the conventional viability assessment. The time of detection and sensitivity of the DEP method also compare very favorably with accepted laboratory models for monitoring the responses of organisms to toxicants. For example, the conventional aquatic toxicity test, in which the lethality towards fish is determined, has LC50 values of approximately 110, 220 and 1130 μM at 96 h [14,42,43] (equivalent to 6.4 × 10⁵, 1.3 × 10⁶ and 6.5 × 10⁶ μM min) for paraquat, SO and NMU, respectively. By contrast, the DEP method (see Table 1) is not only at least 200 times faster but also orders of magnitude more sensitive than this more conventional aquatic method for detecting toxicants.
5. Conclusion and perspective
We have reported a DEP crossover frequency technique for detecting cellular responses to toxicants in a micro-chamber. Changes in specific membrane capacitance (Cmem) and conductance (Gmem) are detectable by this approach. Cmem decreased, whereas Gmem increased, in dose- and time-dependent manners for all toxicants tested. Cell membrane-acting toxicants produced dielectric changes at lower doses and more rapidly than toxicants that act internally. DEP has a different sensitivity for each toxicant, apparently in accordance with the mode of action of each.
The results suggest potential usefulness of DEP methods such as DEP trapping and DEP field-flow fractionation [11,44] for toxicity detection of diverse toxicant classes and different modes of actions, and the method appears to offer advantages of speed, sensitivity and scale compared with conventional viability tests using higher organisms as indicators of responses to toxic chemicals. Systems for batch or continuous aquatic toxicity testing have been devised and implemented for various biological models, but DEP offers the possibility for producing automated, portable instruments for on site testing and monitoring. The rapidity of detection also suggests the applicability of DEP methods to acquiring better data pertaining to human exposure risks and for drug sensitivity testing. For these reasons, our results point to the possibility of producing new technologies for toxicity detection based on cellular dielectric responses. Since DEP is suitable for use in automatic microfluidic devices, we are directing efforts towards the further development of DEP-based instruments for environmental applications both in the laboratory and in the field.
Acknowledgments
This work was supported by and conducted at the Chulabhorn Research Institute, Bangkok, Thailand. Partial support was also provided by a grant from the United Nations Environment Programme, Regional Office for Asia and the Pacific. The authors gratefully acknowledge Tom Anderson for making the electrodes used in this study and Dr. Jon Schwartz for his comments and editing.
References
- 1.Tahedl H, Hader DP. Water Res. 1999;33(2):426–432. [Google Scholar]
- 2.Dutka BJ, Nyholm N, Petersen J. Water Res. 1983;17(10):1363–1368. [Google Scholar]
- 3.Fernandez A, Tejedor C, Cabrera F, Chordi A. Water Res. 1995;29(5):1281–1286. [Google Scholar]
- 4.McFeters GA, Bond PJ, Olson SB, Tchan YT. Water Res. 1983;17(12):1757–1762. [Google Scholar]
- 5.Tapp JF, Hunt SM, Wharfe JR. Toxic impacts of wastes on the aquatic environment. R Soc Chem. 1996:251–259. [Google Scholar]
- 6.Pohl HA. Dielectrophoresis. Cambridge Univ. Press; Cambridge: 1978. [Google Scholar]
- 7.Geier BM, Wendt B, Arnold WM, Zimmermann U. Biochim Biophys Acta. 1987;900:45–55. doi: 10.1016/0005-2736(87)90276-8. [DOI] [PubMed] [Google Scholar]
- 8.Arnold WM, Zimmermann U, Pauli W, Benzing M, Niehrs C, Ahlers J. Biochim Biophys Acta. 1988;942:83–95. doi: 10.1016/0005-2736(88)90277-5. [DOI] [PubMed] [Google Scholar]
- 9.Wang XB, Huang Y, Gascoyne PRC, Becker FF, Hölzel R, Pethig R. Biochim Biophys Acta. 1994;1193:330–344. doi: 10.1016/0005-2736(94)90170-8. [DOI] [PubMed] [Google Scholar]
- 10.Gascoyne PRC, Pethig R, Satayavivad J, Becker FF, Ruchirawat M. Biochim Biophys Acta. 1997;1323:240–250. doi: 10.1016/s0005-2736(96)00191-5. [DOI] [PubMed] [Google Scholar]
- 11.Yang J, Huang Y, Wang XB, Becker FF, Gascoyne RCP. Biophys J. 2000;78:2268–2680. doi: 10.1016/S0006-3495(00)76812-3. [DOI] [PMC free article] [PubMed] [Google Scholar]
- 12.Dopp E, Jonas L, Nebe B, Budde A, Knippel E. Environ Health Perspect. 2000;108(2):153–158. doi: 10.1289/ehp.00108153. [DOI] [PMC free article] [PubMed] [Google Scholar]
- 13.Wang XJ, Becker FF, Gascoyne PRC. 2002 in preparation. [Google Scholar]
- 14.World Health Organization IPCS (1984), Environmental Health Criteria 39: Paraquat and Diquat.
- 15.Ody C, Junod AF. Lab Invest. 1985;52(1):77–84. [PubMed] [Google Scholar]
- 16.Watanabe N, Shiki Y, Morisaki N, Saito Y, Yoshida S. Biochim Biophys Acta. 1986;883:420–425. doi: 10.1016/0304-4165(86)90279-5. [DOI] [PubMed] [Google Scholar]
- 17.Katoh T, Higashi K, Inoue N. J Toxicol Sci. 1989;14(1):1–9. doi: 10.2131/jts.14.1. [DOI] [PubMed] [Google Scholar]
- 18.Chakrabarti S, Duhr MA, Quevillon MS, Richer CL. Environ Mol Mutagen. 1993;22:85–92. doi: 10.1002/em.2850220206. [DOI] [PubMed] [Google Scholar]
- 19.Sorsa M, Peltonen K, Vainio H, Hemminki K. Butadiene and styrene: assessment of health hazards. IARC Sci Publ. 1993;127:245–252. [Google Scholar]
- 20.Vodicka P, Stetina R, Kumar R, Plna K, Hemminki K. Carcinogenesis. 1996;17(4):801–808. doi: 10.1093/carcin/17.4.801. [DOI] [PubMed] [Google Scholar]
- 21.Tominaga Y, Tsuzaki T, Shiraishi A, Kawate H, Sekiguchi M. Carcinogenesis. 1997;18(5):889–896. doi: 10.1093/carcin/18.5.889. [DOI] [PubMed] [Google Scholar]
- 22.Lefebvre P, Laval F. Carcinogenesis. 1993;14(8):1671–1675. doi: 10.1093/carcin/14.8.1671. [DOI] [PubMed] [Google Scholar]
- 23.Uhl M, Helma C, Knasmuller S. Mutat Res. 2000;468:213–225. doi: 10.1016/s1383-5718(00)00051-6. [DOI] [PubMed] [Google Scholar]
- 24.Darken MA. Pharmacol Rev. 1964;16:223–243. [PubMed] [Google Scholar]
- 25.Seiser RM, Nicchitta CV. J Biol Chem. 2000;275(43):33820–33827. doi: 10.1074/jbc.M004462200. [DOI] [PubMed] [Google Scholar]
- 26.Beard NS, Armentrout SA, Weisberger AS. Pharmacol Rev. 1969;21(3):213–245. [PubMed] [Google Scholar]
- 27.Huang Y, Wang XB, Becker FF, Gascoyne RCP. Biochim Biophys Acta. 1996;1282:76–84. doi: 10.1016/0005-2736(96)00047-8. [DOI] [PubMed] [Google Scholar]
- 28.Chan KL, Gascoyne RCP, Becker FF, Pethig R. Biochim Biophys Acta. 1997;1349:182–196. doi: 10.1016/s0005-2760(97)00092-1. [DOI] [PMC free article] [PubMed] [Google Scholar]
- 29.Gimsa J, Marszalek P, Loewe U, Tsong TY. Biophys J. 1991;60(4):749–760. doi: 10.1016/S0006-3495(91)82109-9. [DOI] [PMC free article] [PubMed] [Google Scholar]
- 30.Garner DL, Johnson LA. Biol Reprod. 1995;53:276–284. doi: 10.1095/biolreprod53.2.276. [DOI] [PubMed] [Google Scholar]
- 31.Jaroszeski MJ, Heller R. Flow Cytometry Protocols: Methods in Molecular Biology. Vol. 91. Humana Press, NJ: 1998. pp. 77–83. [Google Scholar]
- 32.Huang Y, Wang XB, Gascoyne PRC, Becker FF. Biochim Biophys Acta. 1999;1417:51–62. doi: 10.1016/s0005-2736(98)00253-3. [DOI] [PubMed] [Google Scholar]
- 33.Studzinski GP. Cell Growth and Apoptosis: A Practical Approach. Oxford Univ. Press; New York, NY: 1995. pp. 143–167. [Google Scholar]
- 34.Liegler TJ, Huan W, Yen TSB, Stites DP. Clin Diagn Lab Immunol. 1995;2(3):369–376. doi: 10.1128/cdli.2.3.369-376.1995. [DOI] [PMC free article] [PubMed] [Google Scholar]
- 35.Darzynkiewicz Z, Juan G, Li X, Gorczyca W, Murakami T, Traganos F. Cytometry. 1997;27:1–20. [PubMed] [Google Scholar]
- 36.Constam DB, Tobler AR, Rensing-Ehl A, Kemler I, Hersh LB, Fontana A. J Biol Chem. 1995;270(45):26931–26939. doi: 10.1074/jbc.270.45.26931. [DOI] [PubMed] [Google Scholar]
- 37.Meijerman I, Blom WM, Hans JGM, Mulder GJ, Nagelkerke JF. Toxicol Appl Pharmacol. 1999;156:46–55. doi: 10.1006/taap.1998.8616. [DOI] [PubMed] [Google Scholar]
- 38.Huang Y, Wang XB, Becker RF, Gascoyne PRC. Biochim Biophys Acta. 1996;1282:76–84. doi: 10.1016/0005-2736(96)00047-8. [DOI] [PubMed] [Google Scholar]
- 39.Huang Y, Wang XB, Gascoyne PRC, Becker RF. Biochim Biophys Acta. 1999;1417:51–62. doi: 10.1016/s0005-2736(98)00253-3. [DOI] [PubMed] [Google Scholar]
- 40.Arnold WM, Schmutzler RK, Al-Hasani S, Krebs D, Zimmermann U. Biochim Biophys Acta. 1989;979:142–146. doi: 10.1016/0005-2736(89)90535-x. [DOI] [PubMed] [Google Scholar]
- 41.Sukhorukov VL, Djuzenova CS, Arnold WM, Zimmermann U. J Membr Biol. 1994;142(1):77–92. doi: 10.1007/BF00233385. [DOI] [PubMed] [Google Scholar]
- 42.Brooke LT. Center for Lake Superior Environmental Studies. Vol. 110. University of Wisconsin; Superior, WI: 1991. [Google Scholar]
- 43.Tsoi RM. Tsitologiya. 1969;11(11):1440–1448. [PubMed] [Google Scholar]
- 44.Wang XB, Huang Y, Burt JPH, Markx GH, Pethig R. J Phys, D Appl Phys. 1993;26:1278–1285. [Google Scholar]


