Abstract
The effects of AC field exposure on the viability and proliferation of mammalian cells under conditions appropriate for their dielectrophoretic manipulation and sorting were investigated using DS19 murine erythroleukemia cells as a model system. The frequency range 100 Hz-10 MHz and medium conductivities of 10 mS/m, 30 mS/m and 56 mS/m were studied for fields generated by applying signals of up to 7V peak to peak (p-p) to a parallel electrode array having equal electrode widths and gaps of 100 μm. Between 1 kHz and 10 MHz, cell viability after up to 40 min of field exposure was found to be above 95% and cells were able to proliferate. However, cell growth lag phase was extended with decreasing field frequency and with increasing voltage, medium conductivity and exposure duration. Modified growth behavior was not passed on to the next cell passage, indicating that field exposure did not cause permanent alterations in cell proliferation characteristics. Cell membrane potentials induced by field exposure were calculated and shown to be well below values typically associated with cell damage. Furthermore, medium treated by field exposure and then added to untreated cells produced the same modifications of growth as exposing cells directly, and these modifications occurred only when the electrode polarization voltage exceeded a threshold of ~0.4 V p-p. These findings suggested that electrochemical products generated during field exposure were responsible for the changes in cell growth. Finally, it was found that hydrogen peroxide was produced when sugar-containing media were exposed to fields and that normal cell growth could be restored by addition of catalase to the medium, whether or not field exposure occurred in the presence of cells. These results show that AC fields typically used for dielectrophoretic manipulation and sorting of cells do not damage DS19 cells and that cell alterations arising from electrochemical effects can be completely mitigated.
Keywords: AC field exposure, Lag in cell growth, Hydrogen peroxide, Catalase, Dielectrophoresis, Electrode polarization
1. Introduction
Applied AC electrical fields will induce a dipole moment on a particle suspended in a medium having dissimilar dielectric properties [1,2]. If the field is non-uniform, the particle will experience a resultant translational force (DEP: dielectrophoresis) [3-8]. Alternatively, if the field is rotating, the interaction between the field and the induced dipole will make the particle rotate (ROT: electrorotation) [9-11]. The techniques of DEP and ROT can be used non-invasively to characterize the dielectric properties of individual biological cells and have led to new methods for cell characterization, manipulation and, particularly, cell sorting [12-24]. As a cell sorting method, these techniques have the advantage of being simple, easy to use and non-invasive [22,23]. Furthermore, because it employs only cell dielectric properties, the approach of DEP separation could be applied as an adjunct to conventional cell separation methods to yield overall improved discrimination, speed and efficiency for diagnostic and clinical applications [18,22,23,25]. For these reasons, the dielectric characterization and manipulation of biological cells is currently attracting increasing interest.
During manipulation by DEP-based methods, cells are exposed to AC electrical fields. Clearly, it is important to determine whether such field exposure induces undesirable effects on the cells, and if so, to identify conditions that avoid or minimize these negative effects. Extensive studies have been reported for cell field exposure to pulse and DC electrical fields applicable to electroporation and cell fusion [26-40]. These studies have shown that field exposure can alter cell membrane potential and membrane structure [28,31-33], cause cells to deform [28,30,32-34], increase cell membrane permeability [32-34,39], lead to reversible and irreversible dielectric breakdown of the cell membrane [26,27,39], and cause cellular DNA damage [36]. The extent of these negative effects depended on the signal voltage, the pulse duration and the ionic strength of the buffer [26-38]. Generation of reactive oxygen intermediates (ROIs) [36] and phenomena resulting from their action on cells such as lipid peroxidation were also observed during electroporation experiments [29,37]. Although far less work has been reported for AC field exposure of cells, it is suspected that many membrane enzymes may absorb and transduce energy from the oscillating field [28], and it has been shown that cells exposed to an alternating field for a period of time can become more resistant to field pulses of high intensity and long duration (field stability) [28]. Heat is often produced during field exposure by Joule heating and by dielectric losses, and electrolysis may also occur at low frequencies[15]. Fuhr and others [15,41] showed that exposure of 3T3 and L929 fibroblast cells to a high frequency field (1-40 MHz) extended cell cycle time moderately (from 18 h to 26 h for the 3T3 fibroblast cells, for example), but did not significantly change their viability, motility, anchorage properties. However, a comprehensive study of AC field exposure effects on cells for sub-MHz frequencies, which is the most important range for DEP manipulations (see below), is not known to the authors. This problem will be addressed here.
The DEP force acting on a particle inside an electric field can be written in terms of the dipole approximation as [17]
| (1) |
where is the complex permittivity of the suspending medium and fCM is the so-called Clausius-Mossotti factor
of the particle that characterizes its DEP response in terms of its dielectric properties and those of the medium [2,3]. Useful and effcient DEP discrimination and separation of mammalian cells occur close to their DEP cross-over frequency (where Re(fCM)~0), as well as in the frequency range where Im(fCM) is a maximum [22,23]. For mammalian cells suspended in a typical electromanipulation medium (conductivity around 50 mS/m or less), the frequency region of interest is in the range 1 kHz-1 MHz [15,22,23]. In this paper, the effects of the AC field exposure of DS19 Friend murine erythroleukemia cells in the frequency range 100 Hz-10 MHz are reported. Modifications of cell growth were observed and the causes are analyzed both theoretically and experimentally in terms of field-induced membrane potentials and electrochemical effects.
2. Materials and methods
2.1. Cell culture
DS19 Friend murine erythroleukemia cells were seeded at 3.0 × 10⁴ cells/ml and grown in 10 ml of RPMI medium supplemented with 10% fetal bovine serum, 1 mM glutamine and 20 mM HEPES buffer (Gibco, Grand Island, NY) in 25-cm2 vented culture flasks (Greiner, Germany) at 37°C under a 5% CO2/95% air atmosphere in a humidified incubator. Cells were harvested after about 48 h while in log phase when the cell concentration had reached about 106 cells/ml. Cell viability was above 98% as determined by trypan blue dye exclusion.
2.2. Electrode chamber
Each exposure chamber was made by gluing (3140 RTV, Dow Corning Inc., Michigan) an autoclavable polymethylpentene plastic ring (36 mm diameter×9 mm high×2 mm thick) over a glass substrate that supported a parallel electrode array. Gold electrode arrays, kindly provided by Dr. Giovanni De Gasperis and Tom Anderson, were fabricated using standard photolithography: gold-coated glass blanks (250 nm gold over a 100 nm titanium seed layer on 50 mm×50 mm glass; Thin Film Technology, California) were spin coated at 3000 rpm with S1830 photoresist (Shipley, Massachusetts) to ~1 μm thickness. The photoresist was polymerized over a hot-plate at 110°C for 1 min, and then exposed to UV light through a positive chrome mask (Process Technologies Inc., Wisconsin), using a mask aligner (HTG System 3A, California). The exposed photoresist was developed with MF351 (Shipley, Massachusetts) and the gold and titanium layers were then etched, respectively, in gold etchant type TFA and titanium type TFTN (Transene Company, Massachusetts). Finally, residual photoresist was removed from the electrode pattern with acetone. The electrode geometry chosen consisted of parallel elements connected alternately to bus lines on either side of the substrate. The parallel electrode elements were 36 mm long, 100 μm wide and spaced by 100 μm gaps.
2.3. Field exposure procedure
Harvested cells were first spun down at 223×g for 10 min and then diluted in sterile isotonic sucrose/dextrose buffer (8.5% sucrose plus 0.3% dextrose, 280 mOs/kg) to give a cell density between 0.8 and 1.0×10⁶ cells/ml. The conductivity of this suspension was then adjusted by adding culture medium to attain target values of 56 mS/m, 30 mS/m or 10 mS/m. Prior to each experiment, the electrode chambers were sterilized by autoclave. Exposure experiments were conducted under a laminar flow tissue culture hood (BioCARD Hood, the Baker Company, Maine). For each experiment, a volume of 1 ml cell suspension was pipetted into an exposure chamber to provide a 1 mm thick cell suspension layer over the electrode array.
To expose cells to AC electrical fields, a sinusoidal voltage (HP 8116A signal generator) was applied between adjacent electrodes of the arrays, and the voltage and frequency of the applied signal were monitored using an oscilloscope (Hitachi V-1065A). When applying the voltage signals, the signal generator was initially set to minimum voltage output, and the signal was ramped up to the desired voltage over 20 s to minimize pulse effects. After a timed field exposure of 5-40 min, cells were collected from the chamber by rinsing it four times with 1 ml aliquots of culture medium, and the collected cells were then centrifuged at 223×g for 10 min and resuspended in 1 ml culture medium. Cell viability was checked by the trypan blue method and the cells were then returned to 25-cm2 vented culture flasks in their normal complete growth medium at a density of 2×10⁴ cells/ml. Cell growth and viability curves were measured by counting a 40 μl aliquot taken from the culture once every 12 h. Control cell samples underwent identical manipulations to exposed ones except that electrical fields were not applied to the cells while they were on the electrodes.
Exposure experiments were conducted at room temperature (22-24°C). The temperature of the cell suspension was measured during field exposure using an electronic thermometer (OMEGA HH23, Omega Engineering, Connecticut) equipped with a 33 gauge hypodermic needle thermistor probe. In some experiments, we added catalase (C-40, Sigma Chemical Co., St. Louis, MO, 17 000 U/mg) to the exposure medium at concentrations between 2.5 ng/ml and 800 ng/ml (42.5 and 13 600 U/ml).
2.4. Flow cytometry
A Bryte HS flow cytometry system (Bio-Rad Microscience Ltd, UK) was used to study the changes in cell cycle kinetics after field exposure. About 1×10⁶ cells were spun down at 223×g for 10 min and fixed in a 1 ml DNA analysis kit (Kinesis 50, Bio-Rad) at 0 h, 10 h, 22 h, and 34 h after field exposure (corresponding to about 0, 1, 2 and 3 cell doubling times). Cell size distributions, from the forward and side light scattering, and cell DNA content histograms, revealed by the red (propidium iodide) fluorescence, were then measured by flow cytometry.
2.5. Determination of electrode polarization effects
Part of the voltage applied to the parallel electrode array was dropped across the electrode/solution interface because of the interfacial impedance associated with electrode polarization [42]. Hence the voltage acting on the bulk suspending medium was smaller than that applied to the electrodes. In order to permit accurate analysis of induced cell membrane potentials, we quantified this electrode polarization by measuring the frequency dependence of the voltage across the exposure chambers using an HP 8116A signal generator and an Hitachi oscilloscope V-1065A. The generator has an output impedance of 50 Ω, and the source voltage was divided among the source impedance, the electrode/solution interface, and the bulk suspending medium. Using an optimization procedure described in [24], we derived the impedances of the interface and the bulk solution and thereby determined the actual voltages dropped across the interface and bulk solution.
2.6. Hydrogen peroxide assay
After field exposure in the absence of cells, solutions were assayed for hydrogen peroxide using a protocol designed by Robert Meade based on [43,44]. A stock peroxidase solution was made by mixing 4.9 ml 1 M sodium phosphate buffer, 4.9 ml H2O, 100 μl 0.1% peroxidase and 100 μl 1% o-dianisidine. After the field exposure experiment, an aliquot of 600 μl of field-exposed solution was taken from the exposure chamber, and mixed with 500 μl of the peroxidase solution. The presence of hydrogen peroxide was revealed by a color shift of the mixture from clear to brown.
3. Results
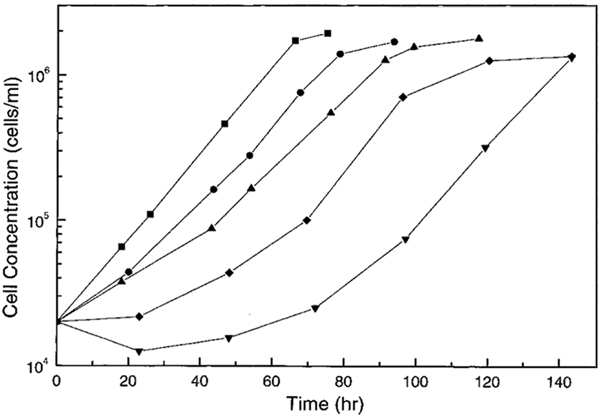
For convenience, the field exposure conditions under which each measurement was conducted will be denoted as (conductivity, frequency, voltage, exposure time). For example, (56 mS/m, 1 kHz, 5 V, 30 min) will indicate that the experimental conditions were medium conductivity = 56 mS/m, applied field frequency = 1 kHz and voltage = 5 V peak to peak (p-p), and the exposure duration = 30 min. Fig. 1 shows typical growth curves that we obtained under several exposure conditions. In general, three parameters characterize a cell growth curve: the initial lag time (LT) before the cells entered log growth phase, the cell doubling time (DT) during the log growth phase, and, the plateau cell density at which cell proliferation ceased. The third parameter was found to be unaffected by field treatments. The lag time was prolonged for some field exposure conditions, and this change depended on the frequency and voltage of the applied field, the medium conductivity, and the exposure duration. The doubling time was also affected, though less significantly. Fig. 2 shows a scatter plot of cell doubling time versus lag time for many replicates of the conditions (56 mS/m, 1 kHz, 5 V, 30 min) and of the corresponding control samples. All samples exposed under these conditions had a prolonged lag time and a mean doubling time that was about 30% larger and had a wider variance than control samples. To simplify the study of the field exposure effects and focus on their dependence on field and medium conditions, we will characterize cell growth changes for our culture systems with a single parameter that we will call the relative lag time (RLT). This is the time taken for a given cell population seeded at 2×10⁴ cells/ml to reach 1.28×10⁶cells/ml (6 doublings) minus the time taken for the corresponding control sample to do the same. This parameter combines the effects of increases in both doubling time and lag time.
Fig. 1.
Typical growth curves for cells under different AC field exposure conditions: ∎, control (not exposed) sample for a medium conductivity of 56 mS/m; ●, (56 mS/m, 1 kHz, 5 V, 10 min); ▴, (30 mS/m, 1 kHz, 5 V, 30 min); ◆, (56 mS/m, 1 kHz, 5 V, 30 min); ▾, (56 mS/m, 1 kHz, 7 V, 30 min) (see text for an explanation of the exposure condition notation).
Fig. 2.
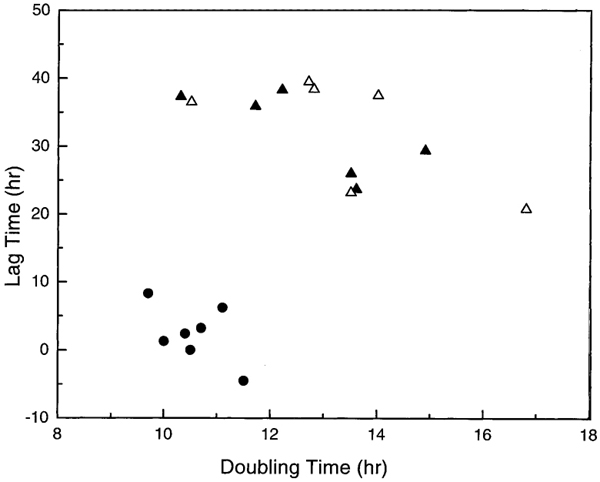
Scatter plot of cell growth lag time versus doubling time under the conditions (56 mS/m, 1 kHz, 5 V, 30 min). ●, control samples; ▴, field-exposed samples; Δ, unexposed cells treated with field-exposed medium.
During field exposure and depending on the medium conductivity, a temperature rise occurred in the solutions, but this rise was never more than 5°C. For field conditions under which cell growth was delayed after field exposure, we found that cooling the chamber by sitting it on ice did not reduce the lag effect. Furthermore, placing cells on plates of different temperatures did not cause growth changes unless the chamber temperature exceeded 38°C. Because all of our field exposure experiments were started at ~22°C, the maximum temperature developed during field exposure was ~27°C and therefore variations in cell growth induced by field exposure could not have been caused by thermal effects.
All the exposure conditions except two yielded healthy-looking cells with viabilities higher than 95% as measured by trypan blue dye exclusion. The two exceptional conditions were (30 mS/m, 100 Hz, 5 V, 30 min) and (56 mS/m, 100 Hz, 5 V, 30 min), corresponding to a very low frequency and high conductivities. For these cases, cell viabilities after exposure were below 50%. It follows that typical conditions used for the dielectrophoretic manipulation of cells (1 kHz < frequency < 1 MHz, conductivity < 56 mS/m) do not compromise cell membrane integrity.
3.1. Growth of control samples
Control samples that had been manipulated in the sucrose/dextrose buffer at different conductivities but without field exposure exhibited lag times of less than 3 h, a value comparable to that for cells passaged normally during culture. The growth parameters for both control samples and cultured cells are summarized in Table 1. These results indicate that the manipulation steps and buffers used in the exposure experiments (including two washes of 10 min each at 223×g and exposure to sucrose/dextrose solution for 30 min) did not significantly affect cell viability and growth.
Table 1.
Cell growth parameters for cultured cells, control samples and cells one passage after field exposure
| Conductivity | Doubling time (h) | Lag time (h) | Time to reach 1.28 × 10⁶/ml (h) |
|---|---|---|---|
| Cultured cells | 9.4 ± 0.5 | 1.0 ± 3.2 | 60.0 ± 3.8 |
| 56 mS/m | 10.6 ± 0.6 | 2.4 ± 4.2 | 69.4 ± 7.5 |
| 30 mS/m | 10.7 ± 1.3 | -1.5 ± 2.4 | 64.3 ± 0.6 |
| 10 mS/m | 11.4 ± 0.8 | -0.2 ± 6.7 | 68.3 ± 6.7 |
| Passage 1 following (56 mS/m, 1 kHz, 5 V, 30 min) | 9.6 ± 0.9 | 3.1 ± 3.9 | 62.0 ± 2.0 |
3.2. Dependence of cell growth characteristics on field exposure conditions
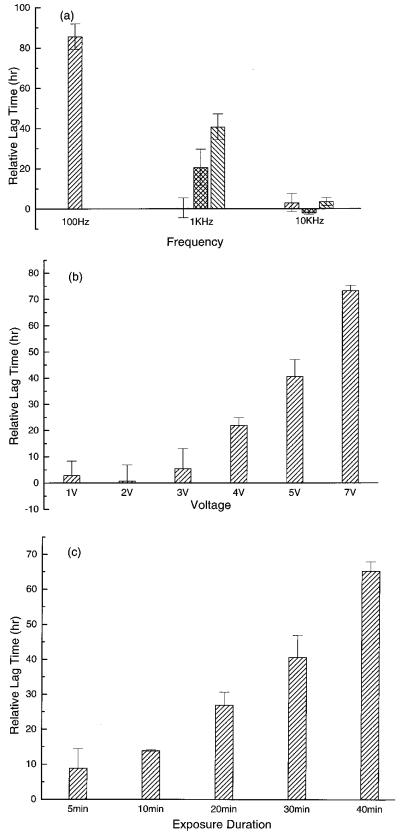
We found that exposure to electrical fields above 10 kHz had no detectable efect on DS19 cell growth kinetics for up to 7 V p-p and for all the three conductivities (56 mS/m, 30 mS/m and 10 mS/m) studied. However, below 10 kHz, field exposure tended to extend the lag phase. For example, the effects of 5 V p-p and 30 min exposure are shown in Fig. 3a. Evidently, the lower the applied frequency, the more prolonged was the lag phase. As already indicated, at 100 Hz, and for conductivities ≥ 30 mS/m, more extreme effects were observed. After field exposure cell viability fell below 50% and the cells shrank to about half their normal radius. During the 120-h study period in culture following exposure, these cells did not grow or change their abnormally small size, and the viability remained below normal.
Fig. 3.
(a) The frequency and conductivity dependences of the relative lag time for field exposures at 5 V and 30 min for medium conductivities 10 mS/m (right-hatched bars), 30 mS/m (cross-hatched bars) and 56 mS/m (left-hatched bars). (b) Voltage dependence of the relative lag time under the conditions (56 mS/m, 1 kHz, 1-7 V, 30 min). (c) Exposure time dependence of the relative lag time under the conditions (56 mS/m, 1 kHz, 5 V, 5-40 min).
Fig. 3a also shows that, for a given field strength and frequency, cells exposed in higher conductivity media experienced more changes in growth characteristics. The impact on cell growth also depended on the voltage applied to the electrodes. For example, Fig. 3b shows results for the conditions (56 mS/m, 1 kHz, 1-7 V, 30 min) from which it is evident that there existed a threshold voltage of about 3 V below which cell growth was not affected and above which cell growth lag time was extended, increasing further with increasing voltage. Finally, cell growth was dependent on the field exposure duration as illustrated in Fig. 3c for the conditions (56 mS/m, 1 kHz, 5 V, 5-40 min). Clearly the longer the duration of exposure the more delayed was the cell growth.
3.3. Modification of cells by field exposure was not passed on to the next passage of cells
To see if the modification of cell growth characteristics induced by field exposure heralded a permanent alteration in cell growth properties, we re-seeded field-treated cells after they had reached log phase. Doubling and lag times for the passaged cells showed no deviation from the normal growth pattern of the maternal DS19 line. Results illustrating this response for cells passaged once following exposure to the conditions (56 mS/m, 1 kHz, 5 V, 30 min) are given in the last row of Table 1.
3.4. Cell cycle studies after field exposure
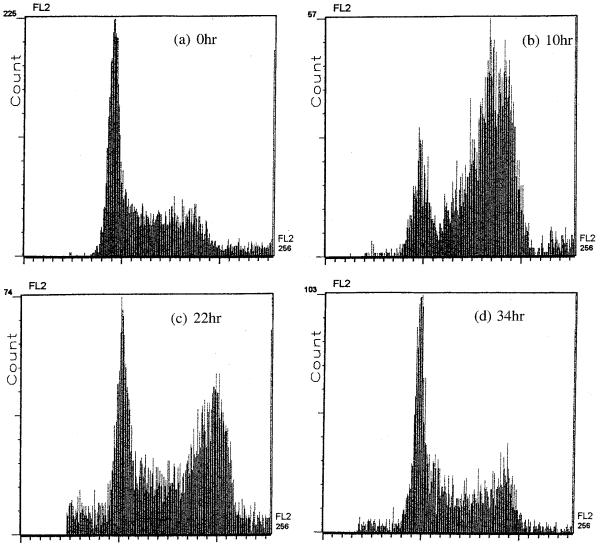
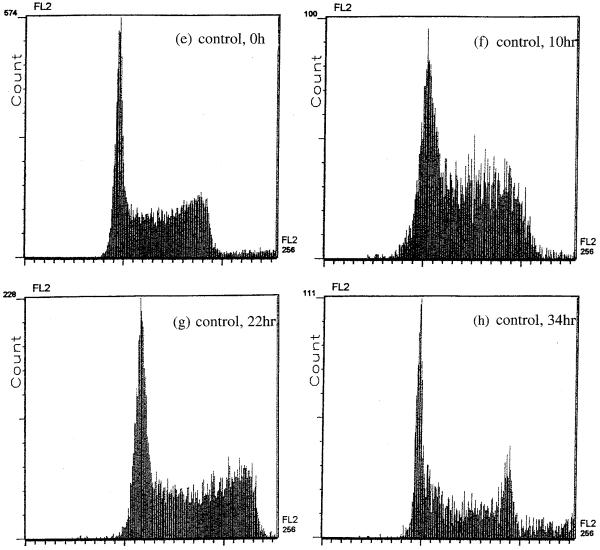
To determine the factors causing the delay in cell proliferation, we performed cell cycle analysis after exposure to the conditions (56 mS/m, 1 kHz, 5 V, 30 min). Fig. 4a-h gives histograms of field-exposed and control samples at about 0, 1, 2 and 3 doubling times following field exposure. Control samples showed no difference from normally cultured cells, having a cell cycle phase distribution of G0/G1: ~40%, S: ~30%, G2/M: ~20%. Whilst the cell cycle phase distribution of the field-exposed samples showed no change from control samples immediately after exposure, there were significantly more cells in G2/M than in other phases (G0/G1: ~10%, S: ~10%, G2/M: ~70%) after one doubling time. This shows that although the cells were able to synthesize DNA in S phase, they were unable to complete mitosis. By about 2 doubling times following exposure, the cell cycle kinetics was less unbalanced with the ratio between G0/G1, S and G2/M phases becoming less abnormal. For up to 3 doubling times, there was a subpopulation of cells having a DNA complement below diploid, suggesting that some cells were dying (by apoptosis or necrosis). From about 3 doubling times on, however, the cell cycle phase distribution was not significantly different from that of the control sample and, evidently, normal cell cycle kinetics had been re-established.
Fig. 4.
Flow cytometric study of cell cycle kinetics showing cell frequency versus DNA content at 0 h (a), 10 h (b), 22 h (c) and 34 h (d) after field exposure under the conditions (56 mS/m, 1 kHz, 5 V, 30 min). (e-h) Histograms for the corresponding control sample. At 10 h following field exposure, there was a significant increase in the frequency of cells in G2/M. At 22 h following exposure, there were still more cells than usual in G2/M. By 34 h, normal cell cycling has been re-established. From 10 to 34 h, some cells with a sub-G0 complement of DNA are apparent in the exposed sample, indicating that there was a subpopulation of dying cells.
These cell cycle findings are consistent with our growth curve study in which the average lag time for the same exposure conditions (56 mS/m, 1 kHz, 5 V, 30 min) was 40.7 h, or about 3 doubling times. Because cells approximately double in volume as they synthesize DNA in S phase and enter G2, the results are also consistent with our observation, during manual cell counting, that at about 1 doubling time cells appeared bigger on average than in normal cultures. After about 1 doubling time, cells of normal size began to appear, but there was always a small subpopulation of cells that was much bigger than usual. As time went by, this subpopulation became smaller while the cells in it got bigger, some attaining radii as large as 5 times normal. It appears that cells in this subpopulation were capable of nuclear division though not of mitosis. This small population was observed in the cell cycle analysis as cells having 2n times the normal diploid complement of DNA where n ≥ 1.
In summary, Fig. 4 indicates that some modification of the cells occurred during field exposure that inhibited their ability to cross the G2/M phase boundary and divide. Cells that could not divide died off gradually (probably by apoptosis because the viability of the whole population, as tested by trypan blue dye exclusion, never dropped notably). Cells that did manage to divide proliferated to provide normal populations.
4. Discussion
Cells are exposed to AC electrical fields during the their dielectrophoretic manipulations. In this paper, we studied the effects of such exposure under the conditions most appropriate to DEP manipulations of cells, especially to cell DEP/FFF (field-flow fractionation) [45,46] sorting and DEP trapping [22,23,25]. Our experiments showed that under these conditions cell membrane integrity as revealed by trypan blue dye exclusion test was not compromised, and that cells were not stopped from proliferation. However, field exposure under some conditions may cause delays in cell growth. We considered it essential to investigate the mechanisms for such delays and to determine whether they were related to the direct action of the field on the cells. Understanding the mechanism might allow for the effects to be minimized and also help in optimizing the field conditions for efficient manipulation.
It is well known that many agents (such as anti-cancer drugs, radiation, free radicals and ROIs) can cause cell cycle delays in mammalian cells [47-52], and particularly delays or even arrest in the G2/M phase [47-50]. These agents typically are DNA-damaging [47,48,50,52]. When G2/M arrest of the cell cycle occurs, there will be accumulation of cells at the G2/M phase boundary, and this event has been associated with genetically programmed cell death [50,52]. If such reactive agents were involved in the cell growth effects observed here, it was not clear whether these were produced as a direct result of the field acting on the cells or whether they were created externally by, for example, electrochemical processes in the media. We therefore investigated the field stresses on the cells and the effects of field exposure for cell-free media.
4.1. AC field induced membrane potential did not cause the observed cell growth modification
First, we examined theoretically whether the electric field induced stresses on cell membranes might have damaged them. At frequencies below 10 MHz, an electrical field drops mainly across the poorly conducting cell membrane, concentrating most of the stress on the membrane [53]. The electrical field distribution above a planar parallel electrode array as used in our experiments can be readily calculated using Green's Theorem Method [54] and the result is given in Fig. 5. Let us consider a cell of radius r and membrane thickness d inside an electrical field of angular frequency ω Assume that the membrane permittivity is εmem and its conductivity is σmem and that the cell interior permittivity is εint and its conductivity is σint. Then the membrane potential at polar angles (ϑ, φ) on the surface of the cell can be derived, using the single shell model for the cell [11], as (up to field derivative terms):
| (2) |
where
and
is lth Clausius-Mossotti factor of the cell [19].
is cell effective complex permittivity, ε*m is the complex permittivity of the suspending medium, and each complex permittivity is defined as
The form factors Ai are given by
Fig. 5.
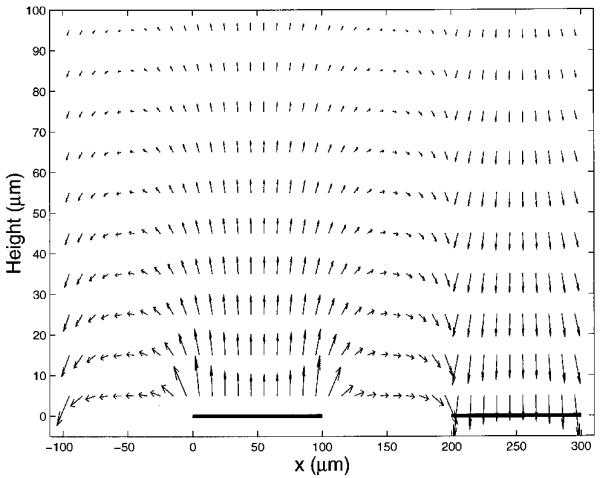
Vector representation of the electrical field distribution above the electrode plane for the parallel electrode configuration used in this study. The bold solid lines on the x-axis represent positions of the parallel electrodes.
In the case of a uniform DC field along the z direction, , K1=1 and f1CM = -0.5, so that Eq. 2 reduces to the familiar form [26,39]:
| (3) |
Eq. 2 indicates that the membrane potential depends on the local field experienced by the cell which, in turn, depends on the cell position. Inside a nonuniform standing field like that used in our experiments, the overall field stress also results in a nonzero dielectrophoretic force given by
| (4) |
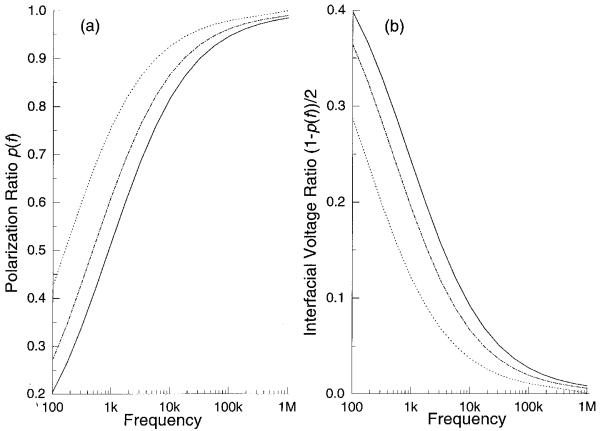
where p(f) is the polarization factor, namely, the ratio of the voltage dropped across the bulk solution to that applied to the electrodes. This dielectrophoretic force can be made suffciently strong to overcome the sedimentation force and cause cell levitation in the sub-MHz frequency range where Re(fCM) is negative, an effect that is exploited in cell sorters based on DEP/FFF [45,46]. Fig. 6a shows the plot for the average frequency dependence of the polarization factor p(f), derived from our impedance measurements of the field exposure chambers [24]. This is expressed in Fig. 6b in terms of (1-p(f))/2, the proportion of the source voltage dropped at each interface. Knowing the electrode polarization ratio and by using Eq. 4, we calculated the cell levitation height as a function of frequency, using our earlier reported size and dielectric parameters for DS19 cells based on electrorotation [13], r = 5.41 μm, εmem = 9.0ε0, σmen = 3.5×10⁻⁷ S/m, εint = 87ε0 and σint = 0.89 S/m, and we give the result for the conditions εm = 80ε0, σm = 56 mS/m and 5 V p-p in Fig. 7. Densities of DS19 cells and medium were taken to be 1.092 g/cm3 and 1.033 g/cm3 respectively. Cell levitation heights were measured microscopically and were found to be in good agreement with the theoretical predictions given in Fig. 7 as well as for other experimental conditions.
Fig. 6.
Frequency dependence of the electrode polarization ratio for conductivities 10 mS/m (dashed line), 30 mS/m (dot-dashed line) and 56 mS/m (solid line). From (b) one can see that the polarization voltage is higher for higher medium conductivity and lower frequency.
Fig. 7.
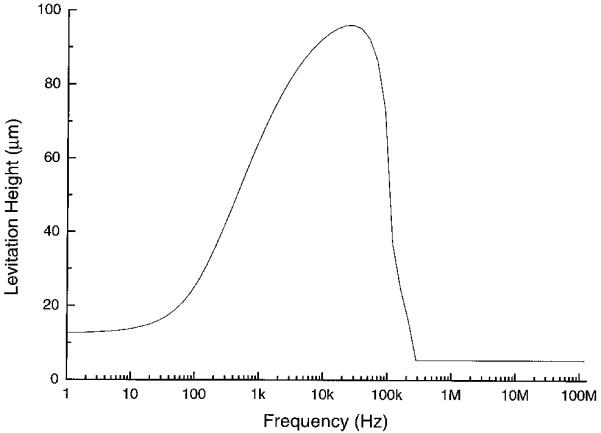
Levitation height of a typical DS19 cell during field exposure for σ= 56 mS/m and 5 V p-p. At high frequencies (above 300 kHz), the cell is not levitated by the field, with its height equals its radius, 5.41μm.
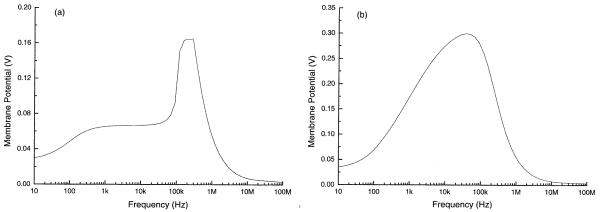
Taking both the polarization and levitation effects into consideration, we could then estimate the membrane potential experienced by the cells during field exposure. Fig. 8a gives the maximum values of the induced membrane potential averaged across the electrode plane as a function of applied field frequency. The medium dielectric parameters were chosen to be εm = 80ε0 and σm = 56 mS/m, and the signal applied to the electrodes was assumed to 5 V p-p. The drop in the induced membrane potential at low frequencies is due to the electrode polarization effect.
Fig. 8.
Maximum membrane potential for a typical DS19 cell induced by the electric field averaged over the electrode plane as a function of the applied field frequency under the condition σ = 56 mS/m and 5 V p-p. (a) The levitation height (as given in Fig. 7) was taken into consideration. (b) Zero levitation height over the whole frequency range was assumed.
It is known from existing work on field exposure effects during cell electroporation and electrofusion that the membrane breakdown potential for mammalian cells is about 1 V for pulse signals [26,27], however, the authors are not aware of any studies on cell membrane breakdown characteristics in AC fields. Assuming that the breakdown voltage for our AC case is similar to that for pulse signals, one can see from Fig. 8a that the induced membrane potential experienced by the cells in our field exposure experiments is, even for the maximum case, much below that needed to cause membrane breakdown. Indeed, even if cells were not levitated at all, but instead remained on the bottom surface of the chamber, the maximum induced cell membrane potential (shown in Fig. 8b) would still be significantly below the breakdown value for the voltages used in our experiments. Furthermore, the frequency dependence of the membrane potential is completely at variance with the frequency dependence of the field exposure effects on cell growth, as can be easily seen by comparing Figs. 3 and 8. These data together suggest that the electric field stress across the cell membrane was not only insufficient to cause irreversible impacts on the cell membranes but also, by virtue of its dissimilar frequency characteristics, not related to the observed modifications of cell growth behavior.
4.2. Exposure of cells to field-treated cell suspending medium
In order to assess whether the electrical field was acting on the medium rather than directly on the cells, we exposed the cell-free suspending media to the same field exposure conditions and then, immediately after removing the field, added cells into the treated solution for 30 min. We compared the growth curves of these cells to those exposed directly to the electrical field under the same conditions and found similar effects in growth characteristics. In other words, the impact of exposed media on the lag time and doubling time for unexposed cells was similar to the impact of direct cell field exposure (see Fig. 2). This clearly demonstrates that the modifications observed in cell growth characteristics following field exposure was not caused by the direct action of the electrical field on the cells but, rather, by products in the solution resulting from field exposure.
4.3. H2O2 was generated during field exposure
One natural guess for toxic electrochemical products is the family of ROIs. ROIs are known to cause biological damage [55-59] including lipid peroxidation [56], and DNA [57,58] and protein damage [55]. For example, lipid peroxidation and generation of ROIs during the processes of electrofusion and electropermeabilization have been reported [29,36,37]. Among ROIs, H2O2 is probably one of the most important products having long-term effects because it can break down in the presence of transition metal ions to produce the most reactive and damaging of the oxygen free radicals, the hydroxyl radical (•OH) [56,58]. It has been shown that H2O2 can cause modifications and damage to cells [60-70]. Depending on its concentration in cell culture, it can alter cell membrane permeability [65,67] and can cause temporary or permanent cell cycle arrest [61,66,68,69], apoptosis, senescence and necrosis. In the case of temporary arrest of cells in one or more phases of the cell cycle, the cell cycle time will be prolonged. In our study on cell growth and cell cycle kinetics following field exposure, we have observed some of these effects.
To determine whether H2O2 was generated during field exposure, we assayed the field-treated media. We found that for all conditions under which cell growth was delayed by field exposure, the media tested positively for H2O2. This showed that H2O2 was produced in the medium during field exposure.
To determine whether H2O2 production depended on the particular cell suspending medium used in our experiments, we carried out field exposure experiments in which we replaced RPMI by PBS (phosphate-buffered saline) or KCl, and/or replaced the sucrose/dextrose solution with sorbitol, inositol or pure sucrose solution. None of these changes resulted in any difference in the growth curve study or the H2O2 assay. In another experiment, we made medium of H2O and RPMI only, in this case the field-treated medium tested negative for H2O2, showing that sugar was required for H2O2 production. To eliminate the possibility that sugar-oxidizing enzymes such as glucose oxidase were present due to impurities of the sugar or other ingredients in the cell suspending medium, we made a medium using boiled sucrose/dextrose buffer and boiled 280 mM KCl solution. We then exposed the medium to the electrical field under the conditions (56 mS/m, 1 kHz, 5 V, 30 min) and assayed it for H2O2 after that. The field-treated medium again tested positive for H2O2. This indicated that the H2O2 generation during field exposures depended on the presence of sugar but not on any sugar-oxidizing enzyme.
4.4. Adding catalase to the cell suspending medium
Catalase catalyzes the decomposition of H2O2 to water and oxygen:
| (5) |
Thus if H2O2 were the culprit in mediating the cell growth perturbations seen after field exposure, adding catalase should help to reduce or eliminate this influence. We therefore studied the effect of adding catalase at different concentrations to the exposure media in field exposure experiments. Results for the conditions (56 mS/m, 1 kHz, 5 V, 30 min) are given in Fig. 9. Clearly, adding catalase reduced the lag in growth, and for concentrations around 50-100 ng/ml, the growth pattern of the exposed samples was restored to that of the controls. Addition of catalase to the exposure medium for other conditions yielded similar restorative effects except for the two conditions (30 mS/m, 100 Hz, 5 V, 30 min) and (56 mS/m, 100 Hz, 5 V, 30 min) under which cell viability was greatly reduced and cells were not able to grow for up to 120 h. For these two cases, catalase did not exhibit protective properties, showing that other electrochemical agents were likely at work.
Fig. 9.
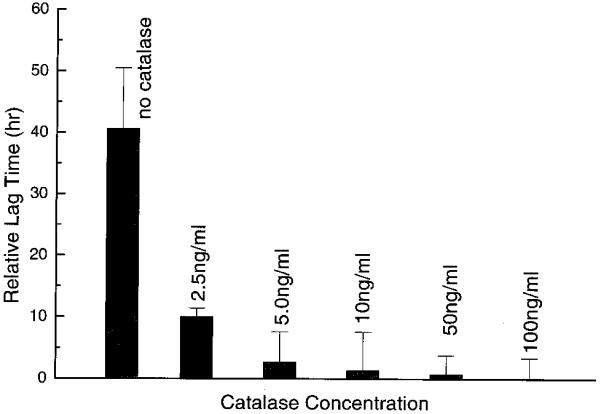
Effect of catalase on cell growth lag time following field exposure for the conditions (56 mS/m, 1 kHz, 5 V, 30 min).
The possibility of removing differences in cell growth characteristics between exposed and control samples by adding catalase further proves that direct electrical field stress on cells did not cause the observed delays in cell growth in the field exposure experiments.
4.5. Relationship of cell growth lag time to the electrode polarization voltage
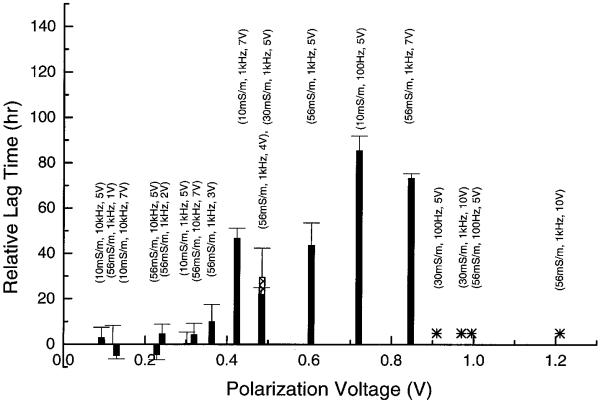
From Fig. 6b it can be seen that the interfacial voltage between the electrode and bulk solution is higher for higher conductivities, lower frequencies and higher applied voltages. This pattern coincides exactly with the observed cell growth lag time dependencies on medium conductivity, field frequency and voltage. In Fig. 10, a plot of the relative lag time versus the p-p interfacial voltage is shown. In this figure, an asterisk means that the cells did not grow for up to 120 h. A clear relationship between increasing polarization voltage and longer lag times is apparent. Furthermore, there appear to be two threshold voltages for the onset of cellular effects. Below about 0.4 V, cells were not only viable after field exposure but also showed no significant delay in cell growth. Between about 0.4 V and 0.9 V, cell viability was not affected, however, and cells showed increasing lag time in proliferation with increasing voltage. That increased lag could be eliminated by adding catalase, suggesting that the field effect was mediated by electrochemically produced H2O2. Finally, above about 0.9 V, most cells were irreversibly damaged by field exposure, cell viability was low (<50%) after the exposure, and adding catalase had no effect. To test our speculation, we ran two more experiments in which the polarization voltage exceeded 0.9 V: (30 mS/m, 1 kHz, 10 V, 30 min) and (56 mS/m, 1 kHz, 10 V, 30 min). As expected, cells did not grow after field exposure under these conditions. It is worth mentioning that by virtue of the frequency dependence of Vinterfacial/Vapplied, as shown in Fig. 6b, the DEP voltage that can be applied without damaging cells increases with increasing frequency.
Fig. 10.
Relationship between the relative lag time and the p-p polarization voltage. An asterisk signifies that no cell growth was observed for up to 120 h after field exposure. Below ~0.4 V, no significant lag was observed after field exposure. From ~0.4 V to ~0.9 V, there was significant lag in cell growth after field exposure, but cell viability was high (>95%). Above ~0.9 V, cell viability was low (<50%) after field exposure, and there was no sign of cell growth for up to 120 h.
5. Conclusion and perspectives
We have studied the field exposure effects on DS19 cells under conditions typical for the dielectric manipulation of cells. Within the frequency range (1 kHz-1 MHz) mostly used for cell dielectrophoretic characterization and manipulation, we found that applied electrical fields did not cause any significant reduction in cell viability, as tested by trypan blue dye exclusion. However, cell modifications by electrochemically produced H2O2 during field exposure resulted in extended lag phases in cell growth following exposure. This modification was not passed on to the next passage of cells, and could be eliminated by adding catalase to the cell suspending medium. Our results show that dielectrophoretic characterization and manipulation of cells does not alter cell viability or cell genetic characters and further establishes the potential that dielectrophoretic techniques have for non-invasive cell characterization, sorting and separation. This conclusion is significant for furthering the biological and medical applications of dielectrophoresis. The ability to characterize and separate cell subpopulations without modifying cell properties or damaging the cells is crucial to numerous biological and medical applications. For example, cell purification is a prerequisite for life-saving procedures such as autologous bone marrow transplantation [22,23].
It would be interesting to find out exactly what electrochemistry went on during field exposure, how the hydrogen peroxide was produced, what the threshold voltage is for such production to happen, and whether modifications of the electrode such as a change of material, geometry or coating could help to reduce the electrochemical effect. A good understanding on these issues may help to improve electrode design for more efficient cell manipulations. The dependence of the cell growth lag time on the polarization voltage suggests that H2O2 was generated at the electrode surface, and depended on the polarization at the interface between the electrodes and the medium. It follows that by changing the electrode material to a less polarizable one (using platinum black electrodes rather than gold, for example), might reduce the modification of cells during field exposure.
Our observation that sugar was essential for the production of H2O2 during field exposure implied that the peroxide was generated through sugar oxidation, and it was generated without the presence of sugar oxidase. These findings could lead to significant applications. In particular, the discovery of glucose oxidation without glucose oxidase under the field conditions in this paper may provide new ideas for developing electrocatalytic glucose sensors. Glucose sensing is very important in many medical applications including diabetes management [71] and neonatal hypoglycemia [72]. Compared with electrochemical biosensors for glucose, which depend on glucose oxidase [73], the electrocatalytic effect here did not require the involvement of enzyme, and may have the advantage of long-term stability as would be favourable for implantation [74].
Acknowledgements
This work is supported by NIH Grant R01DK51065-01 from the National Institute of Diabetes and Digestive and Kidney Disease and a Cock-rell Foundation UCF Scientific Achievement Fellowship. We thank Jamileh Noshari and Badri Fazel-Hashemi for tissue culture work, Robert Meade for designing the H2O2 detection assay, Dr. Ying Huang for the help in flow cytometry, Dr. Giovanni De Gasperis and Tom Anderson for providing electrodes, and Dr. Giovanni De Gasperis, Dr. Ying Huang, Jody Vykoukal and Dr. Xiaobo Wang for insightful discussions.
References
- [1].Lynch PT, Davey MR. Electrical Manipulation of Cells. Chapman and Hall; New York: 1996. [Google Scholar]
- [2].Zimmermann U, Neil GA. Electromanipulation of Cells. CRC Press; Boca Raton, FL: 1996. [Google Scholar]
- [3].Pohl HA. Dielectrophoresis. Cambridge University Press; London: 1978. [Google Scholar]
- [4].Fuhr G, Hagedorn R, Müller T, Benecke W, Wagner B, Gimsa J. Studia Biophys. 1991;140:79–102. [Google Scholar]
- [5].Hölzel R, Lamprecht I, Mischel M. In: Physical Characterization of Biological Cells. Schutt W, Klinkmann H, Lamprecht I, Wilson T, editors. Verlag Gesundheit; Berlin: 1991. pp. 273–294. [Google Scholar]
- [6].Fuhr G, Arnold WM, Hagedorn R, Müller T, Benecke W, Wagner B, Zimmermann U. Biochim. Biophys. Acta. 1992;1108:215–223. doi: 10.1016/0005-2736(92)90028-k. [DOI] [PubMed] [Google Scholar]
- [7].Huang Y, Wang X-B, Tame JA, Pethig R. J. Phys. D Appl. Phys. 1993;26:1528–1535. [Google Scholar]
- [8].Wang X-B, Huang Y, Burt JPH, Markx GH, Pethig R. J. Phys. D Appl. Phys. 1993;26:1278–1285. [Google Scholar]
- [9].Arnold WM, Zimmermann U, Naturforsch Z. 1982. pp. 908–915.
- [10].Mischel M, Voss A, Pohl HA. J. Biol. Phys. 1982;10:223–226. [Google Scholar]
- [11].Gimsa J, Glaser R, Fuhr G. In: Physical Characterization of Biological Cells. Schütt W, Klinkmann H, Lamprecht I, Wilson T, editors. Verlag Gesundheit; Berlin: 1991. pp. 295–323. [Google Scholar]
- [12].Kaler KVIS, Xie J-P, Jones TB, Paul R. Biophys. J. 1992;63:58–69. doi: 10.1016/S0006-3495(92)81586-2. [DOI] [PMC free article] [PubMed] [Google Scholar]
- [13].Wang X-B, Huang Y, Gascoyne PRC, Becker FF, Hölzel R, Pethig R. Biochim. Biophys. Acta. 1993;1193:330–344. doi: 10.1016/0005-2736(94)90170-8. [DOI] [PubMed] [Google Scholar]
- [14].Becker FF, Wang X-B, Huang Y, Pethig R, Vykoukal J, Gascoyne PRC. J. Phys. D Appl. Phys. 1994;27:2659–2662. [Google Scholar]
- [15].Fuhr G, Müller T, Schnelle T, Hagedorn R, Voigt A, Fiedler S, Arnold WM, Zimmermann U, Wagner B, Heuberger A. Naturwissenschaften. 1994;81:528–535. doi: 10.1007/BF01139998. [DOI] [PubMed] [Google Scholar]
- [16].Gascoyne PRC, Noshari J, Becker FF, Pethig R. IEEE Trans. Ind. Appl. 1994;30:829–834. [Google Scholar]
- [17].Wang X-B, Huang Y, Becker FF, Gascoyne PRC. J. Phys. D Appl. Phys. 1994;27:1571–1574. [Google Scholar]
- [18].Becker FF, Wang X-B, Huang Y, Pethig R, Vykoukal J, Gascoyne PRC. Proc. Natl. Acad. Sci. USA. 1995;92:860–864. doi: 10.1073/pnas.92.3.860. [DOI] [PMC free article] [PubMed] [Google Scholar]
- [19].Jones TB. Electromechanics of Particles. Cambridge University Press; London: 1995. [Google Scholar]
- [20].Talary MS, Miller KI, Hoy T, Burnett AK, Pethig R. Med. Biol. Eng. Comp. 1995;3:235–237. doi: 10.1007/BF02523050. [DOI] [PubMed] [Google Scholar]
- [21].Fuhr G, Zimmermann U, Shirley SG. Electromanipulation of Cells. CRC Press; Boca Raton, FL: 1996. Chap. 5. [Google Scholar]
- [22].Gascoyne PRC, Wang X-B, Huang Y, Becker FF. IEEE Trans. Ind. Appl. 1997;33:670–678. doi: 10.1109/28.585856. [DOI] [PMC free article] [PubMed] [Google Scholar]
- [23].Wang X-B, Huang Y, Becker FF, Gascoyne PRC. IEEE Trans. Ind. Appl. 1997;33:660–669. doi: 10.1109/28.585856. [DOI] [PMC free article] [PubMed] [Google Scholar]
- [24].Wang X-B, Huang Y, Wang XJ, Becker FF, Gascoyne PRC. Biophys. J. 1997;72:1887–1899. doi: 10.1016/S0006-3495(97)78834-9. [DOI] [PMC free article] [PubMed] [Google Scholar]
- [25].Huang Y, Wang X-B, Becker FF, Gascoyne PRC. Biophys. J. 1997;73:1118–1129. doi: 10.1016/S0006-3495(97)78144-X. [DOI] [PMC free article] [PubMed] [Google Scholar]
- [26].Zimmermann U. Biochim. Biophys. Acta. 1982;694:227–277. doi: 10.1016/0304-4157(82)90007-7. [DOI] [PubMed] [Google Scholar]
- [27].Schwister K, Deuticke B. Biochim. Biophys. Acta. 1985;816:332–348. doi: 10.1016/0005-2736(85)90501-2. [DOI] [PubMed] [Google Scholar]
- [28].Tsong TY, Astumian RD. Prog. Biophys. Mol. Biol. 1987;50:1–45. doi: 10.1016/0079-6107(87)90002-2. [DOI] [PubMed] [Google Scholar]
- [29].Biedinger U, Youngman RJ, Schnabl H. Planta. Vol. 180. 1990. pp. 598–602. [DOI] [PubMed] [Google Scholar]
- [30].Bogen DK, Ashe JW, Takashima S. Annu. Int. Conf. IEEE Eng. Med. Biol. Soc. 1990;12:1519–1520. [Google Scholar]
- [31].Chang DC, Reese TS. Biophys. J. 1990;58:1–12. doi: 10.1016/S0006-3495(90)82348-1. [DOI] [PMC free article] [PubMed] [Google Scholar]
- [32].Gass GV, Chernomordik LV. Biochim. Biophys. Acta. 1990;1023:1–11. doi: 10.1016/0005-2736(90)90002-6. [DOI] [PubMed] [Google Scholar]
- [33].Tsong TY. Biophys. J. 1991;60:297–306. doi: 10.1016/S0006-3495(91)82054-9. [DOI] [PMC free article] [PubMed] [Google Scholar]
- [34].Orlowski S, Mir LM. Biochim. Biophys. Acta. 1993;1154:51–63. doi: 10.1016/0304-4157(93)90016-h. [DOI] [PubMed] [Google Scholar]
- [35].Djuzenova CS, Sukhorukov VL, Klöck G, Arnold WM, Zimmermann U. Cytometry. 1994;15:35–45. doi: 10.1002/cyto.990150107. [DOI] [PubMed] [Google Scholar]
- [36].Gabriel B, Teissie J. Eur. J. Biochem. 1994;223:25–33. doi: 10.1111/j.1432-1033.1994.tb18962.x. [DOI] [PubMed] [Google Scholar]
- [37].Maccarrone M, Rosato N, Agro AF. Biochem. Biophys. Res. Commun. 1995;206:238–245. doi: 10.1006/bbrc.1995.1033. [DOI] [PubMed] [Google Scholar]
- [38].Meaking WS, Edgerton J, Wharton CW, Meldrum RA. Biochim. Biophys. Acta. 1995;1264:357–362. doi: 10.1016/0167-4781(95)00177-8. [DOI] [PubMed] [Google Scholar]
- [39].Sukhorukov VL, Djuzenova CS, Frank H, Arnold WM, Zimmermann U. Cytometry. 1995;21:230–240. doi: 10.1002/cyto.990210303. [DOI] [PubMed] [Google Scholar]
- [40].Djuzenova CS, Zimmermann U, Frank H, Sukhorukov VL, Richter E, Fuhr G. Biochim. Biophys. Acta. 1996;1284:143–152. doi: 10.1016/s0005-2736(96)00119-8. [DOI] [PubMed] [Google Scholar]
- [41].Fuhr G, Glasser H, Müller T, Schnelle T. Biochim. Biophys. Acta. 1994;1201:353–360. doi: 10.1016/0304-4165(94)90062-0. [DOI] [PubMed] [Google Scholar]
- [42].Schwan HP. Ann. Biomed. Eng. 1992;20:269–288. doi: 10.1007/BF02368531. [DOI] [PubMed] [Google Scholar]
- [43].Dahlqvist A. Anal. Biochem. 1964;7:18–25. doi: 10.1016/0003-2697(64)90115-0. [DOI] [PubMed] [Google Scholar]
- [44].Messer M, Dahlqvist A. Anal. Biochem. 1966;14:376–392. doi: 10.1016/0003-2697(66)90280-6. [DOI] [PubMed] [Google Scholar]
- [45].Markx GH, Rousselet J, Pethig R. J. Liq. Chromatogr. Rel. Technol. 1997;20:2857–2872. [Google Scholar]
- [46].Wang X-B, Vykoukal J, Becker FF, Gascoyne PRC. Biophys. J. 1998;74:2689–2701. doi: 10.1016/S0006-3495(98)77975-5. [DOI] [PMC free article] [PubMed] [Google Scholar]
- [47].Rao PN. Mol. Cell. Biochem. 1980;29:47–57. doi: 10.1007/BF00230954. [DOI] [PubMed] [Google Scholar]
- [48].Feilotter H, Lingner C, Rowley R, Young PG. Biochem. Cell Biol. 1992;70:954–971. doi: 10.1139/o92-140. [DOI] [PubMed] [Google Scholar]
- [49].Bernhard EJ, Maity A, Muschel RJ, McKenna WG. Radiat. Environ. Biophys. 1995;34:79–83. doi: 10.1007/BF01275210. [DOI] [PubMed] [Google Scholar]
- [50].Murnane JP. Cancer Metast. Rev. 1995;14:17–29. doi: 10.1007/BF00690208. Erratum: 14, 253-254. [DOI] [PubMed] [Google Scholar]
- [51].Rosenthal DI, Carbone DP. J. Infus. Chemother. 1995;5:46–54. [PubMed] [Google Scholar]
- [52].Chao CC. J. Formosan Med. Assoc. 1996;95:893–900. [PubMed] [Google Scholar]
- [53].Huang Y. Ph.D. Dissertation. University of Wales; Bangor: 1994. [Google Scholar]
- [54].Wang X, Wang X-B, Becker FF, Gascoyne PRC. J. Phys. D Appl. Phys. 1996;29:1649–1660. [Google Scholar]
- [55].Henriksen T, Melo TB, Saxebol G. In: Free Radicals in Biology. Pryor WA, editor. Vol. 2. Academic Press; New York: 1976. pp. 213–256. [Google Scholar]
- [56].Tappel AL. In: Free Radicals in Biology. Pryor WA, editor. Vol. 4. Academic Press; New York: 1980. pp. 1–47. [Google Scholar]
- [57].Chesis PL, Levin DE, Smith MT, Ernster L, Ames BN. Proc. Natl. Acad. Sci. USA. 1984;81:1696–1700. doi: 10.1073/pnas.81.6.1696. [DOI] [PMC free article] [PubMed] [Google Scholar]
- [58].Morrison H, Jernstrom B, Nordenskjold M, Thor H, Orrenius S. Biochem. Pharmacol. 1984;33:1763–1769. doi: 10.1016/0006-2952(84)90347-2. [DOI] [PubMed] [Google Scholar]
- [59].Gascoyne PRC. Int. J. Quant. Chem. Quant. Biol. Symp. 1986;12:245–255. [Google Scholar]
- [60].Spitz DR, Mackey MA, Li GC, Elwell JH, Mc-Cormick ML, Oberley LW. J. Cell. Physiol. 1989;139:592–598. doi: 10.1002/jcp.1041390320. [DOI] [PubMed] [Google Scholar]
- [61].Duncan DD, Lawrence DA. J. Biochem. Toxicol. 1990;5:229–235. doi: 10.1002/jbt.2570050405. [DOI] [PubMed] [Google Scholar]
- [62].Kleiman NJ, Wang PR, Spector A. Mutat. Res. 1990;240:35–45. doi: 10.1016/0165-1218(90)90006-n. Erratum: 241, 395. [DOI] [PubMed] [Google Scholar]
- [63].Shibanuma M, Kuroki T, Nose K. Oncogene. 1990;5:1025–1032. [PubMed] [Google Scholar]
- [64].Dominguez I, Panneerselvam N, Escalza P, Natarajan AT, Cortes F. Mutat. Res. 1993;301:135–141. doi: 10.1016/0165-7992(93)90036-u. [DOI] [PubMed] [Google Scholar]
- [65].Zdolsek J, Zhang H, Roberg K, Brank U. Free Radical Res. Commun. 1993;18:71–85. doi: 10.3109/10715769309147344. [DOI] [PubMed] [Google Scholar]
- [66].Clopton DA, Saltman P. Biochem Biophys. Res. Commun. 1995;210:189–196. doi: 10.1006/bbrc.1995.1645. [DOI] [PubMed] [Google Scholar]
- [67].Liu SM, Sundqvist T. Exp. Cell Res. 1995;217:1–7. doi: 10.1006/excr.1995.1056. [DOI] [PubMed] [Google Scholar]
- [68].Wharton W. Cancer Res. 1995;55:5069–5074. [PubMed] [Google Scholar]
- [69].Wiese AG, Pacifici RE, Davies KJ. Arch. Biochem. Biophys. 1995;318:231–240. doi: 10.1006/abbi.1995.1225. [DOI] [PubMed] [Google Scholar]
- [70].Bladier C, Wolvetang EJ, Hutchinson P, de Haan JB, Kola I. Cell Growth Different. 1997;8:589–598. [PubMed] [Google Scholar]
- [71].Pfeiffer EF. Horm. Metab. Res. Suppl. 1990;24:154–164. [PubMed] [Google Scholar]
- [72].Cornblath M, Schwartz R. J. Pediatr. Endocrinol. 1993;6:113–129. [PubMed] [Google Scholar]
- [73].Jaffari SA, Turner AP. Physiol. Measurements. 1995;16:1–15. doi: 10.1088/0967-3334/16/1/001. [DOI] [PubMed] [Google Scholar]
- [74].Lager W, Lucadou IV, Preidel W, Ruprecht L, Saeger S. Med. Biol. Eng. Comput. 1994;32:247–252. doi: 10.1007/BF02512518. [DOI] [PubMed] [Google Scholar]


