Abstract
Lead (Pb) produces aggresome-like inclusion bodies (IBs) in target cells as a toxic response. Our prior work shows metallothionein (MT) is required for this process. We used MT-I/II double knockout (MT-null) and parental wild-type (WT) cell lines to further explore the formation process of Pb-induced IBs. Unlike WT cells, MT-null cells did not form IBs after Pb exposure. Western blot of cytosol showed soluble MT protein in WT cells was lost during Pb exposure as IBs formed. Transfection of MT-I into MT-null cells allowed IBs formation after Pb exposure. Considering Pb-induced IBs may be like disease-related aggresomes, which often contain α-synuclein (Scna), we investigated Scna expression in cells capable (WT) and incapable (MT-null) of producing IBs after Pb exposure. Scna protein showed poor basal expression in MT-null cells. Pb exposure increased Scna expression only in WT cells. MT transfection increased Scna transcript to WT levels. In WT or MT-transfected MT-null cells, Pb-induced Scna expression rapidly increased and then decreased over 48 h as Pb-induced IBs were formed. A direct interaction between Scna and MT was confirmed ex vivo by antibody pulldown assay where the proteins coprecipitated with an antibody to MT. Pb exposure caused increased colocalization of MT and Scna proteins with time only in WT cells. In WT mice after chronic Pb exposure Scna was localized in renal cells containing forming IBs, whereas MT-null mice did not form IBs. Thus, Scna could be component of Pb-induced IBs and, with MT, may play a role in IBs formation.
Keywords: lead, inclusion bodies, α-synuclein, metallothionein, MT-null
Lead (Pb) is a ubiquitous, naturally occurring environmental toxicant metal. Pb-induced toxic effects can manifest in several organs but the brain and kidney are clearly primary targets (Coon et al., 2006; IARC, 2006; Toscano and Guilarte, 2005; White et al., 2007; Wu et al., 2008). Compelling evidence is emerging that Pb exposure, particularly early life exposure, may cause neurodegeneration later in life (White et al., 2007; Wu et al., 2008). For example, life time whole-body occupational Pb exposure has been recently shown to be a risk factor for Parkinson's disease (Coon et al., 2006), a neurodegenerative disorder characterized by regional aggresomal protein inclusions. Similarly, an Alzheimer's disease-like pathology has recently been induced in adult monkeys after early life Pb exposure (Wu et al., 2008). An important evolving concept in Pb neurotoxicity is that environmental factors can play a role in increasing susceptibility (White et al., 2007).
A remarkable characteristic of Pb intoxication is the production of protein-Pb complexes which appear in target cells of poisoned humans or animals as inclusion bodies (IBs). After toxic levels of Pb exposure, IBs will first form in the cytoplasm, and then migrate to the nucleus (Nolan and Shaikh, 1992). These IBs are common in the kidney but also can be found in cells of the nervous system and other target sites of Pb (Goyer and Rhyne, 1973; Klann and Shelton, 1989). The origin and nature of the protein component of IBs remains poorly defined, but IBs are clearly protective against acute and chronic Pb toxicity (Qu et al., 2002; Waalkes et al., 2004). IBs bind large amounts of Pb and likely render it toxicologically inert, thus blocking interactions with more critical cellular targets (Fowler, 1998).
Metallothionein (MT), is a low-molecular weight, cysteine-rich protein found in most mammalian tissues. Normally, soluble and cytosolic. MT is protective against the toxicity of many metals, including Pb (Goering, 1993). MT detoxicates metals via sequestration thereby limiting the “free” and toxicologically active form of the metal. Pb binds to MT under ex vivo conditions (Waalkes et al., 1984) and tissue MT levels can be increased after Pb exposure (Ikebuchi et al., 1986). MT-I and MT-II, the predominant isoforms, are induced upon exposure to various metals (Klaassen et al., 1999). MT-I/-II double knockout (MT-null) mice and phenotypically concordant cell lines, that do not express either of the major MT genes, have been extensively used for studying the physiological and toxicological roles of MT (Klaassen et al., 1999; Kondo et al., 1999). Both MT-null mice and cells are much more sensitive to Pb toxicity than their WT equivalents (Qu et al., 2002; Waalkes et al., 2004). In fact, MT-null mice are hypersensitive to Pb-induced nephrocarcinogenesis (Waalkes et al., 2004). Remarkably, the MT-null phenotype shows a complete inability to form Pb-induced IBs (Qu et al., 2002; Waalkes et al., 2004). It is thought that IB formation plays a key role in mitigation of Pb toxicity, so MT deficiency likely enhances Pb sensitivity via perturbation of IB formation. However, how MT facilitates Pb-induced IB formation is not well understood. Human populations show very wide variations in MT expression (Garvey, 1984; Liu et al., 2007) with some subjects expressing minimal levels. This may well create a hypersensitivity to Pb toxicity in human subjects that poorly express MT, as appears to be the case for arsenic toxicity and low MT (Liu et al., 2007), although this has not been directly tested.
Pathologically, Pb-induced IBs represent an aggresomal response. Various human diseases are associated with aggresome formation (Taylor et al., 2002). For instance, Parkinson's disease is an age-related neurodegenerative disorder that is associated with the formation of aggresomes in neurons of the affected brain areas (Olanow and Perl, 2004). α-Synuclein (Scna) is a protein with a natural tendency to aggregate into oligomers and is thought to be a key component of such aggresomes in Parkinson's disease (Cookson, 2005; Olanow and Perl, 2004). The protein components of the aggresomes occurring during Pb intoxication are, however, undefined,
Thus, this study was designed to further investigate the nature and formation process of IBs as a toxic response to Pb exposure. This included further work on the role of MT in this process. In addition, based on the hypothesis that Pb-induced IBs may be similar to aggresomes formed in other pathological conditions, the potential role of Scna in Pb-induced IB formation was also studied.
MATERIAL AND METHODS
Chemicals and reagents.
Lead nitrate and glutamic acid were obtained from Sigma Chemical Company (St Louis, MO). Monoclonal mouse anti-MT antibody was obtained from Dako Corporation (Carpinteria, CA). Anti-Scna antibody was purchased from BD Biosciences Pharmingen (San Jose, CA). Purified MT was purchased from Bestenbalt (Tallinn, Estonia). Purified Scna was purchased from rPeptide (Bogart, GA).
Cell culture and treatments.
A cell line created from the embryonic cells of transgenic mice with targeted disruption of MT-I/II genes (MT-null cells), along with the corresponding WT (MT+/+) control cells from normal mixed background 129 Ola and C57B1/6 mice, were graciously supplied by Dr John Lazo, University of Pittsburgh. Cells were cultured in Dulbecco's modified Eagle's medium containing 10% fetal bovine serum as described previously (Lazo et al., 1995). The precipitation of Pb in the medium was controlled by complexing Pb nitrate with glutamic acid in equimolar amounts, as detailed in a previous report (McLachlin et al., 1980). We previous reported that LC50 value for Pb in WT cells was 645μM as compared with 230μM in MT-null cells and 200μM Pb-induced IBs in WT cells (Qu et al., 2002). Thus, cells were exposed to Pb (200μM) for the time specified throughout this study. These high levels of Pb were required because of the poor solubility of Pb in general and because the formation of IBs is a toxic response that requires such high levels in a complex tissue culture medium.
Real-time PCR of MT and Scna.
Total RNA was isolated from WT, MT-null, and MT-null cells transfected with MT-I using TRIzol (Invitrogen, Carlsbad, CA) and then subjected to DNase digestion by using RNase-Free DNase Set (Qiagen, Valencia, CA) followed by the cleanup using RNeasy Mini kit (Qiagen). The resultant DNA-free RNA was quantitated by ultraviolet spectroscopy at 260 nm and stored in RNase-free H2O at −70°C. Quantitative real-time reverse transcription polymerase chain reaction (real-time RT-PCR) was conducted as described previously (Liu et al., 2007). Briefly, total RNA from each sample was reverse transcribed with MuLV reverse transcriptase (Applied Biosystems, Foster City, CA) and Oligo d(T) primers. The SYBR Green PCR Kit (Applied Biosystems) was used for quantitative real-time RT-PCR analysis. The mouse primers were designed using Primer Express software (Applied Biosystems) and listed here: MT-I, forward 5′-GAT CTC GAG CTC AAG CTT ATG GAC CCC AAC TGC TCC TG-3′; reverse, 5′-ACT GCA GAA TTC TCA GGC ACA GCA-3′; Scna, forward 5′- AGT GGA GGG AGC TGG GAA TA TAG-3′; reverse 5′-TCC TCA CCC TTG CCC ATC T-3′; β-actin, forward 5′-GGC CAA CCG TGA AAA GAT GA-3′; reverse 5′-CAG CCT GGA TGG CTA CGT ACA-3′. Relative differences in gene expression between groups were expressed using cycle time (Ct) values; these values were first normalized with that of β-actin in the same sample and expressed as arbitrary units. Real-time fluorescence detection was carried out using a MyiQ singleColor Real-Time PCR Detection System (Bio-Rad, Hercules, CA).
Western blot analysis.
Cells were lysed by adding 1× sodium dodecyl sulfate sample buffer with 1% Protease Inhibitor Cocktail and 1% Phosphatase Inhibitor Cocktail 1 (Sigma/Aldrich). The cells were immediately scraped off the plate and the extract was transferred to a microcentrifuge tube and kept on ice. The sample was sonicated for 10–15 seconds to shear DNA and reduce sample viscosity. The sample was then centrifuged at 18,000 × g for 10 min, and the resulting supernatant termed cytosol. An aliquot of cytosol (15 μg proteins) was used for determining MT and Scna protein content by Western blot. MT and Scna protein were identified according to molecular weight markers. Relative densities of the bands were digitally quantified by using Bio-Rad Quantity One-4.4.0 analysis software. The level of centrifugation used in preparing samples for Western blot would have eliminated nuclei and any large IBs. Hence, Westerns would reflect cytosolic (soluble/free) MT not in these aggresomes.
Immunostaining for colocalization.
Cells cultured on the chambered coverglass (Nalge Nunc International, Rochester, NY) were fixed in a solution of methanol and acetone (1:1) for 2 min followed by a wash with phosphate-buffered saline (PBS) (pH 7.4) and preincubation with blocking buffer containing 5% milk, 0.1% gelatin, and 7.5% sucrose in PBS and with avidin-biotin blocking reagents (Vector Laboratories, Inc., Burlingame, CA). The cells were incubated with primary antibodies (1:500) against MT (Santa Cruz Biotechnology, Inc., Santa Cruz, CA) and Scna (BD Biosciences Pharmingen, San Jose, CA) for 1 h followed by three washes with PBS. The cells were then stained with Alexa Fluro 568- and 488-conjugated secondary antibodies (1:1000; Molecular Probes, Eugene, OR) for 30 min followed by three washes with PBS. The nuclei of the cells were stained with 4′,6-diamidino-2-phenylindole (DAPI; Molecular Probes) for 5 min. Glass slides were examined, photographed, and analyzed by using DP2-BSW microscope digital camera software (Olympus America In., Center Valley, PA).
pcDNA3-MT transfection.
Complexes between pcDNA3-MT and the FuGen 6 Transfection Reagent (Roche, Mannheim, Germany) were prepared according to the specifications of the manufacturer using MT-I. Generally, after pcDNA3-MT-reagent complexes had formed, the mixture was exposed to cultures and incubated for 16 h before replacing the Dulbecco's modified Eagle's medium. FuGen 6 was used as per guidelines for six-well plates with a volume of 3 μl of FuGen 6 per well.
Observation of IBs in vitro.
The Pb-treated WT, MT-null, and MT-null transfected with MT-I cells were cultured in flask for 24 h, and then harvested using trypsin. Cells were centrifuged at 2000 × g for 5 min followed by a wash with PBS (pH 7.4). From the cell pellet, a smear was prepared on a microscopic glass slide and fixed by addition of acetic acid/methanol (1:3) for at least 20 min. Slices were rinsed twice with PBS and then stained with hematoxlin and eosin. Slides were assessed without knowledge of treatment group by light microscopy for IBs and digital images were taken.
Coprecipitation of Scna and MT protein ex vivo.
Monoclonal MT antibody (20 μg) was bound to 100 mg of protein G-agarose essentially as per instructions in Seize X Protein G Immunoprecipitation Kit (Pierce, Rockford, IL). The coupled antibody was kept in PBS at 4°C in the presence of 3mM NaN3. For detecting if Scna and MT coprecipitated, mixtures of 50 μg purified Scna and 0–200 μg purified MT were added to protein G-agarose beads with bound monoclonal MT antibody and shaken at 4°C overnight. The beads were then washed four times with the same buffer containing 3mM NaN3, and Scna was eluted with 190 μl of ImmunoPure Elution Buffer. The Scna was measured by Western blot analysis with a Scna antibody.
Animals and samples.
Archival kidney samples from MT-I/II knockout (MT-null) mice and corresponding WT mice preserved as paraffin blocks from a prior carcinogenesis study (Waalkes et al., 2004) were used. They had been exposed to drinking water containing 4000 ppm Pb and observed for tumor formation for up to 104 weeks (Waalkes et al., 2004). Pb-induced IBs were common in WT mice but absent in MT-null mice (Waalkes et al., 2004). The presence of Scna or MT in IBs of Pb-treated WT mice was studied immunohistochemically using antibodies against Scna or MT. Paraffin block sections (4 μm) were incubated with biotinylated primary antibody (dilution 1:500), and then with streptavidin-peroxidase, followed by reaction with diaminobenzidine/hydrogen peroxide as chromagen substrate.
Statistical analysis.
Data are expressed as mean ± SEM. A Student's t-test or ANOVA with subsequent Dunnett's test were used as appropriate. Values are derived from three or more replicates. Differences were considered significant at a level of p < 0.05.
RESULTS
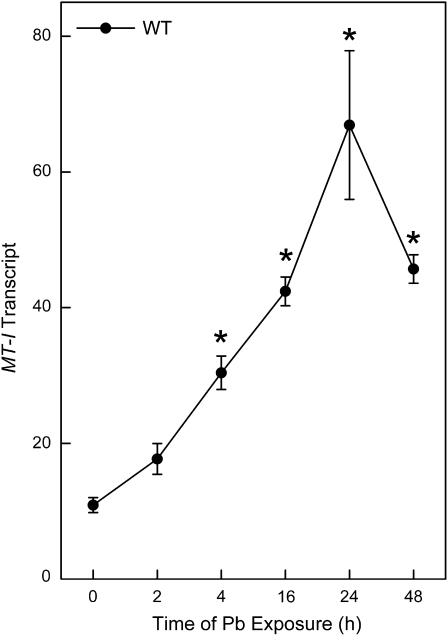
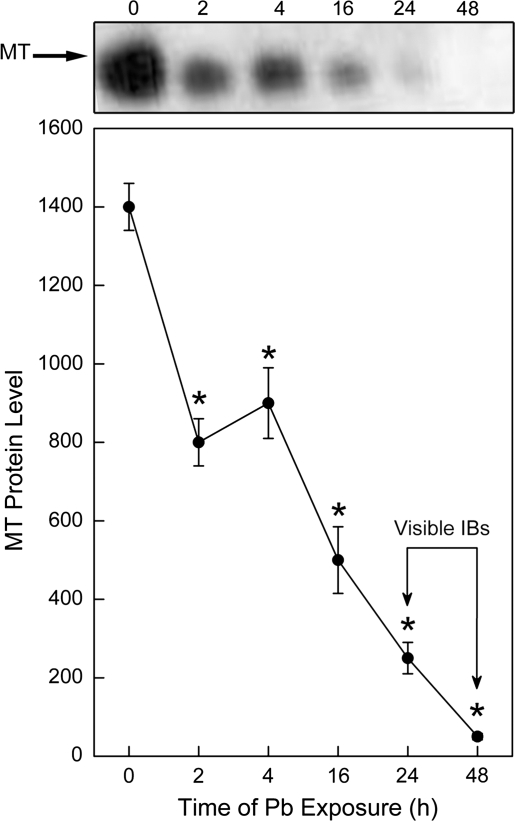
Pb rapidly increased MT mRNA in a time-dependent manner in WT cells with maximal increases at 24 h (Fig. 1). In contrast, in MT-null cells, the basal levels of MT transcript were very low, and were not increased by Pb treatment (not shown). MT protein levels were also measured in WT and MT-null cells after Pb exposure by Western blot. In WT cells, although the transcript increased, soluble MT protein levels actually decreased soon after the onset of Pb exposure (Fig. 2). These Western blots are based on proteins from postcentrifugation cell lysate supernatant (18,000 × g; 10 min) and the centrifugation step would likely eliminate large cell components, like nuclei, etc. They would likely measure soluble, cytosolic MT as opposed to MT in the form of large cellular aggregates like IBs. Thus, this reduction in cellular MT protein, in the face of increased transcript, could possibly indicate MT going into rapidly forming IBs. Indeed, IBs became common as visualized by light microscope in WT cells after about 24–48 h of Pb exposure (Fig. 2, arrows; also see below). These are typically dense, intranuclear bodies. There was an 82% decrease in cytosolic MT protein in WT cells after 24 h of Pb exposure and the loss of MT exceeded 96% of control by 48 h of treatment. As expected, MT protein was essentially undetectable in MT-null cells at all time points regardless of Pb exposure (not shown). In addition, as previously observed both in vivo and in vitro (Qu et al., 2002; Waalkes, et al., 2004), the MT-null phenotype was unable to form IBs after Pb exposure (see below).
FIG. 1.
Analysis of MT transcript in cells exposed to Pb. WT cells were treated with 200μM Pb for 0 to 48 h. MT mRNA levels were measured using real-time RT-PCR in triplicate. Results were normalized to β-actin and are expressed as a relative transcript level. MT mRNA in MT-null cells was very low to undetectable regardless of treatment (not shown). Data are presented as the mean ± SEM, n = 3. An asterisk (*) indicates a significant (p < 0.05) difference from untreated cells.
FIG. 2.
Expression of MT protein in cells exposed to Pb. WT cells were treated with 200μM Pb for 0–48 h. Cellular MT protein levels were measured by Western blot analysis. Blots were analyzed by scanning densitometry and are expressed as a protein level. Data are presented as the mean ± SEM, n = 3. An asterisk (*) indicates a significant (p < 0.05) difference from untreated cells. The arrows indicate the approximate time Pb-induced IBs become visible by light microscope. MT protein in MT-null cells was very low to undetectable regardless of treatment (not shown).
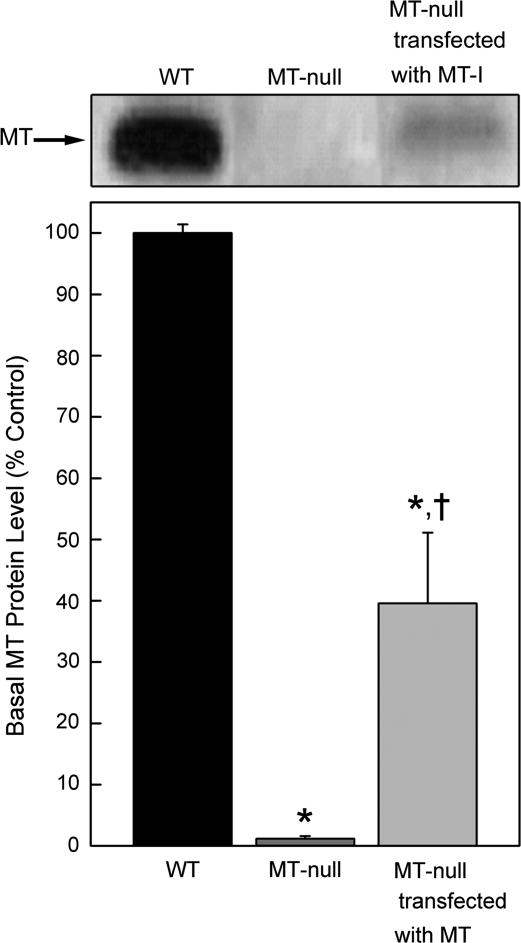
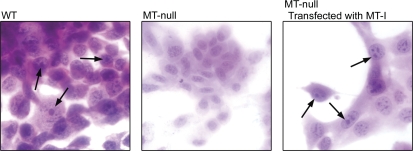
To examine if the lack of MT expression is the key molecular defect in the inability of MT-null cells to form lead-induced IBs, MT-null cells were transfected with the MT gene. Basal MT protein levels were easily detected in WT cells and MT-null cells transfected with MT, but again essentially undetectable in MT-null cells (Fig. 3). These results indicate MT gene transfection into MT-null cells was successful. WT, MT-null and MT-null cells transfected with MT were exposed to Pb and the formation of Pb-induced IBs was examined by light microscopy. As expected, MT-null cells did not form Pb-induced IBs, whereas IBs were common in both WT and MT-null cells transfected with MT (Fig. 4, arrows). Thus, transfection of MT back into MT-null cells allowed IBs formation after Pb exposure.
FIG. 3.
Transfection of MT into MT-null cells. MT-null cells were transfected with MT and MT protein levels were assessed by Western blot and compared with WT cell or MT-null cells. Blots were analyzed by scanning densitometry and are expressed as a protein level. Results are presented as the mean ± SEM, n = 3. An asterisk (*) indicates a significant (p < 0.05) difference from WT cells; A cross (†) indicates a significant (p < 0.05) difference from MT-null cells.
FIG. 4.
In vitro Pb-induced IB formation. WT, MT-null, and MT-null cells transfected with MT were exposed to 200μM Pb for 48 h. After fixation and staining they were visualized by light microscopy. The arrows indicate typical IBs in WT and MT-null cells transfected with MT. IBs were not observed in MT-null cells.
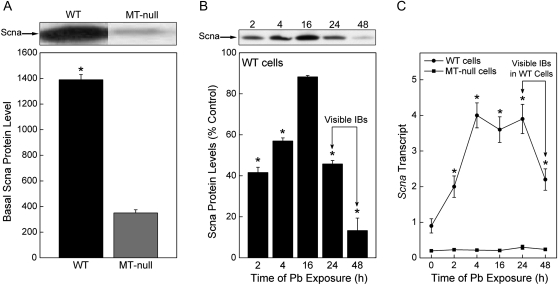
Pb-induced IBs are a form of cellular aggresome and Scna protein is commonly found in various pathological aggresomes. To examine whether Scna protein was expressed in the WT and MT-null cells, cellular proteins were analyzed by Western blot. WT cells had four times higher basal expression level of Scna protein than that in MT-null cells (Fig. 5A). In order to elucidate whether Pb treatment alters Scna gene expression, Scna transcript and protein were evaluated. After Pb treatment for up to 48 h, Scna protein in WT cells initially was reduced by Pb (at 2 and 4 h), then rebounded to control levels (16 h), and then finally dropped to ∼10% of control by 48 h (Fig. 5B), a point at which IBs were visible. Pb rapidly increased Scna transcript in a time-dependent manner in WT cells with maximal, sustained increases at between 4 and 24 h (Fig. 5C). The levels of Scna transcript in WT cells then started to decrease at 48 h, a time point when Pb-induced IBs were clearly formed. In contrast, MT-null cells showed poor basal Scna expression and were completely unable to increase Scna expression after Pb exposure. In addition, Pb did not alter Scna protein in MT-null cells (not shown).
FIG. 5.
Basal Scna protein expression and Scna transcript after Pb treatment. (A) Basal Scna protein, commonly found in aggresomes, was measured by Western blot analysis. Blots were analyzed by scanning densitometry and are expressed as a relative protein level. An asterisk (*) indicates a significant (p < 0.05) difference from WT cells. (B) WT cells were treated with 200μM Pb for 0–48 h. Scna protein expression was measured by Western blot analysis. Blots were analyzed by scanning densitometry and are expressed as a % of control. An asterisk (*) indicates a significant (p < 0.05) difference from the control. (C) Scna mRNA levels were measured using real-time RT-PCR in triplicate. Results were normalized to β-actin and are expressed as a relative transcript level. Data are presented as the mean ± SEM, n = 3. An asterisk (*) indicates a significant (p < 0.05) difference from WT cells. The arrows indicate the approximate time Pb-induced IBs become visible by light microscope.
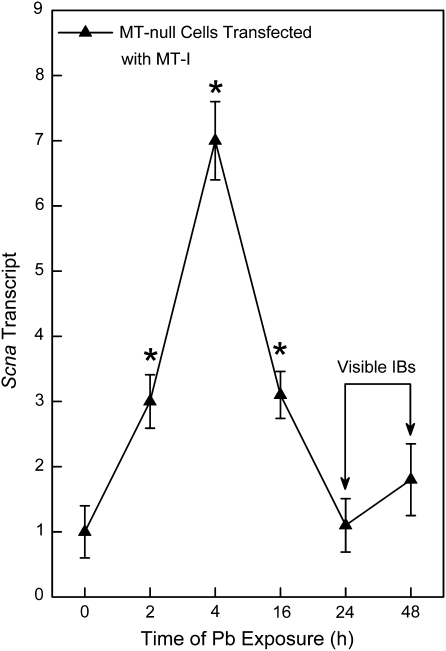
MT-null cells transfected with MT were also exposed to Pb for up to 48 h to assess Scna expression. Pb rapidly increased Scna expression at the transcript level in MT-null cells transfected with MT (Fig. 6). The maximal increases occurred at 4 h and then started to decrease between 16 and 48 h, about the time Pb-induced IBs became visible (arrows).
FIG. 6.
Scna transcript in MT-null cells transfected with MT after Pb treatment. MT-null cells transfected with MT were exposed to 200μM Pb for 0–48 h. Scna mRNA levels were measured in triplicate using real-time RT-PCR. Results were normalized to β-actin and are expressed as a relative transcript level. Data are presented as the mean ± SEM, n = 3. An asterisk (*) indicates a significant (p < 0.05) difference from untreated cells. The arrows indicate the approximate time Pb-induced IBs become visible by light microscope.
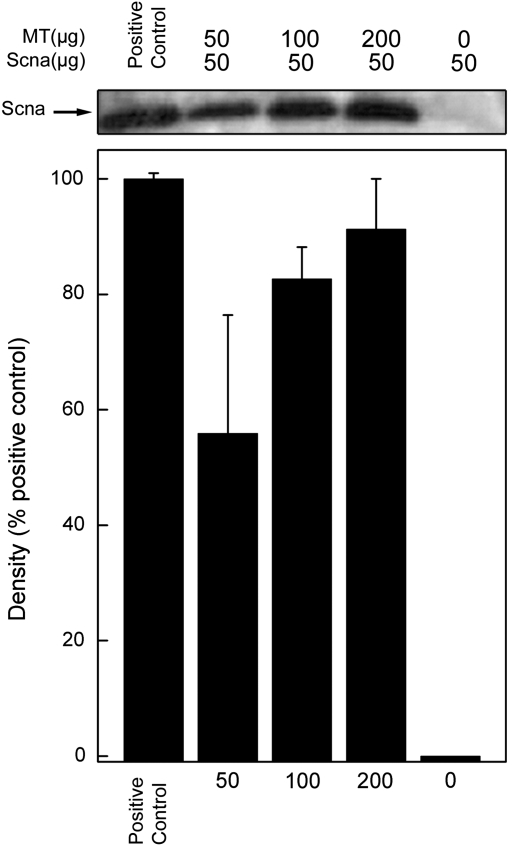
A “pull-down” assay was applied to test for physical interaction between purified MT and Scna proteins. Purified Scna (50 μg) was incubated with 0–200 μg purified MT and exposed to monoclonal MT antibody bound to protein G-agarose beads. A Western blot of the immunoprecipitated material showed that Scna protein formed a complex with MT protein in such a way that the complex was precipitated by the agarose bead bound MT antibody (Fig. 7). The Scna protein was not pulled down when MT was not included prior to immunoprecipitation. This experiment did not work when cell lysate was used instead of purified proteins, perhaps due to the disruption of cellular components or other unknown reasons.
FIG. 7.
Direct interaction between purified MT and Scna protein. Purified Scna protein (50 μg) was incubated with 0–200 μg purified MT protein and exposed to an anti-MT antibody bound to protein G-agarose beads. A Western blot of the immunoprecipitate was performed using Scna antibody. Blot shown represents a typical result of three independent experiments. Bar graph presented as the mean ± SEM, n = 3.
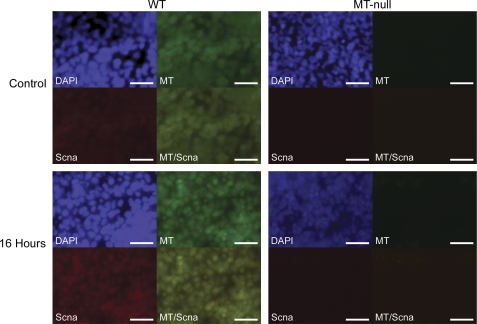
To demonstrate actual colocalization of MT and Scna in Pb-exposed cells, both WT and MT-null cells were immunostained with MT and Scna antibodies, the nuclei were counterstained with DAPI and the images were merged (Fig. 8). Pb increased colocalization of MT and Scna proteins in a time-dependent manner in WT cells over 16 h. In MT-null cells, the basal expression of MT and Scna proteins were very low, and no apparent colocalization occurred with Pb treatment.
FIG. 8.
Colocalization of MT and Scna proteins in the cells. WT (Left) and MT-null (Right) cells were exposed to 200μM Pb for 0 or 16 h. Cells were immunostained with MT (green) or Scna (red) antibodies, nuclei were counterstained with DAPI (blue) and the images for MT and Scna were merged. Picture shown represents a typical result of three independent experiments. The merged image for MT/Scna clearly showed accumulation of colocalized protein.
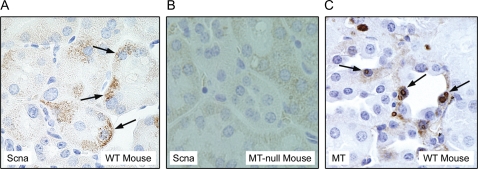
MT-null mice are unable to form IBs in response to Pb exposure as previously observed while they are common in strain-matched WT mice (Qu et al., 2002; Waalkes et al., 2004). To determine if Scna expression is involved with these inclusions in Pb-treated WT mice, archival kidney samples of renal cortex from WT mice chronically treated with Pb from our original tumor end-point study (Waalkes et al., 2004) were subjected to immunohistochemical analysis with an antibody to Scna and MT protein. Scna was clearly expressed in WT mouse kidney cells containing early forming Pb-induced IBs (Fig. 9A), but not in kidney from MT-null mice (Fig. 9B). MT was localized in similar renal cells in what appeared to be the surface of IBs from WT mice (Fig. 9C), consistent with our prior work (Waalkes et al, 2004). MT-null mice did not show IBs in kidney and hence there was no IB-associated staining for MT (not shown).
FIG. 9.
Immunohistochemical analysis of Scna and MT staining intensity and localization in Pb-treated WT mouse kidney. (A) Representative section from the kidney of a WT mouse chronically (∼2 years) exposed to Pb in the drinking water (4000 ppm) showing intense and clustered staining (brown) for Scna that appeared to occur in cells with early, forming Pb-induced IBs. (B) MT-null mice do not show staining for Scna. (C) A representative section of WT mouse kidney chronically (∼2 years) exposed to Pb in the drinking water (4000 ppm) showing MT on the surface of several IBs. Blocked archival samples were used from a chronic carcinogenesis study of Pb in WT and MT-null mice (Waalkes et al., 2004).
DISCUSSION
Human Pb exposure continues to pose important public health issues (IPCS, 2006). Pb is a potent neurotoxicant and evidence indicates early life exposures may cause neurodegenerative disease in later life (White et al., 2007). Pb has been linked to renal dysfunction (Loghman-Adham, 1997) and is also a probable human carcinogen associated with renal and brain tumors in rodents (IARC, 2006). Although removal of Pb from gasoline has helped reduce environmental levels, health concerns clearly remain and identification of sensitive subpopulations should be seen as a major public health goal. The present results further confirm that the MT-null phenotype confers the inability to form IBs in response to Pb exposure (Qu et al., 2002; Waalkes et al., 2004). MT is normally a soluble cytosolic protein and soluble MT protein in WT cells was lost rapidly after the onset of Pb exposure and became very low when IBs became visible, suggesting the soluble MT is going into forming IBs. The finding of MT on the surface of IBs in WT mouse kidney treated chronically with Pb, consistent with our prior work (Waalkes et al., 2004), supports this contention. In addition, the fact that transfection of MT back into MT-null cells in the present work allowed IB formation after Pb exposure points to a role for MT protein in formation of these Pb-induced IBs. Indeed, the inability to form IBs in MT-null mice in response to Pb renders them sensitive to various aspects of Pb toxicity (Qu et al., 2002), including carcinogenesis (Waalkes et al., 2004). Likewise, at the cellular level the MT-null phenotype is hypersensitive to Pb (Qu et al., 2002). Thus, expression of MT appears mechanistically linked to formation of Pb-induced IBs and IBs appear critical in the cellular defense against Pb toxicity. An important corollary observation is that MT expression shows very wide variability in human populations, with some subjects showing very low expression, even in relatively homogenous populations (Garvey, 1984; Liu et al., 2007). In fact, a recent study showed that the sensitivity to the chronic toxicity of arsenic was highly correlated with poor MT expression in humans (Liu et al., 2007). Since, like arsenic, the adverse effects of Pb are mitigated by MT (Qu et al., 2002; Waalkes et al., 2004), this creates the distinct possibility that humans that poorly express MT may be predisposed to Pb toxicity. This hypothesis should be directly tested in human subjects exposed to Pb and could serve as a means to specifically predict individuals most sensitive to Pb intoxication.
Scna has a natural tendency to aggregate into oligomers that can then further aggregate into fibrils such as those found in Lewy bodies (Cookson, 2005) or other aggresomes. The deposition and aggregation of Scna and other cellular proteins in Lewy bodies in midbrain dopamine neurons is a pathological hallmark of Parkinson's disease (Cookson, 2005; Zhou and Freed, 2004). Lewy bodies are formed in a fashion that is similar to other aggresomes, being proteinaceous inclusions that segregate and possibly facilitate the degradation of excess amounts of denatured and possibly cytotoxic proteins (Olanow and Perl, 2004). The present results indicate that the MT-null phenotype is associated with an inability to produce Pb-induced aggresomes (i.e., IBs), and that the inability to produce MT through some as yet unknown mechanism diminishes the ability to produce Scna protein. Furthermore, appropriate Scna expression appears to be an aspect to Pb-induced IB formation, because transfection of MT into MT-null cells allowed Scna expression and subsequent IB formation. There was evidence of colocalization of MT and Scna in Pb-treated WT-type cells that would be producing IBs. Additionally, WT mouse kidney also showed the presence Scna protein in the cells forming Pb-induced IBs after chronic Pb exposure. Thus, a novel, pathophysiologically relevant potential interaction between MT and Scna, a molecule implicated in the pathogenesis of the aggresomes typical in Parkinson's disease (Cookson, 2005; Zhou and Freed, 2004) is herein identified. Furthermore, reports have linked Pb exposure and Parkinson's disease (Kuhn et al., 1998; Semchuck et al., 1993; Tanner and Langston, 1990) including recent evidence of an association between occupational Pb exposure and Parkinson's disease (Coon et al., 2006). However, despite the potential role of Scna in Pb-induced IB formation with MT in the non-neuronal cells used in the present study, it is unknown if poor MT production would alter Pb-induced IBs production in other tissues, such as brain, and this requires direct experimental confirmation.
Pb-induced IBs have long been known to contain concentrated Pb and precipitated protein of some undefined nature (see IARC, 2006 for review). The fact that the protein components of these Pb-induced IBs remain undefined many decades after their initial discovery last century makes evident how difficult they have been to work with, largely because they seem intractable to renaturation once formed, perhaps due to the very high Pb content. In any event, this has forced an experimental design that often relies on the negative (i.e., loss) rather than positive (i.e., appearance) as evident from this present study. Hence, our evidence that MT and Scna are part of Pb-induced IBs is largely indirect, as these proteins disappear as IBs are formed, or inferred, as MT-null cells do not produce IBs and poorly express Scna. Similarly, the fact expression of MT after transfection of the MT-I gene into MT-null cells is sufficient alone to allow Pb-induced IB formation is not necessarily direct evidence MT is part of the forming IBs, although it would seem a reasonable possibility. The immunohistochemical detection of MT on the outer surface of Pb-induced renal IB's as seen in prior work (Waalkes et al., 2004), and confirmed in this study would seem to indicate some intimate involvement, although one could perhaps argue another function such as Pb transport. However, the precise nature of these remarkable IBs and their role in Pb toxicity will require further research.
In summary, the present work suggests that MT and Scna may be molecular components of Pb-induced IBs, and that these bodies are likely part of an adaptive response that limits Pb toxicity. Furthermore, evidence is provided for interactions between Scna and MT that appear to be required for this aggresomal response. Indeed, in WT mouse kidney after chronic Pb exposure, Scna and MT were immunohistochemically localized in cells with forming IBs. Taken together, this study indicates Scna may be a component of IBs formed during Pb exposure, at least in the kidney. Clearly, because MT expression varies widely in humans (Garvey, 1984; Liu et al., 2007) the present results indicate that persons showing low MT expression could be at higher risk to toxicities typically associated with Pb exposure. The role of MT, Scna and Pb in aggressome formation in human pathologies or diseases possibly associated with Pb exposure clearly deserves study.
FUNDING
Federal funds from the National Cancer Institute, National Institutes of Health, under contract (NO1-CO-12400).
Acknowledgments
The authors thank Ms Julie F. Foley for making slices and hematoxlin and eosin staining for observation of IBs and Drs Larry K. Keefer, Jie Liu, and Erik J. Tokar for critical evaluation of this manuscript. This research was supported in part by the Intramural Research Program of the NIH, National Cancer Institute, Center for Cancer Research. The authors have no competing financial interest with regards to this work.
The content of this publication does not necessarily reflect the views or policies of the Department of Health and Human Services, nor does mention of trade names, commercial products, or organizations imply endorsement by the U.S. Government.
References
- Coon S, Stark A, Peterson E, Gloi A, Kortsha G, Pounds J, Chettle D, Gorell J. Whole-body lifetime occupational lead exposure and risk of Parkinson's disease. Environ. Health Perspect. 2006;114:1872–1876. doi: 10.1289/ehp.9102. [DOI] [PMC free article] [PubMed] [Google Scholar]
- Cookson MR. The biochemistry of Parkinson's disease. Annu. Rev. Biochem. 2005;74:29–52. doi: 10.1146/annurev.biochem.74.082803.133400. [DOI] [PubMed] [Google Scholar]
- Fowler BA. Roles of lead-binding proteins in mediating lead bioavailability. Environ. Health Perspect. 1998;106:1585–1587. doi: 10.1289/ehp.98106s61585. [DOI] [PMC free article] [PubMed] [Google Scholar]
- Garvey JS. Metallothionein: Structure/antigenicity and detection/quantitation in normal physiological fluids. Environ. Health Perspect. 1984;54:117–127. doi: 10.1289/ehp.8454117. [DOI] [PMC free article] [PubMed] [Google Scholar]
- Goering PL. Lead-protein interactions as a basis for lead toxicity. Neurotoxicology. 1993;14:45–60. [PubMed] [Google Scholar]
- Goyer RA, Rhyne BC. Pathological effects of lead. Int. Rev. Exp. Pathol. 1973;12:1–77. [PubMed] [Google Scholar]
- Ikebuchi H, Teshima R, Suzuki K, Terao T, Yamane Y. Stimultaneous induction of Pb-metallothionein-like protein and Zn-thionein in the liver of rats given lead acetate. Biochem. J. 1986;233:541–546. doi: 10.1042/bj2330541. [DOI] [PMC free article] [PubMed] [Google Scholar]
- IARC(International Agency for Research on Cancer) Inorganic and organic lead compounds. In: Williams R, editor. IARC Monographs on the Evaluation of Carcinogenic Risks to Humans. Vol. 87. Lyon, France: WHO Press; 2006. pp. 1–471. [PMC free article] [PubMed] [Google Scholar]
- IPCS(International Programme on Chemical Safety) Inorganic lead. In: Jenkins PG, editor. Environmental Health Criteria 165. Geneva, Switzerland: World Health Organization; 1995. pp. 1–300. [Google Scholar]
- Klaassen CD, Liu J, Choudhuri S. Metallothionein: An intracellular protein to protect against cadmium toxicity. Annu. Rev. Pharmacol. Toxicol. 1999;39:267–294. doi: 10.1146/annurev.pharmtox.39.1.267. [DOI] [PubMed] [Google Scholar]
- Klann E, Shelton KR. The effect of lead on the metabolism of a nuclear matrix protein which becomes prominent in lead-induced intranuclear inclusion bodies. J. Biol. Chem. 1989;264:16969–16972. [PubMed] [Google Scholar]
- Kondo Y, Yanagiya T, Himeno S, Yamabe Y, Schwartz D, Akimoto M, Lazo JS, Imura N. Simian virus 40-transformed metallothionein null cells showed increased sensitivity to cadmium but not to zinc, copper, mercury or nickel. Life Sci. 1999;64:PL145–PL150. doi: 10.1016/s0024-3205(99)00025-9. [DOI] [PubMed] [Google Scholar]
- Kuhn W, Winkel R, Woitalla D, Meves S, Przuntek H, Müller T. High prevalence of parkinsonism after occupational exposure to lead-sulfate batteries. Neurology. 1998;50:1885–1886. doi: 10.1212/wnl.50.6.1885. [DOI] [PubMed] [Google Scholar]
- Lazo JS, Kondo Y, Dellapiazza D, Michalska AE, Choo KH, Pitt BR. Enhanced sensitivity to oxidative stress in cultured embryonic cells from transgenic mice deficient in metallothionein I and II genes. J. Biol. Chem. 1995;270:5506–5510. doi: 10.1074/jbc.270.10.5506. [DOI] [PubMed] [Google Scholar]
- Liu J, Cheng ML, Yang Q, Shan KR, Shen J, Zhou Y, Zhang X, Dill AL, Waalkes MP. Blood metallothionein transcript as a biomarker for metal sensitivity: Low blood metallothionein transcripts in arsenicosis patients from Guizhou, China. Environ. Health Perspect. 2007;115:1101–1106. doi: 10.1289/ehp.10035. [DOI] [PMC free article] [PubMed] [Google Scholar]
- Loghman-Adham M. Renal effects of environmental and occupational lead exposure. Environ. Health Perspect. 1997;105:928–939. doi: 10.1289/ehp.97105928. [DOI] [PMC free article] [PubMed] [Google Scholar]
- McLachlin JR, Goyer RA, Cherian MG. Formation of lead-induced inclusion bodies in primary rat kidney epithelial cell cultures: Effect of actinomycin D and cycloheximide. Toxicol. Appl. Pharmacol. 1980;56:418–431. doi: 10.1016/0041-008x(80)90076-9. [DOI] [PubMed] [Google Scholar]
- Nolan CV, Shaikh ZA. Lead nephrotoxicity and associated disorders: Biochemical mechanisms. Toxicology. 1992;73:127–146. doi: 10.1016/0300-483x(92)90097-x. [DOI] [PubMed] [Google Scholar]
- Olanow CW, Perl DP. Lewy-body formation is an aggresome-related process: A hypothesis. Lancet Neurol. 2004;3:496–503. doi: 10.1016/S1474-4422(04)00827-0. [DOI] [PubMed] [Google Scholar]
- Qu W, Diwan BA, Liu J, Goyer RA, Dawson T, Horton JL, Cherian MG, Waalkes MP. The metallothionein-null phenotype is associated with heightened sensitivity to lead toxicity and an inability to form inclusion bodies. Am. J. Pathol. 2002;160:1047–1056. doi: 10.1016/S0002-9440(10)64925-5. [DOI] [PMC free article] [PubMed] [Google Scholar]
- Semchuck KM, Love EJ, Lee RG. Parkinson's disease: A test of the multifactorial etiologic hypothesis. Neurology. 1993;43:1173–1180. doi: 10.1212/wnl.43.6.1173. [DOI] [PubMed] [Google Scholar]
- Tanner CM, Langston JW. Do environmental toxins cause Parkinson's disease? A critical review. Neurology. 1990;40:17–30. [PubMed] [Google Scholar]
- Taylor JP, Hardy J, Fischbeck KH. Toxic proteins in neurodegenerative disease. Science. 2002;296:1991–1995. doi: 10.1126/science.1067122. [DOI] [PubMed] [Google Scholar]
- Toscano CD, Guilarte TR. Lead neurotoxicity: From exposure to molecular effects. Brain Res. Brain Res. Rev. 2005;49:529–554. doi: 10.1016/j.brainresrev.2005.02.004. [DOI] [PubMed] [Google Scholar]
- Waalkes MP, Harvey MJ, Klaassen CD. Relative in vitro affinity of hepatic metallothionein for metals. Toxicol. Lett. 1984;20:33–39. doi: 10.1016/0378-4274(84)90179-6. [DOI] [PubMed] [Google Scholar]
- Waalkes MP, Liu J, Goyer RA, Diwan BA. Metallothionein-I/II double knockout mice are hypersensitive to lead-induced kidney carcinogenesis: Role of inclusion body formation. Cancer Res. 2004;64:7766–7772. doi: 10.1158/0008-5472.CAN-04-2220. [DOI] [PubMed] [Google Scholar]
- White LD, Cory-Slechta DA, Gilbert ME, Tiffany-Castiglioni E, Zawia NH, Virgolini M, Rossi-George A, Lasley SM, Qian YC, Basha MR. New and evolving concepts in the neurotoxicology of lead. Toxicol. Appl. Pharmacol. 2007;225:1–27. doi: 10.1016/j.taap.2007.08.001. [DOI] [PubMed] [Google Scholar]
- Wu J, Basha MR, Brock B, Cox DP, Cardozo-Pelaez F, McPherson CA, Harry J, Rice DC, Maloney B, Chen D, et al. Alzheimer's disease (AD)-like pathology in aged monkeys after infantile exposure to environmental metal lead (Pb): Evidence for a developmental origin and environmental link for AD. J. Neurosci. 2008;28:3–9. doi: 10.1523/JNEUROSCI.4405-07.2008. [DOI] [PMC free article] [PubMed] [Google Scholar]
- Zhou W, Freed CR. Tyrosine-to-cysteine modification of human alpha-synuclein enhances protein aggregation and cellular toxicity. J. Biol. Chem. 2004;279:10128–10135. doi: 10.1074/jbc.M307563200. [DOI] [PubMed] [Google Scholar]


