

Abstract
The mixed-resolution elastic network model was introduced previously for computing the motions of a structure, which is described at different levels of detail in different parts, for example, with atomistic and residue-level regions. This method has proved to be an efficient tool to explore the collective dynamics of proteins with some atomistic details, which would be difficult to obtain with either conventional full-atom approaches or fully coarse-grained models. Understanding function often requires atomic detail, but not necessarily for the entire structure. In this study, the calculation of the interaction forces between different resolution regions for the hierarchical levels of coarse-graining is further elaborated on in the new approach by considering explicitly the atomic contacts in the crystal structure. The collective dynamics of the enzyme triosephosphate isomerase and its active site together with loop 6 motions are considered in detail. The supramolecular assemblage ribosome and local atomic motions in its “interesting” functional part—the decoding center—are investigated for the low frequency range of the spectrum with high computational efficiency. This new atom-based mixed coarse-graining approach can be effectively used to generate realistic high-resolution conformations of extremely large protein-DNA or RNA complexes by performing energy minimization on structures deformed along the normal modes of the elastic network model. The new model permits focusing on specific functional parts that move in coordination and response to the remainder of the entire structure.
Introduction
Exploring the dynamics of biological systems is a key for understanding their functional mechanisms. Computational techniques that use fully atomistic empirical potentials, such as normal mode analysis and molecular dynamics simulations, are commonly used to describe harmonic and anharmonic motions of proteins and their complexes (1–4). Low-frequency motions involving large portions of the proteins are often related to their biological functions (5), such as the transitions between open and closed conformations (6,7) and the ratchet-like motion of the ribosome during protein synthesis (8). However, when large systems like the ribosome are to be considered, fully atomistic methods are inappropriate for the investigation of its global motions because of limits to computational resources.
Elastic network models, namely the Gaussian network model (9) for scalar descriptions of motions and the anisotropic network model (ANM) (10) for the vectors of motions, are efficient tools to determine the harmonic motions of proteins around their native structures. They consider the residue displacements as either isotropic (Gaussian network model) or anisotropic (ANM). These coarse-grained (cg) models can successfully predict the mechanical motions of proteins by using a uniform harmonic potential to the interacting node pairs in the system (11–13). The coarse-graining is generally carried out at the one-node-per-amino acid level for proteins, but lower resolution models, i.e., several residues per node, have also proved satisfactory in determining the lower-frequency collective modes (14,15), insofar as the overall shape of the molecule is preserved. The building block approach (16) and the minimalist network model (17) are other efficient cg normal mode approaches.
A mixed cg approach has been introduced recently for the ANM to observe the dynamics of specific regions in atomistic detail while retaining the greater computational efficiency of the cg model (18,19). In this approach, the native structure of a protein or its complex is modeled as a collection of atomistic and cg nodes comprising the high- and low-resolution regions, respectively. In an energy matching scheme, the close neighboring node pairs are linked by harmonic springs, whose strengths depends on the node sizes. Thus the overall cohesion of the structure is maintained, regardless of the level of coarse-graining. This model has produced results conforming to experimental observations, such as the inherent opening/ closing motion of the functional loop over the catalytic site in triosephosphate isomerase (TIM). The model has also yielded cases where there is a strong coupling of functional loop motions with the global dynamics of the two subunits (19), which agrees overall with recent molecular dynamics simulation results (20).
In this study, we propose what to our knowledge is a new and simpler alternative approach for constructing the mixed-resolution network including regions in atomic detail, as in our earlier work (18). This new version of mixed cg maintains the flexibility of the elastic network and specifies a force constant for each node pair based simply on the number of atom-atom contacts between the residues. Because only a single atomistic cutoff is used, no prior adjustment of cutoffs and force constants for the different sized nodes is necessary. Amino acids, nucleotides, and other ligands can likewise be treated in this same way. Thus this new version of our mixed cg method is an efficient tool for elucidating the atomic fluctuations of protein-RNA (or protein-DNA) complexes.
We will also show that realistic atomistic conformations can be obtained straightforwardly by deforming the native structure along sets of collective modes and carrying out energy minimization on the deformed structures. We have used this so-called reverse-mapping technique recently to provide atomistic conformers for ensemble docking (21). Cavasotto et al. have also used elastic network models to incorporate localized loop flexibility at the binding site of a protein kinase for ensemble docking (22). Other similar approaches combine elastic network models and molecular dynamics simulations for the efficient sampling of conformational changes of proteins along collective modes (23,24).
Theory
Elastic network model
The elastic network models are always based on the known folded “native” structures of proteins and treat biomolecules as uniform materials undergoing collective motions dictated principally by their shapes. In the original models, namely the Gaussian network model (9) and the ANM (10), amino acids have often been represented by single point masses, i.e., nodes, located at each Cα position, and for nucleotides by a single point at P (25), or two points at P and O4′ (26), or three points at P, C2, and C4′ positions (27). The three-dimensional network is usually formed by linking all node pairs falling within a fixed cutoff distance rcut with a spring having a uniform spring constant γ. The total energy of the system of N points is then given by the summation over the harmonic interactions of (i,j) pairs defined as
| (1) |
where, Ri and ΔRi are the position and fluctuation vectors of node i (1 ≤ i ≤ N); Rij is the distance between (i,j) pairs. h(x) is the Heaviside step function whose value equals 1 if x ≥ 0, i.e., if nodes are sufficiently close, and zero otherwise. The adjustable harmonic spring constant γ is identical for all of the interacting nodes in the elastic network. A recent reformulation to introduce distance dependence in the spring constants yields some gain in precision (7).
The potential energy of the network can be also expressed as
| (2) |
Here ΔR is the 3N-dimensional fluctuation vector and ΔRT is its transpose. The Hessian matrix H (3N × 3N) elements are the second derivatives of the total potential energy with respect to the mass-weighted coordinate of the ith and jth nodes. From the diagonalization of the Hessian matrix, the normal modes giving both the magnitudes and directions of residue fluctuations are calculated from
| (3) |
where, Λ is a (3N × 3N) diagonal matrix with diagonal elements corresponding to eigenvalues (λ1,…, λ3N) or squared normal mode frequencies. S is an orthogonal (3N × 3N) matrix whose columns are the eigenvectors. The overall motion of the system can be calculated from the summation over 3N normal modes, after removing the rigid body translational and rotational motion frequencies having zero eigenvalues, resulting in 3N-6 internal normal modes.
From the set of 3N−6 eigenvectors (S1…S3N−6) and corresponding eigenvalues (λ1…λ3N−6), the mean-square (ms) fluctuation of residue i in terms of mass-weighted coordinates (15) can be expressed as the sum over the normal modes
| (4) |
where k is the Boltzmann constant, T is the absolute temperature, and ωk is the normal mode frequency for the kth mode where ωk2 = λk. It is customary to obtain the adjustable spring constant implicitly given in , by comparing the theoretical ms fluctuations from Eq. 4 with the experimental temperature factors Bi defined as
| (5) |
The cg elastic network models with a simple harmonic potential and without considering atomistic details can give insights about the μs–ms range of collective dynamics of proteins with high computational efficiency (9,10,14,28–30). In fact, one of the low-frequency harmonic modes often correlates with the direction of conformational transitions, for those proteins showing large conformational changes on binding (6,7).
Mixed cg model
The mixed cg elastic network model was developed to investigate the collective dynamics of proteins described as a combination of atomistic (high-resolution) and cg (low-resolution) regions (18,19). Each node represents either a heavy atom in the high-resolution or a single residue in the low-resolution region, and the neighboring node pairs within a cutoff distance are linked with harmonic springs. It has been necessary to adjust the cutoff distance to successfully perform uniform coarse-graining of the network at hierarchical levels (14). Similarly, different cutoffs and interaction parameters need to be assigned to the high- and low-resolution regions of the mixed-resolution network. This represents a process of matching the interaction energies to maintain the same extent of cohesiveness for models at the various levels of coarse-graining.
In our previous approach (18,19), adjustments of cutoffs and force constants for the high- and low-resolution regions were carried out based on uniform atomistic and residue-based ANM calculations of several relatively small proteins (78–494 residues), even though these parameters are known to be system-size dependent. Moreover, the force constant for the interface region between the high- and low-resolution parts should be carefully adjusted to prevent any unwanted rigidity at the interface (19). Our previous procedure was based on matching interaction energies between the detailed and cg regions and resembled the force-matching method of the Voth group (31), except that energies were being matched instead of forces. For the cg models, the results are not so sensitive to the details because each point usually interacts with a large number of other sites.
In this study, we develop an alternative mixed coarse-graining approach that is based on a single atomic cutoff distance and thus is not system-size dependent. This approach resembles force matching more closely and can be straightforwardly applied to biological macromolecules of various sizes and types including protein-DNA or RNA complexes. This procedure is as follows:
-
1.
All the heavy atoms within a cutoff distance in the native structure of the protein complex are connected with identical harmonic springs, forming an atom-based elastic network (see Fig. S1 in the Supporting Material). The determination of the cutoff distance for pair-wise atomic interactions in a protein complex is explained in the results section.
-
2.
This elastic network is separated into high- and low-resolution regions (Fig. S1). The interesting parts or parts being focused on such as an active site, can be described at the atomistic level (high-resolution). The remainder of the structure can be modeled on the cg (low-resolution) level that might contain for example five residues-per-node denoted as “N/5,” where N denotes the total number of residues in this region (14,15).
-
3.
In the high-resolution region, neighboring nodes (heavy atoms) are connected pair-wise by a spring constant γ, taken as unity in this study. In the low-resolution region, one node may represent one or multiple consecutive amino acids or nucleotides with a mass equal to the total mass of the heavy atoms included in this group. Larger force constants are needed to link heavier nodes to maintain the homogeneity of the forces within the system. Therefore, the value of the force constant between two low-resolution nodes (or between a low-resolution and a high-resolution node) is taken directly proportional to the total number of interacting atom pairs between them, with the assumption that all of these are acting in parallel to one another (Fig. S1). Therefore, this linear dependency of the force constant on the number of atom-atom interactions provides a stronger coupling between close cg nodes such as covalently bonded residues than between nodes located further apart.
-
4.
The Hessian matrix H (connectivity matrix) for the mixed-resolution elastic network is then mass weighted as M−1/2 H M−1/2 where M is the diagonal node mass matrix, and the normal mode analysis is carried out to obtain the displacement vectors at low frequencies correlated with the biological functioning of the proteins.
The most challenging procedure in our calculations is the diagonalization of the Hessian matrix to obtain the magnitudes and directions of the harmonic mode fluctuations. This is computationally expensive especially if the supramolecular system is extremely large. For this purpose, the computationally efficient software package BLZPCK (32) using the block Lanczos algorithm (33) is applied to solve the standard and generalized eigenvalue problems for a specified number of normal modes.
Reverse-mapping: generation of atomistic conformers
New conformations are generated by deforming the native structure along both positive and negative directions of the selected low-frequency eigenvectors representing the most collective motions. This procedure has been adopted from our recent studies on docking to reverse-map conformers from atomistic and residue-based ANM (21). In the case of the mixed cg ANM, atomistic conformers can be generated by rigidly displacing all the atoms in a low-resolution node in the same direction as the node center, which may be either a single residue or a group of residues. These deformed structures are subsequently relaxed into realistic conformations by energy minimization using AMBER (34,35) with the ff03 force field parameters (36). For each conformer, 500 cycles of steepest descent minimization are carried out, followed by conjugate gradient minimization until the energy gradient per atom reaches 0.01 kcal × mol−1 × Å−1. A pair-wise generalized Born model (37,38) is used to mimic the effect of waters during the minimization. The cutoff for nonbonded interactions is fixed at 16 Å. Salt concentration for 1-1 mobile counterions in the solution is set to 0.1 M according to a generalized Born theory based on the Debye-Hückel limiting law for ion screening of interactions (39).
Proteins studied
TIM (Protein Data Bank (PDB) (40) code: 8tim) is a widely investigated enzyme both experimentally and theoretically (41–45), and is studied here as an extension of our earlier work (18–20), and serves as an example to validate the proposed method (Fig. 1 A). TIM catalyzes the interconversion between dihydroxyacetone phosphate and D-glyceraldehyde 3-phosphate in glycolysis by protonation and deprotonation (42). TIM, which is a homodimer of ∼500 residues, comprises two active sites, one on each monomer and is fully active as the dimer (46,47). Over the catalytic site, a functionally important flexible loop (loop 6, Pro166-Ala176) (43) opens and closes to protect the substrate from solvent, inhibiting the formation of a toxic by-product (48).
Figure 1.
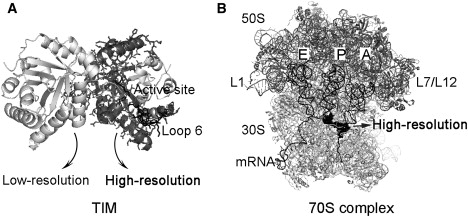
Cartoon representations of the two model systems used in this study. (A) TIM. (B) Ribosome complexed with A-, P-, E-tRNAs, and mRNA. The dark gray region represented as sticks in TIM, and the black surface of the ribosome complex are considered to be the high-resolution regions in the elastic networks. The active site region on one monomer of TIM and the functional parts of the ribosome complex are thus indicated.
Another test case is the bacterial ribosome in its complex with messenger RNA (mRNA), and three transfer RNAs (tRNAs) (Fig. 1 B), which is studied with the newly developed mixed cg approach to demonstrate the computational efficiency of this atom-based model. The ribosome synthesizes proteins in the cell according to the genetic information, by mediating the interaction of the mRNA and tRNAs carrying the amino acids. It has two subunits, the 30S and the 50S, together called the 70S, each of which contains large rRNA and multiple ribosomal proteins (49). There are three binding sites for tRNAs in the 30S-50S interface, which are the A (aminoacyl), P (peptidyl), and E (exit) sites. During protein synthesis, at the decoding center on the 16S rRNA, nucleotides A1492 and A1493 control the correct codon-anticodon pairing at the A-site, by several interactions with the mRNA (50).
The crystal structures of the ribosome complex studied are 2hgp (30S subunit, mRNA and three tRNA) and 2hgq (50S subunit) (51), respectively. The extended protein L9 on the large subunit is excluded from the ribosome model to prevent its high amplitude motions dominating the normal mode analysis, and the missing proteins on the L7/L12 stalk (PDB code: 1dd4 (52), forming an important domain in the collective dynamics of the ribosome (25,53,54) have been added to the crystal structure (Fig. 1 B).
Results
Mixed-resolution ANM of TIM
In our previous studies (18,19), it was shown that a cutoff value in the range between 6 and 9 Å for the pair-wise atom interactions in the high-resolution region of the elastic network was appropriate for describing the collective motions of various proteins (for structures having a total number of residues ranging between 78–494). In this study, a cutoff distance of 10 Å is also found to be satisfactory for all atomic pair-wise interactions between amino acids in the uniform and mixed-resolution models. As mentioned above, the elastic network model is not so sensitive to the cutoff distance used to link the residues as each node already makes a large number of contacts. Therefore, this cutoff value is preferred to avoid the extreme mobility of some relatively few solvent-exposed tip residues in certain proteins (55). For comparison and validation of the new atom-based approach, TIM is also studied with the original residue-based model (10), where the Cα atoms represent the nodes of the network, and the cutoff distance is usually taken as 13 Å.
The similarity between the deformation directions for two normalized eigenvector sets vi and wj from normal modes is estimated by the overlap value, which is calculated as the inner dot product averaged over the first 10 normal modes (k = 10) (56), to represent the most collective motions
| (6) |
An overlap value of 1 means a perfect match between the two sets of eigenvector.
In Table 1, the overlap value between the uniform cg models using the residue-based and the atom-based approaches is tabulated as 0.94 for TIM, showing the high reliability of the new methodology.
Table 1.
Overlap values calculated for the first 10 modes
| Models | TIM | 70S ribosome |
|---|---|---|
| Residue-based uniform cg, atom-based uniform cg | 0.94 | 0.87 |
| Atom-based uniform cg, atom-based mixed cg (N/1) | 0.96 | 0.99 |
| Atom-based mixed cg (N/1), atom-based mixed cg (N/5) | 0.89 | 0.80 |
Calculated using only the Cα atoms of amino acids and P atoms of nucleotides.
Similar to previous studies (18,19), for our mixed-resolution structure of TIM, the high-resolution region comprises the active site residues and the functionally important loop 6 on one monomer (Fig. 1 A). The remainder of the structure is described at low-resolution while maintaining the overall shape of the enzyme, which is known to be an important consideration in the normal mode analysis (13,19,57). The ratio of the high-resolution to low-resolution nodes is 1290:323 for the cg part at one-residue-per-node. The example protein TIM is relatively small (3734 heavy atoms in total), and the computational cost for the diagonalization of the Hessian matrix at full-atomistic-resolution is affordable. Nevertheless, this mixed cg model for TIM decreases the size of the system to 1613 nodes from 3734 nodes, which greatly improves the computation time of the normal modes. For example, the computation time of the 100 normal modes for the full-resolution structure is 65.7 min, whereas it is 9.4 min for this mixed-resolution structure on a 1.5 GHz Titanium processor. This represents an important savings, but is even more important for larger structures.
The uniform and mixed cg models using the atom-based approach conform well, with an overlap value of 0.96. Finally, the overlap value between the mixed cg model with the low-resolution region represented at one-residue-per-node level (N/1) and at five-residue-per-node level (N/5) is 0.89, indicating that the model gives highly satisfactory results even at this higher level of coarse-graining.
TIM conformers generated by mixed-resolution ANM
Table 2 lists the energies of the conformers after minimization using an implicit solvation model, which allows a direct comparison of energies for different conformers. The conformers generated by deformation along the slowest three modes have reasonable final energy values when compared with the native state, also subjected to energy minimization. The root mean-square deviations (RMSD) of new conformers from the minimized x-ray structure are slightly higher than 1 Å. Moreover, the RMSD of the loop 6 region (residues Pro166-Ala176) alone is also given, based on the conformers aligned with the x-ray structure. Values in the range of 1.12–2.27 Å indicate appreciable loop mobility, which is known to take place in the apo structure (58).
Table 2.
Reverse-mapped TIM conformations
| Conformer | RMSD∗ (Å) | Energy (kcal/mol) | RMSD-loop6 (Å)† | Ramachandran outliers (%) | Rotamer outliers (%) |
|---|---|---|---|---|---|
| X ray | — | −13,119 | — | 0.4 | 3.0 |
| Mod1a | 1.16 | −13,102 | 1.97/2.27 | 0.4 | 2.4 |
| Mod1b | 1.16 | −13,103 | 2.24/2.14 | 0.2 | 2.7 |
| Mod2a | 1.15 | −13,098 | 1.12/2.09 | 0.0 | 2.2 |
| Mod2b | 1.15 | −13,129 | 1.06/2.10 | 0.2 | 2.4 |
| Mod3a | 1.06 | −13,094 | 1.87/1.22 | 0.2 | 3.3 |
| Mod3b | 1.05 | −13,102 | 2.03/1.18 | 0.4 | 3.3 |
RMSD values compare against the x-ray structure, including all atoms.
RMSD for loop 6 is based on the x-ray conformation, given separately for the A/B monomers.
Validation of the generated conformers is carried out using the MolProbity web-server (59,60), which provides both all-atom contact analysis and dihedral angle diagnostics on main and side-chains. There are no steric overlaps in the reverse-mapped conformers due to the energy minimization procedure. Our conformers exhibit a few Ramachandran (up to ∼0.4%) and rotamer (∼2.2–∼3.3%) outliers (see Table 2). In fact, similar outliers (0.4% and 3.0%) exist in the energy-minimized x-ray structure of TIM having a 2.5 Å resolution.
Experiments have indicated that the closure of loop 6 is not ligand-gated, i.e., the loop opens/closes in the apo form as well (58). In our recent molecular dynamics simulations without any ligand (20), loop 6 shows various conformations between open and almost closed states in the dimeric TIM. Therefore, we have considered the conformations adopted by loop 6 in the reverse-mapped structures. In Fig. 2 A, the active site regions of the conformations generated along the positive and negative directions of the first and second modes (Mod1a, Mod1b, Mod2a, and Mod2b) are shown with loop 6 forms on monomer A highlighted in different colors.
Figure 2.
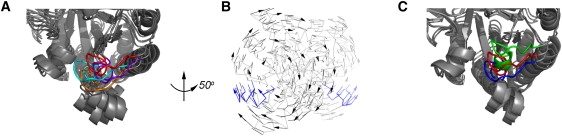
(A) Active sites of the reverse-mapped conformers of TIM with the functional loop 6 are shown in orange (Mod1a), red (Mod1b), cyan (Mod2a), and purple (Mod2b) on monomer A. (B) The anticorrelated twisting motion of the monomers around a rotation axis in the first normal mode. One of the alternative directions of motion is indicated with arrows for some residues. Loop 6 is shown in blue on both monomers of the Mod1a conformer. (C) The closure of loop 6 on monomer B is depicted along the crystal structure (blue), with the reverse-mapped first mode Mod1b (red) from the first ANM and energy minimization cycle, and the reverse-mapped conformation from the second cycle, Mod1b′ (green).
Among the new conformers, Mod1a and Mod1b exhibit relatively open and closed loop 6 conformations, respectively. In Fig. 2 B, a side view of TIM is shown, where the direction of motion between Mod1a and Mod1b is indicated. The direction of motion indicates a clockwise rotation of the A-subunit and counter-clockwise rotation of the B-subunit (in the rear) for the Mod1a structure, which is depicted with faint lines. It shows the twisting motion of the structure around an axis that passes through the core region of the TIM barrel. Our molecular dynamics simulation (20) has shown a similar counter-rotation-type motion of the two subunits that is responsible for the closure of loop 6. Here, residues Glu171 and Thr172 on the tip region of the loop6 on monomer B move 4.17 (5.02) Å and 5.14 (5.51) Å, respectively, based on the Mod1a and Mod1b energy minimized conformers. Thus the loop conformations move to a highly significant extent.
To generate other conformations for loop closure, another cycle of reverse-mapping is carried out on the Mod1b conformer (shown with the red loop 6 on monomer B in Fig. 2 C). Steps of ANM deformation along the first mode and energy minimization are carried out, leading to the new conformer named as Mod1b′, (shown with a green loop 6 in Fig. 2 C), where the loop 6 closes further over the active site. Quantitatively, distance changes for Glu171 and Tyr208 are 14.95 Å (16.26 Å) in monomer A (monomer B), whereas the same distance is 15.12 Å (16.47 Å) for Mod1b (before the second reverse-mapping cycle). The corresponding distances in the open (8tim) and closed (1tph) x-ray structures are 15.77 Å (17.25 Å) and 13.37 Å (13.32 Å). Hence, the reverse-mapping procedure using the slowest ANM mode can sample conformations of loop 6 along the closing direction. It should also be noted that the loop conformational changes do not occur independently but are coupled with the global counter-rotations of the two subunits, which conforms to our recent molecular dynamics simulations on TIM (20). This is a common theme that we have now observed many times—functional loop motions usually appear in conjunction with slow modes of motion in the elastic models, with nonfunctional loops moving at higher frequencies.
Mixed-resolution ribosome model in complex with three tRNA and mRNA
The ribosome structure in complex with tRNA3 × mRNA is modeled to further validate the computational efficiency of the new methodology. The missing proteins on the L7/L12 stalk (PDB code: 1dd4) (52) are added to the crystal structure to create density in this region of the elastic network. The extended protein L9 on the large subunit is deleted in the structure to prevent its extreme mobility, which would dominate the computed low frequency motions.
The ribosome complex is modeled with the residue-based uniform cg to compare with the dynamics calculated with the new atom-based approach of cg. As in our previous ANM study (25), the interaction cutoff distance between Cα-Cα pairs is taken as 15 Å and for Cα-P and P-P pairs as 24 Å in the uniform elastic network.
The overlap value between the atom-based and the residue-based uniform cg models of the ribosome is found to be 0.72. Here, a uniform atomic cutoff of 10 Å is used for all interactions between amino acids and nucleotides. Even though this value seems satisfactory, we wished to improve the one-to-one correspondence between the slowest modes of the two models. We tried larger atomic cutoff values for nucleotide-nucleotide (n-n) and amino acid-nucleotide interactions (aa-n), due to the fact that in our coarse-graining both amino acid residues and nucleotides of quite different sizes are represented by single nodes. The choice of 13 and 15 Å for n-n interaction, while keeping the atomic cutoff at 10 Å for amino acid residues (aa-aa), increased the overlap values to 0.84 and 0.86, respectively. One final adjustment was to set the aa-n interaction cutoff to 13 Å, resulting in an overlap of 0.87. Thus our calculations are based on this final choice of cutoff parameters for all the ribosome models (rcut for aa-aa = 10 Å, for aa-n = 13 Å, for n-n = 15 Å) and the corresponding overlap values are listed in Table 1. These cutoff values may be reliably applied to any globular protein, protein-DNA and RNA complex with the new atom-based elastic network model.
In the mixed-resolution structure, the high-resolution region is selected as the codon and anticodon areas of mRNA and tRNAs at the A- and P-sites and the decoding center A1492, A1493 of the 16S rRNA in the small subunit (Fig. 1 B). The shape of the structure remains intact by modeling the low-resolution region at one-residue-per-node (N/1) and five-residues-per-node (N/5) level. The ratio of high-resolution/low-resolution nodes is 298:10,987 for the one-residue-per-node cg. The uniform and mixed cg ribosome models using the new atom-based approach yields a very high overlap (0.99 for the cg level N/1), which remains high even for coarser-graining in the low-resolution region (0.80 for cg level N/5) (Table 1).
The cumulative first 10 modes ms fluctuations are calculated for different levels of mixed cg. The first 10 normal modes include the most collective motions of the ribosome such as the ratchet-like rotation of the subunits (8), the head rotation of the small subunit (61–63), and the anticorrelated motions of the large stalks (64,65). Fig. 3 displays the ms fluctuations for the small subunit 30S with tRNAs and mRNA, which are mixed cg with the cg levels of N/1 and N/5. For the high-resolution region including A1492, A1493 on 16S rRNA, anticodon stem-loops (ASL) of A-tRNA and P-tRNA, and the corresponding codons of mRNA, the ms fluctuations are displayed in detail (Fig. 3 B). In Fig. 3 C, the ms fluctuations of the same region are shown for the cg model of the ribosome complex. Although the fluctuations of the mixed cg model with cg level of N/5 seem to be lower in magnitude with respect to the model with cg level N/1, the trend is the same, showing the efficiency of the new model.
Figure 3.
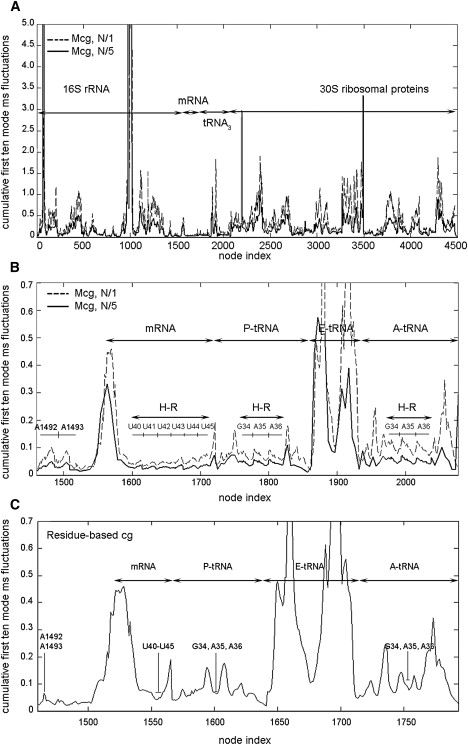
(A) Mean-square fluctuations of the small 30S subunit of the ribosome, averaged over the 10 slowest modes, which match the most collective motions of the complex. Two mixed coarse-grained (mcg) ribosome models with cg levels N/1 (dashed line) and N/5 (solid line) shown using all node centers (atomistic and cg). The individual parts on the subunit are indicated. (B) Mean-square fluctuations for the same ribosome models with the high-resolution (H-R) regions (A- and P-sites and the decoding center A1492, A1493) enlarged to show atomistic detail. (C) Same plot for the uniform cg ribosome where the corresponding cg A- and P-sites and the decoding center are indicated. Note that the node indices are not the same as for the mixed cg models.
The third slowest normal mode of the ribosome mixed cg model seems to be equivalent to the ratchet-like motion of the subunits during protein synthesis as observed with cryo-EM (8). The alternative mode shapes of the ribosome complex are displayed in Fig. 4 A for the third slowest mode obtained with the mixed cg model with cg level N/5. The ratchet-like rotation and counter motion of L1 and L7/L12 stalks (64,65) are observed clearly with atomistic detail at the decoding center and codons/ anticodon region.
Figure 4.
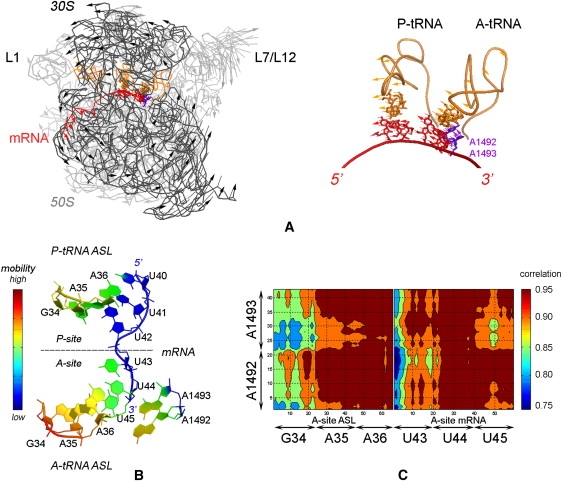
(A) Ratchet-like rotation of the small (30S, in dark gray) and the large (50S, in gray) subunits observed in the third normal mode indicated by arrows for some residues. The high-resolution region is represented in sticks on the mRNA (red), A- and P-tRNAs (orange), and A1492-A1493 (purple). The coarse-graining level for the low-resolution region is N/5. (B) The color-coded mobility in A- and P-sites on the mRNA, tRNAs and nucleotides A1492, A1493, calculated by mean-square fluctuations averaged over the 10 slowest modes. Red color designates high mobility. (C) Correlation plots for the atoms at the decoding center, the codons and anticodons at the A-site.
Fig. 4 B displays the mobility in the high-resolution region calculated from the cumulative first 10 mode fluctuations, where the color red stands for high mobility. The side chains of A1492, A1493, and ASL of A-tRNA seem to possess more mobility in the slow modes compared to the P-tRNA and mRNA. Moreover, the A-site of the mRNA is more mobile when compared to the mRNA at the P-site, which agrees well with the experimental B-factors (not shown). The dot products between the decoding center direction and the A-site codon-anticodon direction are calculated cumulatively for the first 10 modes with atomistic details (Fig. 4 C). The analysis shows that G34 of A-tRNA and U43 of mRNA show relatively lower correlation with the decoding center, also related to the orientation of the side chains in the native structure. The advantage of the atomistic analysis lies in uncovering significant differences in the motions of the macromolecule at the atomic level that are most related to its activity. For example, the side chains of A1492 and A1493 are significantly more mobile with respect to their backbone, which is not observed with a uniform cg model, such as those used in previous ribosome studies (25,53).
Binding of the antibiotic paromomycin to the small subunit
The effect of an antibiotic on the low frequency dynamics of the decoding center and mRNA is investigated at the atomistic level with the newly developed approach. The structure of the antibiotic paromomycin is obtained from the crystal structure of the ribosome small subunit bound to several antibiotics, with the PDB code 1fjg (66). The small molecule is placed on the 2hgp structure (51) at its binding site near the decoding center residues A1492 and A1493 by aligning the x-ray structures 1fjg and 2hgp based on ribosomal RNA 16S (Fig. S2 A).
The antibiotic paromomycin by binding to the small subunit stabilizes a conformation specific to cognate codon-anticodon pair recognition (67), thus affecting the translation fidelity by approving noncognate tRNAs. As would be expected, the small molecule does not significantly change the dynamics of the supramolecular complex in the 10 slowest modes (not shown); however its effect seems to emerge as additional low frequency modes are included. The ms fluctuations averaged over the first 100 normal modes clearly indicate a significant decrease in the mobility of atoms especially at the decoding center and the A-site of the mRNA leading to a more stable conformation (Fig. S2, B and C).
Discussion and Conclusion
Mixed-resolution elastic network models are computationally efficient tools to analyze the harmonic motions of biological systems with atomistic details at the regions of interest, such as the catalytic site of an enzyme. This new approach based on atom contacts in the native structure provides a straightforward prescription to calculate the interaction parameters among the low and high-resolution regions in the elastic network, thus facilitating normal mode analysis at the atomistic detail for supramolecular assemblages such as the ribosome × tRNA3 × mRNA complex. In addition, this method allows the application of hierarchical levels of coarse-graining in the low-resolution region to decrease the system size, as a result of which diagonalization of the Hessian matrix becomes more computationally efficient.
We have shown clearly that the experimental observations concerning the opening/closing of loop 6 over the active site of TIM, the ratchet-like rotation of the two major ribosome subunits, and the mobility of its large subunit proteins L1 and L7/L12 are obtained successfully with the new approach. Focusing on the high-resolution regions of the ribosome—the decoding center, A- and P-site codons, and anticodons in this study—has lead to observation of the atoms' harmonic fluctuations at lowest frequencies and their correlations with each other. These atomic motions are related to the ribosome's functional mechanism, where a lower-resolution method would be unable to observe. Furthermore, the binding of the small antibiotic paromomycin near the decoding center is observed to stabilize especially the atom fluctuations at the A-site of mRNA at low frequencies. Such an effect of a small drug would likely not be observable with a uniformly cg model at the residue-level.
We have also presented a what we believe is a complementary reverse-mapping technique for the generation of realistic atomistic conformers. This is achieved by deforming the native structure along the slowest modes and subsequently applying energy minimization using an implicit solvation model. Even though the procedure is validated here only for TIM, it can also be applied to highly cg proteins, where, for example, the interesting functional parts are represented at one-node-per-residue level, and the remaining parts of the structure at higher levels of coarse-graining, as in our earlier study (15). Thus, the reverse-mapping procedure combined with the mixed-resolution elastic networks can efficiently generate realistic conformers for supramolecular assemblages, which may be used further in ensemble docking studies (21,22). It holds out the important promise of enabling functional motions studies on the effects of small cofactors such as ATP and GTP and drugs, as well as the effects of posttranslational modifications and mutations.
Supporting Material
Two figures are available at http://www.biophysj.org/biophysj/supplemental/S0006-3495(09)01111-4.
Supporting Material
Acknowledgments
The authors declare no conflict of interest. All molecular figures are prepared using the molecular visualization software PyMOL (http://pymol.sourceforge.net).
This work was supported by TUBITAK (project 104M247 to P.D. and O.K.), the European 6th Framework Project (and EU-FP6-ACC-2004-SSA-2 contract No. 517991 to P.D. and O.K.), and the National Institutes of Health (R01GM073095-03, R01GM072014-5, and, R01GM081680-0 to R.L.J.). Computer support was provided by the National Science Foundation (grant CNS-0521568 to R.L.J.).
Footnotes
Ozge Kurkcuoglu's present address is Biomolecular Modelling Laboratory, Cancer Research UK, London Research Institute, Lincoln's Inn Fields Laboratories, London WC2A 3PX, UK.
References
- 1.Levitt M., Sander C., Stern P.S. Protein normal-mode dynamics: trypsin inhibitor, crambin, ribonuclease and lysozyme. J. Mol. Biol. 1985;181:423–447. doi: 10.1016/0022-2836(85)90230-x. [DOI] [PubMed] [Google Scholar]
- 2.McCammon A., Harvey S.C. Cambridge University Press; Cambridge, UK: 1987. Dynamics of Proteins and Nucleic Acids. [Google Scholar]
- 3.Tirion M.M. Large amplitude elastic motions in proteins from a single-parameter, atomic analysis. Phys. Rev. Lett. 1996;77:1905–1908. doi: 10.1103/PhysRevLett.77.1905. [DOI] [PubMed] [Google Scholar]
- 4.Kitao A., Go N. Investigating protein dynamics in collective coordinate space. Curr. Opin. Struct. Biol. 1999;9:164–169. doi: 10.1016/S0959-440X(99)80023-2. [DOI] [PubMed] [Google Scholar]
- 5.Berendsen H.J.C., Hayward S. Collective protein dynamics in relation to function. Curr. Opin. Struct. Biol. 2000;10:165–169. doi: 10.1016/s0959-440x(00)00061-0. [DOI] [PubMed] [Google Scholar]
- 6.Tama F., Sanejouand Y.H. Conformational change of proteins arising from normal mode analysis. Protein Eng. 2001;14:1–6. doi: 10.1093/protein/14.1.1. [DOI] [PubMed] [Google Scholar]
- 7.Yang L., Song G., Jernigan R.L. Protein elastic network models and the range of cooperativity. Proc. Natl. Acad. Sci. USA. 2009 doi: 10.1073/pnas.0902159106. In press. [DOI] [PMC free article] [PubMed] [Google Scholar]
- 8.Frank J., Agrawal R.K. A ratchet-like inter-subunit reorganization of the ribosome during translocation. Nature. 2000;406:318–322. doi: 10.1038/35018597. [DOI] [PubMed] [Google Scholar]
- 9.Bahar I., Atilgan A.R., Erman B. Direct evaluation of thermal fluctuations in proteins using a single-parameter harmonic potential. Fold. Des. 1997;2:173–181. doi: 10.1016/S1359-0278(97)00024-2. [DOI] [PubMed] [Google Scholar]
- 10.Atilgan A.R., Durell S.R., Jernigan R.L., Demirel M.C., Keskin O. Anisotropy of fluctuation dynamics of proteins with an elastic network model. Biophys. J. 2001;80:505–515. doi: 10.1016/S0006-3495(01)76033-X. [DOI] [PMC free article] [PubMed] [Google Scholar]
- 11.Bahar I., Rader A.J. Coarse-grained normal mode analysis in structural biology. Curr. Opin. Struct. Biol. 2005;15:586–592. doi: 10.1016/j.sbi.2005.08.007. [DOI] [PMC free article] [PubMed] [Google Scholar]
- 12.Ma J. Usefulness and limitations of normal mode analysis in modeling dynamics of biomolecular complexes. Structure. 2005;13:373–380. doi: 10.1016/j.str.2005.02.002. [DOI] [PubMed] [Google Scholar]
- 13.Jernigan R.L., Yang L., Song G., Kurkcuoglu O., Doruker P. Elastic network models of coarse-grained proteins are effective for studying the structural control exerted over their dynamics. In: Voth G., editor. Coarse-Graining of Condensed Phase and Biomolecular Systems. CRC Press, Taylor and Francis Group; Boca Raton, FL.: 2008. pp. 237–254. [Google Scholar]
- 14.Doruker P., Jernigan R.L., Bahar I. Dynamics of large proteins through hierarchical levels of coarse-grained structures. J. Comput. Chem. 2002;23:119–127. doi: 10.1002/jcc.1160. [DOI] [PubMed] [Google Scholar]
- 15.Kurkcuoglu O., Doruker P., Jernigan R.L. Mixed levels of coarse-graining of large proteins using elastic network model succeeds in extracting the slowest motions. Polymer (Guildf.) 2004;45:649–657. [Google Scholar]
- 16.Tama F., Gadea F.X., Marques O., Sanejouand Y.H. Building-block approach for determining low-frequency normal modes of macromolecules. Proteins. 2000;41:1–7. doi: 10.1002/1097-0134(20001001)41:1<1::aid-prot10>3.0.co;2-p. [DOI] [PubMed] [Google Scholar]
- 17.Lu M., Ma J. A minimalist network model for coarse-grained normal mode analysis and its application to biomolecular x-ray crystallography. Proc. Natl. Acad. Sci. USA. 2008;105:15358–15363. doi: 10.1073/pnas.0806072105. [DOI] [PMC free article] [PubMed] [Google Scholar]
- 18.Kurkcuoglu O., Doruker P., Jernigan R.L. Collective dynamics of large proteins from mixed coarse-grained elastic network model. QSAR Comb. Sci. 2005;24:443–448. [Google Scholar]
- 19.Kurkcuoglu O., Doruker P., Jernigan R.L. Loop motions of triosephosphate isomerase observed with elastic networks. Biochemistry. 2006;45:1173–1182. doi: 10.1021/bi0518085. [DOI] [PMC free article] [PubMed] [Google Scholar]
- 20.Cansu S., Doruker P. Dimerization affects collective dynamics of triosephosphate isomerase. Biochemistry. 2008;47:1358–1368. doi: 10.1021/bi701916b. [DOI] [PubMed] [Google Scholar]
- 21.Akten, D., S. Cansu, and P. Doruker. A docking study using atomistic conformers generated via elastic network model for cyclosporin A/cyclophilin A complex. J. Biomol. Struct. Dyn. 27:13–26. [DOI] [PubMed]
- 22.Cavasotto C.N., Kovacs J.A., Abagyan R.A. Representing receptor flexibility in ligand docking through relevant normal modes. J. Am. Chem. Soc. 2005;127:9632–9640. doi: 10.1021/ja042260c. [DOI] [PubMed] [Google Scholar]
- 23.Isin B., Schulten K., Tajkhorshid E., Bahar I. Mechanism of signal propagation upon retinal isomerization: insights from molecular dynamics simulations of rhodopsin restrained by normal modes. Biophys. J. 2008;95:789–803. doi: 10.1529/biophysj.107.120691. [DOI] [PMC free article] [PubMed] [Google Scholar]
- 24.Zhang Z., Shi Y., Liu H. Molecular dynamics simulations of peptides and proteins with amplified collective motions. Biophys. J. 2003;84:3583–3593. doi: 10.1016/S0006-3495(03)75090-5. [DOI] [PMC free article] [PubMed] [Google Scholar]
- 25.Wang Y., Rader A.J., Bahar I., Jernigan R.L. Global ribosome motions revealed with elastic network model. J. Struct. Biol. 2004;147:302–314. doi: 10.1016/j.jsb.2004.01.005. [DOI] [PubMed] [Google Scholar]
- 26.Bahar I., Jernigan R.L. Vibrational dynamics of transfer RNAs: comparison of the free and synthetase-bound forms. J. Mol. Biol. 1998;281:871–884. doi: 10.1006/jmbi.1998.1978. [DOI] [PubMed] [Google Scholar]
- 27.Delarue M., Sanejouand Y.H. Simplified normal mode analysis of conformational transitions in DNA-dependent polymerases: the elastic network model. J. Mol. Biol. 2002;320:1011–1024. doi: 10.1016/s0022-2836(02)00562-4. [DOI] [PubMed] [Google Scholar]
- 28.Haliloglu T., Bahar I., Erman B. Gaussian dynamics of folded proteins. Phys. Rev. Lett. 1997;79:3090–3093. [Google Scholar]
- 29.Keskin O., Bahar I., Flatow D., Covell D.G., Jernigan R.L. Molecular mechanisms of chaperonin GroEL-GroES function. Biochemistry. 2002;41:491–501. doi: 10.1021/bi011393x. [DOI] [PubMed] [Google Scholar]
- 30.Doruker P., Nilsson L., Kurkcuoglu O. Collective dynamics of EcoRI-DNA complex by elastic network model and molecular dynamics simulations. J. Biomol. Struct. Dyn. 2006;24:1–15. doi: 10.1080/07391102.2006.10507093. [DOI] [PubMed] [Google Scholar]
- 31.Izvekov S., Voth G.A. Multiscale coarse graining of liquid-state systems. J. Chem. Phys. 2005;123:134105–134113. doi: 10.1063/1.2038787. [DOI] [PubMed] [Google Scholar]
- 32.Marques O., Sanejouand Y.H. Hinge-bending motion in citrate synthase arising from normal mode calculations. Proteins. 1995;23:557–560. doi: 10.1002/prot.340230410. [DOI] [PubMed] [Google Scholar]
- 33.Grimes R.G., Lewis J.G., Simon H.D. Boeing Computer Services; Seattle, WA: 1991. A Shifted Block Lanczos Algorithm for Solving Sparse Symmetric Eigenvalue Problems. [Google Scholar]
- 34.Case D.A., Darden T.A., Cheatham T.E.I., Simmerling C.L., Wang J. University of California; San Francisco: 2004. AMBER, Version 8. [Google Scholar]
- 35.Case D.A., Cheatham T.E., Darden T., Gohlke H., Luo R. The AMBER biomolecular simulation programs. J. Comput. Chem. 2005;26:1668–1688. doi: 10.1002/jcc.20290. [DOI] [PMC free article] [PubMed] [Google Scholar]
- 36.Duan Y., Wu C., Chowdhury S., Lee M.C., Xiong G. A point-charge force field for molecular mechanics simulations of proteins. J. Comput. Chem. 2003;24:1999–2012. doi: 10.1002/jcc.10349. [DOI] [PubMed] [Google Scholar]
- 37.Hawkins G.D., Cramer C.J., Truhlar D.G. Pairwise solute descreening of solute charges from a dielectric medium. Chem. Phys. Lett. 1995;246:122–129. [Google Scholar]
- 38.Hawkins G.D., Cramer C.J., Truhlar D.G. Parametrized models of aqueous free energies of solvation based on pairwise descreening of solute atomic charges from a dielectric medium. J. Phys. Chem. 1996;100:19824–19839. [Google Scholar]
- 39.Srinivasan J., Trevathan M.W., Beroza P., Case D.A. Application of a pairwise generalized Born model to proteins and nucleic acids: inclusion of salt effects. Theor. Chem. Acc. 1999;101:426–434. [Google Scholar]
- 40.Berman H.M., Westbrook J., Feng Z., Gilliland G., Bhat T.N. The Protein Data Bank. Nucleic Acids Res. 2000;28:235–242. doi: 10.1093/nar/28.1.235. [DOI] [PMC free article] [PubMed] [Google Scholar]
- 41.Zhang Z., Sugio S., Komives E.A., Liu K.D., Knowles J.R. Crystal structure of recombinant chicken triosephosphate isomerase-phosphoglycolohydroxamate complex at 1.8 Å resolution. Biochemistry. 1994;33:2830–2837. doi: 10.1021/bi00176a012. [DOI] [PubMed] [Google Scholar]
- 42.Knowles J.R. Enzyme catalysis: not different, just better. Nature. 1991;350:121–124. doi: 10.1038/350121a0. [DOI] [PubMed] [Google Scholar]
- 43.Desamero R., Rozovsky S., Zhadin N., McDermott A., Callender R. Active site loop motion in triosephosphate isomerase: T-jump relaxation spectroscopy of thermal activation. Biochemistry. 2003;42:2941–2951. doi: 10.1021/bi026994i. [DOI] [PubMed] [Google Scholar]
- 44.Xiang J., Jung J., Sampson N.S. Entropy effects on protein hinges: the reaction catalyzed by triosephosphate isomerase. Biochemistry. 2004;43:11436–11445. doi: 10.1021/bi049208d. [DOI] [PubMed] [Google Scholar]
- 45.Guallar V., Jacobson M., McDermott A., Friesner R.A. Computational modeling of the catalytic reaction in triose phosphate isomerase. J. Mol. Biol. 2004;337:227–239. doi: 10.1016/j.jmb.2003.11.016. [DOI] [PubMed] [Google Scholar]
- 46.Waley S.G. Refolding of triose phosphate isomerase. Biochem. J. 1973;135:165–172. doi: 10.1042/bj1350165. [DOI] [PMC free article] [PubMed] [Google Scholar]
- 47.Zabori S., Rudolph R., Jaenicke R. Folding and association of triosephosphate isomerase from rabbit muscle. Z. Naturforsch. C. 1980;35C:999–1004. doi: 10.1515/znc-1980-11-1224. [DOI] [PubMed] [Google Scholar]
- 48.Sampson N.S., Knowles J.R. Segmental movement: definition of the structural requirements for loop closure in catalysis by triosephosphate isomerase. Biochemistry. 1992;31:8482–8487. doi: 10.1021/bi00151a014. [DOI] [PubMed] [Google Scholar]
- 49.Ban N., Nissen P., Hansen J., Moore P.B., Steitz T.A. The complete atomic structure of the large ribosomal subunit at 2.4 A resolution. Science. 2000;289:905–920. doi: 10.1126/science.289.5481.905. [DOI] [PubMed] [Google Scholar]
- 50.Yoshizawa S., Fourmy D., Puglisi J.D. Recognition of the codon-anticodon helix by ribosomal RNA. Science. 1999;285:1722–1725. doi: 10.1126/science.285.5434.1722. [DOI] [PubMed] [Google Scholar]
- 51.Yusupova G., Jenner L., Rees B., Moras D., Yusupov M. Structural basis for messenger RNA movement on the ribosome. Nature. 2006;444:391–394. doi: 10.1038/nature05281. [DOI] [PubMed] [Google Scholar]
- 52.Wahl M.C., Bourenkov G.P., Bartunik H.D., Huber R. Flexibility, conformational diversity and two dimerization modes in complexes of ribosomal protein L12. EMBO J. 2000;19:174–186. doi: 10.1093/emboj/19.2.174. [DOI] [PMC free article] [PubMed] [Google Scholar]
- 53.Tama F., Valle M., Frank J., Brooks C.L. Dynamic reorganization of the functionally active ribosome explored by normal mode analysis and cryo-electron microscopy. Proc. Natl. Acad. Sci. USA. 2003;100:9319–9323. doi: 10.1073/pnas.1632476100. [DOI] [PMC free article] [PubMed] [Google Scholar]
- 54.Trylska J., Tozzini V., McCammon J.A. Exploring global motions and correlations in the ribosome. Biophys. J. 2005;89:1455–1463. doi: 10.1529/biophysj.104.058495. [DOI] [PMC free article] [PubMed] [Google Scholar]
- 55.Poon B.K., Chen X., Lu M., Vyas N.K., Quiocho F.A. Normal mode refinement of anisotropic thermal parameters for a supramolecular complex at 3.42-A crystallographic resolution. Proc. Natl. Acad. Sci. USA. 2007;104:7869–7874. doi: 10.1073/pnas.0701204104. [DOI] [PMC free article] [PubMed] [Google Scholar]
- 56.Amadei A., Ceruso M.A., Nola A.D. On the convergence of the conformational coordinates basis set obtained by the essential dynamics analysis of proteins' molecular dynamics simulations. Proteins. 1999;36:419–424. [PubMed] [Google Scholar]
- 57.Lu M., Ma J. The role of shape in determining molecular motions. Biophys. J. 2005;89:2395–2401. doi: 10.1529/biophysj.105.065904. [DOI] [PMC free article] [PubMed] [Google Scholar]
- 58.Williams J.C., McDermott A.E. Dynamics of the flexible loop triosephosphate isomerase; The loop motion is not ligand gated. Biochemistry. 1995;34:8309–8319. doi: 10.1021/bi00026a012. [DOI] [PubMed] [Google Scholar]
- 59.Lovell S.C., Davis I.W., Arendall W.B., de Bakker P.I.W., Word J.M. Structure validation by C-alpha geometry: phi, psi and C-beta deviation. Proteins. 2003;50:437–450. doi: 10.1002/prot.10286. [DOI] [PubMed] [Google Scholar]
- 60.Davis I.W., Leaver-Fay A., Chen V.B., Block J.N., Kapral G.J. MolProbity: all-atom contacts and structure validation for proteins and nucleic acids. Nucleic Acids Res. 2007;35:W375–W383. doi: 10.1093/nar/gkm216. [DOI] [PMC free article] [PubMed] [Google Scholar]
- 61.Agrawal R.K., Heagle A.B., Penczek P., Grassucci R.A., Frank J. EF-G-dependent GTP hydrolysis induces translocation accompanied by large conformational changes in the 70S ribosome. Nat. Struct. Biol. 1999;6:643–647. doi: 10.1038/10695. [DOI] [PubMed] [Google Scholar]
- 62.Lata K.R., Agrawal R.K., Penczek P., Grassucci R., Zhu J. Three-dimensional reconstruction of the Escherichia coli 30 S ribosomal subunit in ice. J. Mol. Biol. 1996;262:43–52. doi: 10.1006/jmbi.1996.0497. [DOI] [PubMed] [Google Scholar]
- 63.Ogle J.M., Murphy F.V., Tarry M.J., Ramakrishnan V. Selection of tRNA by the ribosome requires a transition from an open to a closed form. Cell. 2002;111:721–732. doi: 10.1016/s0092-8674(02)01086-3. [DOI] [PubMed] [Google Scholar]
- 64.Agrawal R.K., Linde J., Sengupta J., Nierhaus K.H., Frank J. Localization of L11 protein on the ribosome and elucidation of its involvement in EF-G dependent translocation. J. Mol. Biol. 2001;311:777–787. doi: 10.1006/jmbi.2001.4907. [DOI] [PubMed] [Google Scholar]
- 65.Valle M., Zavialov A., Sengupta J., Rawat U., Ehrenberg M. Locking and unlocking of ribosomal motions. Cell. 2003;114:123–134. doi: 10.1016/s0092-8674(03)00476-8. [DOI] [PubMed] [Google Scholar]
- 66.Carter A.P., Clemons W.M., Brodersen D.E., Morgan-Warren R.J., Wimberly B.T. Functional insights from the structure of the 30S ribosomal subunit and its interactions with antibiotics. Nature. 2000;407:340–348. doi: 10.1038/35030019. [DOI] [PubMed] [Google Scholar]
- 67.Sutcliffe J.A. Improving on nature: antibiotics that target the ribosome. Curr. Opin. Microbiol. 2005;8:534–542. doi: 10.1016/j.mib.2005.08.004. [DOI] [PubMed] [Google Scholar]
Associated Data
This section collects any data citations, data availability statements, or supplementary materials included in this article.