

Abstract
Ripley's K-, H-, and L-functions are used increasingly to identify clustering of proteins in membrane microdomains. In this approach, aggregation (or clustering) is identified if the average number of proteins within a distance r of another protein is statistically greater than that expected for a random distribution. However, it is not entirely clear how the function may be used to quantitatively determine the size of domains in which clustering occurs. Here, we evaluate the extent to which the domain radius can be determined by different interpretations of Ripley's K-statistic in a theoretical, idealized context. We also evaluate the measures for noisy experimental data and use Monte Carlo simulations to separate the effects of different types of experimental noise. We find that the radius of maximal aggregation approximates the domain radius, while identifying the domain boundary with the minimum of the derivative of H(r) is highly accurate in idealized conditions. The accuracy of both measures is impacted by the noise present in experimental data; for example, here, the presence of a large fraction of particles distributed as monomers and interdomain interactions. These findings help to delineate the limitations and potential of Ripley's K in real-life scenarios.
Introduction
The lipid raft hypothesis has led to intense interest in techniques capable of distinguishing clustered distributions of molecules in membranes (1). Growing evidence using such approaches suggests that proteins enriched in microdomains exist as small clusters present in a background of monomers (2,3). Because of the inherent difficulty in distinguishing such small clusters from a random distribution, mathematical tools have become increasingly utilized to extract information such as domain size and area fraction. One such tool is the Ripley's K-function, used currently to analyze the distribution of immunolabeled proteins within membrane sheets as detected by electron microscopy (2,4–9).
The distribution of labeled molecules in such an experiment represents a spatial point pattern. The first moment property of a spatial point pattern is the number of points per area and the second moment property is the expected number of points N within a distance r of another point. Ripley's K-function (10) is the second moment property normalized by the density (or intensity), the number of points per area λ:
| (1) |
where pi is the ith point and the sum is taken over n points. The expected value of K(r) for a random Poisson distribution is πr2 and deviations from this expectation indicate scales of clustering and dispersion.
The K-function can be normalized as proposed by Besag (11) so that its expected value is r (linear):
| (2) |
The K-function can be further normalized so that the expected value is 0, yielding the so-called H-function (12):
| (3) |
Ripley's K-function is typically used to compare a given point distribution with a random distribution; i.e., the point distribution under investigation is tested against the null hypothesis that the points are distributed randomly and independently. For example, a positive value of H(r) indicates clustering over that spatial scale whereas a negative value indicates dispersion. Although it is common to use a significantly positive value of H(r) to identify clustering (4,8,12–18), some recent publications have further sought to use the maximum of H(r) to provide a measure of domain radius (5–7). The value of r that maximizes H(r) indicates the radius of maximal aggregation: the radius of a disk in which a centered test point on average contains the most points per area. However, it is not clear that the radius of maximal aggregation would coincide with the domain radius and the difficulty of using Ripley's K to identify the radius of point aggregation has been emphasized by several authors (7,19–21). We therefore tested the ability of this measure to accurately report on domain radius in idealized conditions. We find that for well-separated domains of a radius R, the radius of maximal aggregation varies between R and 2R. We show the domain radius may be more precisely identified by finding the domain boundary where the point density drops. These theoretical conclusions provide a useful understanding of the limitations and potential of Ripley's K in a best case scenario. We also evaluate the measures for noisy experimental data and use Monte Carlo simulations to separate the effects of different types of experimental noise.
Methods
Modeling idealized disk-shaped domains
We considered a distribution of idealized domains of radius R separated by a distance S (Fig. 1 A) where S is the distance between adjacent domain centers. Domains were drawn on a square lattice where each lattice node corresponds to a 1 nm × 1 nm area. In each Monte Carlo realization of a point pattern, lattice nodes were randomly assigned “probes” at a density of 0.05 probes nm−2, yielding a 5% occupation of the lattice nodes within domains. When indicated, nodes outside domains were populated at a density of 1 × 10⁻³ probes nm−2 to simulate a monomer fraction. Fig. 1 B shows one random snapshot of a lattice with domain probes populated at a density of 0.05 nm−2 and nondomain probes populated at a density of 1 × 10⁻³ probes nm−2. We only considered values of S ≥ 4R so that adjacent domains were separated by at least one domain diameter.
Figure 1.
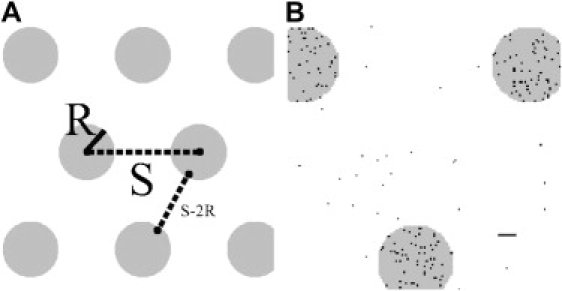
Distribution of idealized domains and distribution of points. (A) Disk-shaped domains of radius R are tiled on a square lattice in a triangular pattern with periodic boundary conditions. The distance between the centers of any two adjacent domains is S. The distance between neighboring domain edges is S − 2R. (B) A random snapshot of a distribution of points (black pixels) with density 0.05 nm−2 within domains and 0.001 nm−2 outside of domains. The horizontal bar indicates 10 nm. Domains have radius R = 20 nm and are separated by S = 120 nm.
Modeling K-ras nanoclusters
In recent experiments (2,17), point patterns of the distribution of the protein Ras on the plasma membrane have been obtained by immunoelectron microscopy. Analyses of the point patterns in (2,17) indicated that Ras associates with nanoclusters that have a constant size (∼16 nm) and coexist with randomly arrayed monomeric protein. The ratio of clustered to monomeric protein was found to be constant over a multilog range of expression, suggesting that the fraction of clustered molecules is maintained by an active process (3,17). On average, it was found that each nanocluster contained 3.2 gold particles, and the monomer population was ∼56%. Where indicated, a Monte Carlo model was used to simulate these immunogold point patterns. Domains with a radius of 16 nm were placed on a 500 × 500 square lattice where each lattice node corresponded to 1 nm2 area. The density of immunogold particles was allowed to vary from 400 to 1200 particles per 1000 nm × 1000 nm. In the experimental model 44% of the particles were arrayed in nanoclusters with a stoichiometry of 3.2 gold particles per nanocluster. Thus, for a given number of immunogold particles N, the nearest whole number of 0.44 × N/3.2 domains were assigned to the lattice. Nanoclusters were arrayed randomly over the model membrane, subject to the constraints that they could not overlap and must be completely contained within the lattice. The N particles were then randomly assigned to domain nodes and nondomain nodes in a 0.44:0.56 ratio. Where indicated, we modified the point pattern in three ways. First, we allowed the domain size to vary from 6 to 16 nm. In the case of no monomer fraction, all the nondomain particles were deleted. In the case of no domain interaction, domains were randomly assigned subject to the constraint that they were separated by a distance 4R from each other and 2R from the domain boundary.
Computing Ripley's H and H′ functions
Without regard to whether points are located within or outside domains, Ripley's K-statistic is computed for all points on the lattice. Periodic boundary conditions are used to obviate edge effects. The periodic extension for the idealized point patterns is seamless because domains are arranged in a triangular pattern. While generating point patterns that simulate K-ras nanoclusters, we require that domains are completely contained within the lattice so that there are no broken or overlapping domains when the lattice pattern is tiled. The derivative of the H-function is computed from the H-function at each value of r nm by taking the average derivative of H over the interval [r − 1 nm, r + 1 nm], which resulted in a sufficiently smooth function.
Results
Comparing the radius of maximal aggregation with the domain radius in distributions of idealized, disk-shaped domains
To investigate the relationship between H(r) and the domain radius, we evaluated H(r) for the case of an idealized point pattern in which points are aggregated within well-separated, disk-shaped domains of radius R and separation S (Fig. 1 A). Domains were drawn on a square lattice. Lattice nodes were randomly assigned “probes” at a density of 0.05 probes nm−2. We only considered values of S ≥ 4R so that adjacent domains were separated by at least one domain diameter. As expected, for this idealized case, H(r) was positive over the interval [0, S/2] for the aggregated distribution, indicating clustering over that interval (Fig. 2 A, solid black line). In contrast, applying H(r) to a Poisson distribution yields a constant value of H(r) of zero, consistent with the absence of clustering (Fig. 2 A, dotted line).
Figure 2.
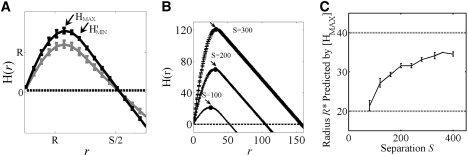
Using Ripley's H-function to identify domain radius. (A) H(r) for a random (Poisson) distribution (dotted line), points entirely clustered within 25 domains of radius R = 20 nm separated by S = 100 nm (black solid line), or points clustered in domains in the presence of a monomer fraction (gray solid line). The arrow labeled “HMAX” indicates where H(r) is maximized and the arrow labeled “H′MIN” indicates where the slope of H(r) is first −1 for the entirely clustered distribution. To simulate a monomer fraction, nodes outside domains were populated at a density of 1 × 10⁻³ probes nm−2. (B) H(r) calculated for three distributions containing 25 domains with a constant domain radius of 20 nm but varied domain separation (100, 200, or 300 nm). Note that the magnitude and position of [HMAX] shifts systematically with the domain separation (solid black circles indicated by arrows). (C) The domain radius R∗ predicted by [HMAX] as a function of the domain separation. The domain radius and diameter are indicated by the dashed gray lines at 20 nm and 40 nm, respectively. Data represent the mean ± SD for five independent point distributions containing 25 domains of radius R = 20 nm.
In previous studies, the value yielding the maximum of H(r) was used to provide a measure of domain radius (5–7). Here, we will denote this as the radius of maximal aggregation R∗ = [HMAX], where the brackets indicate the value of r that yields the maximum value (an inverse operation). For the example shown in Fig. 2 A, we found that R∗ = 25 ± 1 nm was slightly larger than the actual value of R = 20 nm. We considered the possibility that the difference between the actual domain radius and that predicted by [HMAX], arises because K, H, and L are accumulative functions, meaning that effects at larger distances are confounded with those at smaller distances. The functions are accumulative because for each value of r, Ripley's K considers the number of points within a radius r, so that the points within smaller radii will always be included.
To further study how accumulative effects impact the relationship between R∗ and the actual domain radius, we calculated H(r) for idealized distributions in which the domain radius was held constant but the interdomain separation was varied (Fig. 2, B and C). Examples of plots of H(r) for three different values of S are shown in Fig. 2 B. This analysis revealed that as the interdomain separation was increased, the radius of maximal aggregation shifted to progressively larger radii. We repeated this calculation for a range of values of S and calculated the radius of maximal aggregation [HMAX] for each case (Fig. 2 C). As shown in Fig. 2 C, the domain radius R∗ predicted by [HMAX] monotonically increases from the domain radius R to the domain diameter 2R as the separation is increased from 4R to arbitrarily large values. We evaluated the radius of maximal aggregation predicted as S → ∞ by applying Ripley's K to a single domain without periodic boundary conditions, and found that [HMAX] approaches 2R.
This dependence of [HMAX] on S can be understood by recalling that the H-function compares the observed density within a test radius with the expected density in a Poisson distribution. The critical point of H(r) (where H′ = 0) is located where aggregation effects within the domain are perfectly canceled out by dispersion outside the domain. When domains are the same size but the domain separation is larger, aggregation of points is actually greater because points are aggregated within a relatively smaller area. (This is indicated by the fact that the maximum value of H(r) increases with S). The extent of aggregation relative to the total area between domains increases and a greater area is required to offset that aggregation. Nevertheless, although the radius of maximal aggregation does not exactly correspond to the domain radius, even in this idealized scenario, it is encouraging that [HMAX] estimates the domain radius within a factor of 2.
Using the derivative to subtract accumulative effects
Given that the location of maximal aggregation given by [HMAX] does not measure the domain radius precisely, we asked if another measure may yield the domain radius. With regard to this issue, Weigand and Moloney (21) have noted that although the K-function may be used to detect the spatial range of repulsive and attractive effects, functions based on the derivative of the K-function should be used to describe the extent of aggregation at a particular distance. This is the case because the rate of change of a function does not depend on the function's magnitude, and thus is not affected by accumulative effects (21). We therefore tested the use of the derivative of H(r) to subtract accumulative effects.
To test this, we calculated H′(r) versus r for the same three simulations shown in Fig. 2 B. Although all the curves of H′(r) intersect the x axis in different locations, each intersects the line y = −1 at the same radius of r = 2R (Fig. 3 A). This suggests that the point at which the derivative of H(r) is equal to −1 can provide a measure of the domain radius that is independent of accumulative effects. To test this further, we calculated the value of r where H′(r) is −1 for idealized domains with a constant domain radius for a range of domain separations (Fig. 3 B). We found that a plot of the value of r where H′(r) = −1 accurately predicts the domain radius even as the domain separation is varied (Fig. 3 B). Thus, the minimum value of r that yields H′(r) = −1, divided by 2, accurately yields the domain radius independent of the domain separation for the case of idealized domains. For the remainder of this study, we will denote the domain radius indicated by the minimum of H′(r) as R∗ = [H′MIN], where again the brackets indicate the value of r that yields the minimum.
Figure 3.
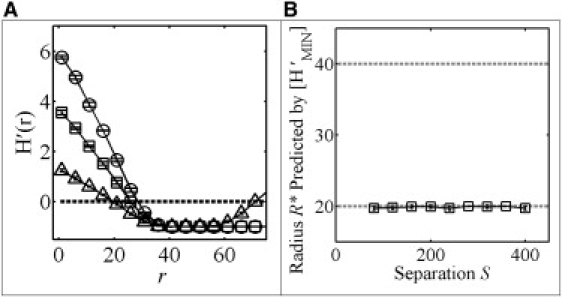
Taking the derivative of H(r) removes accumulative effects. (A) H′(r) calculated for idealized distributions containing 25 domains with radius R of 20 nm for three different values of domain separation S: 100 nm (open triangles), 200 nm (open squares), or 300 nm (open circles). (B) The domain radius R∗ predicted by [H′MIN] (squares) as a function of the domain separation. The domain radius and diameter are indicated by the dashed gray lines at 20 nm and 40 nm, respectively. In both panels, data represent the mean ± SD for five independent point distributions containing 25 domains of radius R = 20 nm.
The finding that the domain radius is indicated where the derivative of H(r) is −1 independent of accumulative effects is intriguing given that radius of maximal aggregation [HMAX], occurs when the derivative of H(r) is 0. To better understand why the domain radius is predicted in this way, we considered the L-function, which has a precise geometric interpretation: for a given radius r, L(r) is the radius within which the number of points would be distributed if the distribution was completely random. Thus, the expected value of L(r) for the Poisson distribution is r (Fig. 4 A, dotted line). L(r) of a distribution in which points are aggregated within domains of radius R and separation S is greater than that of the Poisson distribution over the interval [0, S/2], indicating clustering over that interval (Fig. 4 A, solid black line).
Figure 4.
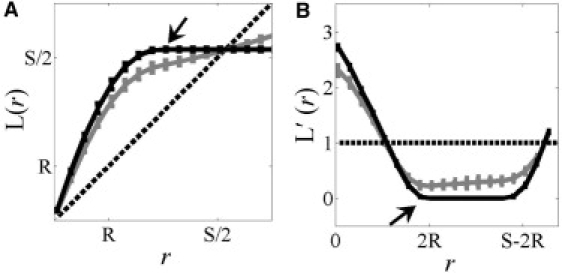
Using Ripley's L-function and its derivative to identify domain radius. (A) L(r) and (B) L′(r) for a random (Poisson) distribution (dotted line), points entirely clustered within domains (black solid line), or points clustered in domains in the presence of a monomer fraction (gray solid line). The arrow indicates where the slope of L(r) is first 0 for the entirely clustered distribution. Data represent the mean ± SD for five independent point distributions containing 25 domains of radius R = 20 nm and separation S = 60 nm. To simulate a monomer fraction, nodes outside domains were populated at a density of 1 × 10⁻³ probes nm−2.
Importantly, L(r) is an increasing function of r as long as the number of points found within a radius r is increasing with r, and stops increasing when the density of points outside a radius r is zero for all test points. In other words, the derivative of L(r), L′(r), is always ≥0. L′(r) will be positive as long as the number of points found within a radius r is increasing with r, and zero when the density of points outside a radius r is zero (Fig. 4 B, solid black line). For the case where points are fully aggregated within domains of radius R, the distance between any two points within the same domain will be less than or equal to the diameter 2R, and the density of points outside domains will be zero until the next domain is reached. Because the distance between domain boundaries is S − 2R (Fig. 1), L(r) has a zero slope over the interval [2R, S − 2R] (Fig. 4 B). Thus, the domain diameter is indicated when L′(r) is first zero (Fig. 4 B, arrow). When L(r) has a derivative of 0, the derivative of H(r) is −1 because H(r) and L(r) only differ by the term −r.
Effect of a monomer fraction in the case of idealized domains
The geometric arguments above apply to idealized distributions in which points are distributed entirely within domains and no monomer fraction is present. However, an important feature of Ripley's K is its application to distributions in which there may be a number of points randomly distributed outside domains. We therefore next tested how the presence of a monomer fraction impacts the ability of H(r) and L′(r) to predict domain radius. For this analysis, we considered the effect of adding monomers to nodes outside domains at a density of 1 × 10⁻³ probes/nm2. The relative abundance of monomers outside domains to probes within domains is shown in Fig. 1 B. For these point patterns in which the density of probes outside domains was now nonzero, we found that the position of the maximum of H(r) was unaffected (Fig. 2 A), but that L′(r) did not go to zero (Fig. 4 B, solid gray line). However, the value of r that minimizes L′(r) still yields the domain radius (Fig. 4 B). Thus, both measures seem to be relatively insensitive to the presence of a monomer fraction under these conditions. We note that our point patterns assume randomly placed monomers distributed at a constant density outside domains. In irregular distributions in which the monomer density fluctuates nonrandomly outside domains, using this method to identify the domain radius would be biased by this second level of aggregation/ordering.
Comparing the predictions of the maximum of H(r) and the minimum of H′(r)
Our analysis of idealized domains indicates that the maximum of H(r) and minimum of H′(r) have different dependencies on domain separation. In particular, the maximum of H(r) yields the radius of maximal aggregation, which depends on the domain separation, whereas the minimum of H′(r) yields the domain radius independent of the domain separation. We therefore considered the possibility that the ratio of [HMAX] and [H′MIN] could provide information regarding the domain separation. To test this, we calculated the ratio [HMAX]/[H′MIN] versus the domain separation for domain separations ranging from 4R (80 nm) to 20R (400 nm) (Fig. 5). Under these conditions, the ratio [HMAX]/[H′MIN] increased monotonically from ∼1 to ∼2. To determine if this ratio was dependent on the domain radius, we carried out a similar calculation for three different domain radii (20, 30, and 40 nm). The ratio [HMAX]/[HupMIN] versus domain separation was the same for three different domain radii when the domain separation was normalized by the domain radius (Fig. 5). This suggests that the parameter [HMAX]/[HupMIN] can be used to measure domain separation, an additional defining feature of a given particle distribution.
Figure 5.
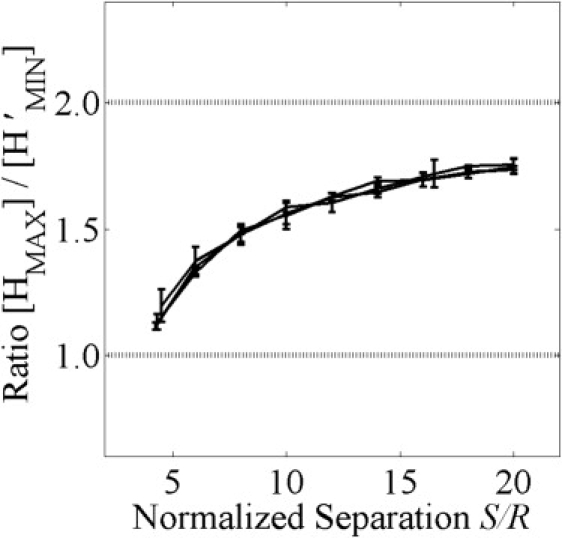
Ratio [HMAX]/[H′MIN] increases monotonically with the domain separation. The ratio [HMAX]/[H′MIN] versus the separation S is the same for three different domain radii if the domain separation is normalized by the domain radius R. The domain radii are 20 nm, 30 nm, and 40 nm for the three plots shown, indistinguishable within error. Data represent the mean ± SD for five independent point distributions containing 25 domains of radius R = 20 nm.
Application to experimentally measured domains: K-ras nanoclusters
The above results apply to idealized distributions in which points are distributed randomly within idealized domains. However, an important application of Ripley's K is the analysis of experimentally determined distributions in which there may be significant sources of noise. For example, Ripley's K-analysis has been used recently to analyze experimental measurements of the distribution of the protein Ras on the plasma membrane by immunoelectron microscopy (2,17). Previous analyses using [HMAX] as a reporter of domain radius indicated that Ras associates with nanoclusters that have a constant size (∼16 nm) and coexist with randomly arrayed monomeric protein. The ratio of clustered to monomeric protein was found to be constant over a multilog range of expression, suggesting that the fraction of clustered molecules is maintained by an active process (3,17). On average, each nanocluster contained 3.2 gold particles, and the monomer population was ∼56%.
To evaluate the use of H(r) and H′(r) in estimating the radius of experimentally determined Ras nanoclusters, we estimated the nanocluster radius for an immunogold point pattern of K-ras proteins on intact plasma membrane sheets from data published previously (17). The experimentally determined point pattern used is shown in Fig. 6 A. In this measurement, the labeled K-ras density was 625 gold particles per μm2. Using [HMAX], the K-ras nanocluster radius was estimated as 16 nm, whereas the K-ras nanocluster radius was estimated as 14 nm from [H′MIN]. Thus, the two measures yield similar, but not identical estimates of the K-ras nanocluster radius for this experimentally measured particle distribution.
Figure 6.
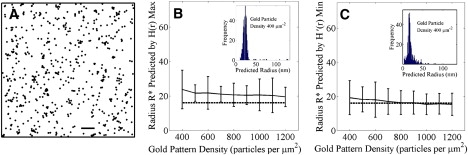
Nanocluster radius for Monte Carlo simulations of K-ras nanoclusters as a function of pattern density. (A) Example of an experimentally derived point pattern with an immunogold density of 625 μm−2. Data are representative of those collected for K-ras in Plowman et al. (17). Scale bar = 100 nm. (B and C) Radii calculated for 500 simulated point patterns mimicking K-ras nanoclusters. The dashed line shows the actual domain radius (16 nm) whereas the solid line shows the mean and SD of Ripley's calculations for (B) the radius calculated using the max value of H(r), or (C) the radius calculated using the min value of H′(r). Histograms (insets) show the distribution of individual simulation predictions when the gold pattern density is 400 particles/μm2.
Next, we asked if the values of domain radius reported by [HMAX] and [H′MIN] varied as a function of the density of K-ras particles under conditions similar to those observed experimentally assuming that the domain radius did not vary. To evaluate this, we used a Monte Carlo model that generates immunogold point patterns analogous to labeling K-ras proteins on plasma membrane sheets (see Methods). These patterns contain two types of noise not present in our idealized model (Fig. 1). First, there is a constant monomer fraction (56% of K-ras proteins are distributed randomly outside nanoclusters regardless of the overall particle density). Second, the separations between domains are random (domains may not overlap but they may approach arbitrarily close).
We generated 500 immunogold point patterns incorporating these two sources of noise for each of nine different pattern densities chosen to correspond to the range of particle densities that were measured experimentally. All domains in the patterns have a fixed radius of 16 nm, which is thus the correct radius to report. For each pattern we calculated [HMAX] (Fig. 6 B) and [H′MIN] (Fig. 6 C). Both measures predict the domain radius within the mean standard deviation (SD); however, as shown in the histogram of individual predictions (insets), individual results vary widely and predictions for a single point pattern can be several orders of magnitude larger than the domain radius. Nevertheless, both methods perform relatively well on average in estimating domain radius of nanoclustered patterns, so that increased reliability may be gained as multiple point patterns are evaluated.
Unexpectedly, both [HMAX] and [H′MIN] showed little dependence on particle density. The absence of a strong dependence of [HMAX] on pattern density was particularly surprising considering the results obtained from our initial simulations (Fig. 2 C), which predicted that [HMAX] should increase as the average separation between clusters increases. Instead, the ratio of the radii predicted by [HMAX] and [H′MIN] did not vary systematically with the particle density, but was essentially constant, with a mean value of 1.25 and a SD of 0.05. According to Fig. 5, the estimated domain separation should correspond to 5.5R ± 0.5, or 88 ± 8 nm, for this value of [HMAX]/[H′MIN]. However, it is clear from direct inspection of the point patterns that the domain separations systematically vary with the point density, decreasing from ∼85 nm to 50 nm as the particle density increases from 400 to 1200 particles per μm2. Thus, the results of our Monte Carlo simulations indicate that domain separation cannot be predicted using the ratio of [HMAX] to [H′MIN] because the ratio does not vary with the domain separation in this noisier scenario.
Systematic evaluation of the two noise sources in experimentally derived data
To understand why the behavior of [HMAX] seemed to be independent of accumulative effects for the case of simulated K-ras nanoclusters, we next systematically evaluated the individual contributions of the two sources of noise to these data, the presence of a monomer fraction and random domain positions. Although our previous analysis suggested that the monomer fraction should not be a major source of noise (Figs. 2 A and 4 B), we wanted to verify this for biologically relevant distributions. In addition, when domain separations vary randomly, some domain separations may be smaller than 4R. When this occurs, the distance between domains (from edge to edge) may be less than the domain diameter and points at the edge of a domain are just as close to points in another domain as they are to points within their own domain. We define this as domain interaction.
We evaluated the performance of Ripley's K with or without these two sources of noise independently in Fig. 7. For this analysis, we generated point distributions in the same way as in the simulations in Fig. 6, B and C, except that in this case we systematically varied the domain radius while holding the particle density constant at 625 particles per 1000 nm × 1000 nm. The number of particles per domain and ratio of clusters/monomers was identical to those used in Fig. 6. These simulations thus contain a monomer fraction and have varied domain separations, similar to the known sources of noise in the experimentally based (17) distributions analyzed in Fig. 6. For each case studied, we calculated both [HMAX] and [H′MIN] and compared these to the actual domain size (Fig. 7, dotted lines).
Figure 7.
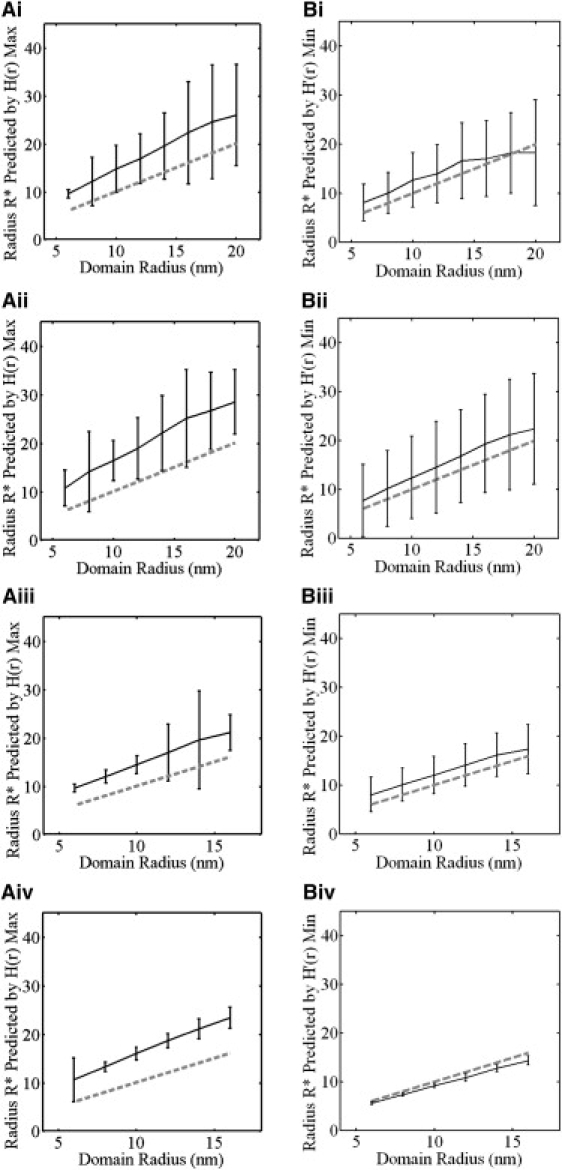
Analysis of the contribution of monomer fraction and domain interaction to estimates of K-ras domain radius obtained from [HMAX] or [H′MIN]. Simulated point patterns were generated as in Fig. 6 except that the domain radius was systematically varied from 6 nm to 16 or 20 while holding the particle density constant at 612 particles per 1000 nm × 1000 nm. The domain radius was calculated using the max value of H(r) (A panels) or using the minimum values of H′(r) (B panels). Monte Carlo point patterns were generated with both noise sources (Ai and Bi), with domain interaction but no monomer fraction (Aii and Bii), with a monomer fraction but without domain interaction (Aiii and Biii) and without either a monomer fraction or domain interaction (Aiv and Biv). The dotted line shows the actual domain radius, whereas the solid line with error bars shows the mean radius and SD of 500 point patterns.
We first calculated the predicted radii in the presence of both sources of noise (Fig. 7, Ai and Bi). The predicted domain radius was consistent with the actual domain radius within error for both [HMAX] and [H′MIN]. However, the noise did not allow a precise prediction of the domain radius because the SD was very large. Thus in the presence of both a monomer fraction and varied domain separation, the two measures perform equally well and are not distinguishable.
We next evaluated the contribution of domain interaction to the noise in the domain radius prediction. To examine this, the monomer fraction was removed from the Monte Carlo-generated point patterns by deleting all points outside domains. We found that when only domain interactions are present, the predictions of both [HMAX] and [H′MIN] were still very noisy (Fig. 7, Aii and Bii). In fact, the predictions from [H′MIN] were even noisier (i.e., the error was larger) under these conditions than in the presence of both domain interaction and a monomer fraction (compare Fig. 7, Bi and Bii). This indicates that domain interaction is a significant source of noise for both measures. Geometrically, this can be understood as occurring because domains that approach within a distance of 4R are interpreted by both measures as a single domain.
We next tested how the monomer fraction contributes to the variation in the measurements of domain radius by removing interacting domains (Fig. 7, Aiii and Biii). To remove domain interaction, we required that the domain separation be at least 4R (rather than 2R when domains just cannot overlap). Because the domains must be spaced further apart to eliminate domain interaction, it is more difficult to generate point patterns that satisfy these constraints at high point densities. We thus only evaluated domain sizes from 6 nm to 16 nm. The results of this analysis show that both measures are fairly robust to the effects of the monomer fraction because much of the error in their predictions is removed (Fig. 7, Aiii and Biii). For some values of the domain radius, the confidence interval of [HMAX] was narrower than that of [H′MIN], indicating that [HMAX] is a more reliable measure in these cases.
Finally, we removed both domain interactions and the monomer fraction from the simulated K-ras data (Fig. 7, Aiv and Biv). Without either type of noise present, the results were largely consistent with that of our idealized scenario: [H′MIN] yielded the correct domain radius, whereas the radius predicted by [HMAX] was somewhat larger (Fig. 7, Aiv and Biv). Note that the [H′MIN] prediction typically underestimates the domain radius, but never overestimates it. This is due to the density of only 3.2 particles per domain, as in some point realizations there may be no points at the very edge of the domain.
These findings suggest that the reason that Fig. 6, B and C, look similar, and there is no strong dependence of [HMAX] on density for experimentally based domains, is because they are skewed from their ideal value by domain-domain interaction, and to a lesser extent, the monomer fraction. When this noise is subtracted by taking away the monomer fraction and domain-domain interaction, the results are consistent with our theoretical results.
The effect of varying the monomer fraction
An interesting feature of the distribution of K-ras observed in Prior et al. (2) and Plowman et al. (17) is that the ratio of clustered to monomeric protein was found to be constant over a multilog range of expression. Above, we considered the effect of the monomeric protein on the ability of [HMAX] and [H′MIN] to predict the domain radius when the ratio of monomers to domain probes is 56:44, as observed in this experiment. In a general context however, the ratio of monomers to domain probes may vary with the density of probes and, moreover, it is unlikely that this ratio will be known a priori. To further investigate the effect of a monomer fraction on the Ripley's K-statistic, we studied the effect of increasing the monomer fraction while the number of probes within domains was held constant. In particular, we looked at the radii predicted by [HMAX] and [H′MIN] as the monomer fraction was increased systematically from 20% to 80%. Statistically significant aggregation (with 99% confidence) was identified if the extent of aggregation measured by the maximum value of H(r) is greater than the maximum value of H(r) measured for 100 random point distributions of the same point density.
By this criterion, we found that at very high monomer fractions, it became increasingly difficult for the statistic to identify aggregation. As the monomer fraction was increased in our simulations, statistically significant aggregation was identified in fewer and fewer point patterns (the fraction is indicated above each data point in Fig. 8, A and B). For monomer fractions of 0.8 and 0.9, the percentage of patterns with statistically significant aggregation was 50% and 16%, respectively. We therefore used Ripley's K-statistic to predict a domain radius only in point patterns where statistically significant aggregation was observed. Thus, the mean and SD of the radii predicted by [HMAX] and [H′MIN] shown in Fig. 8, A and B, are restricted to the subset of point patterns in which aggregation was observed.
Figure 8.
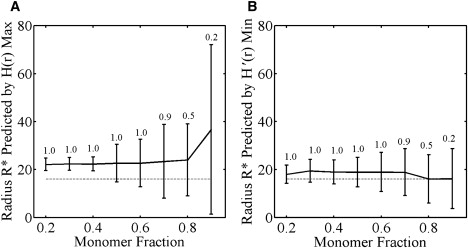
Ripley's-K predictions as the monomer fraction is varied. Ripley's calculations of domain radii for 500 simulated point patterns with a particle density of 400 particles/μm2, 3.2 particles per domain, domain radius of 16 nm, and varied ratio of monomers to domain particles. (A) Radius calculated using the max value of H(r). (B) Radius calculated using the min value of H′(r). The dashed line shows the actual domain radius (16 nm) whereas the solid line shows the calculated radius. The number associated with each data point indicates the fraction of patterns in which aggregation was identified.
For the patterns where aggregation was detected, we found that although the SD of the radius predicted by [HMAX] and [H′MIN] increased with the monomer fraction, the mean predicted radius was not altered significantly by the noise of monomers until the monomer fraction exceeded 80%. This is consistent with our previous result (Fig. 7) that the monomer fraction contributed only partially to the experimental noise of the statistics.
Discussion
In this study, we evaluated the use of Ripley's K to quantitatively measure domain size under both idealized and experimental conditions. We first analyzed Ripley's K in idealized conditions to delimit the theoretical potential of Ripley's K under best-case scenarios. For the first time, to our knowledge, we describe the relationship between the radius of maximal aggregation [HMAX] and the domain radius, and found that [HMAX] increases systematically and regularly with the domain separation. Thus, the ratio of [HMAX] and the actual domain radius is a predictor of the domain separation. On the basis of our theoretical results, we propose what we believe is a new measure, the radius that minimizes the derivative of H, for finding the domain radius in a separation-independent manner. The minimum of the derivative of H(r) geometrically corresponds to the domain boundary because the density of particles outside domains is less than that of the domain interior.
We next applied Ripley's K-analysis to experimentally derived data for K-ras nanoclusters to study the effects of noise such as a monomer fraction and interdomain interactions on quantitative analysis of domain size. Our noise analysis indicates that the predictive values of Ripley's K measures are affected profoundly by domain interaction that occurs whenever domains are within one domain width of each other. This is a significant finding because domains are likely to randomly approach at distances that will result in domain interaction even at low domain densities. For example, significant domain interaction occurred in our test case even though the average domain separation was fourfold greater than the minimum domain separation at which interaction occurs (e.g., for domain interaction when the domain radius is 6 nm). Because [HMAX] is somewhat more robust to the effect of domain interaction, [HMAX] may be the preferred measure for experimental data sets, keeping in mind that [HMAX] tends to slightly overestimate the domain radius in cases of low domain density. At very low domain density, [H′MIN] would provide a more accurate measure. For both measures, several patterns should be analyzed because individual results may vary widely whereas the mean remains more or less trustworthy.
Our findings illustrate the utility of examining simple limiting cases and carrying out systematic noise analyses to discern the underlying limits of analytical tools like Ripley's K. Predicting or extrapolating theoretical results in the presence of noise is complicated by the fact that sources of noise are exceptionally case-dependent; each environmental scenario will have a unique combination of noise effects. Previous work has taken advantage of simulations that mimic actual experimental data (17). Here, Monte Carlo models enabled us to switch sources of noise off and on and look at their effects independently. We therefore propose conducting Monte Carlo simulations for each experimental situation under study to evaluate the performance of the statistic used in that context.
Acknowledgments
The work was supported by National Institutes of Health grant R01 GM073846 to A.K.K. and grant R01 GM66717 to J.F.H.
References
- 1.Jacobson K., Mouritsen O.G., Anderson R.G. Lipid rafts: at a crossroad between cell biology and physics. Nat. Cell Biol. 2007;9:7–14. doi: 10.1038/ncb0107-7. [DOI] [PubMed] [Google Scholar]
- 2.Prior I.A., Muncke C., Parton R.G., Hancock J.F. Direct visualization of Ras proteins in spatially distinct cell surface microdomains. J. Cell Biol. 2003;160:165–170. doi: 10.1083/jcb.200209091. [DOI] [PMC free article] [PubMed] [Google Scholar]
- 3.Sharma P., Varma R., Sarasij R.C., Ira, Gousset K. Nanoscale organization of multiple GPI-anchored proteins in living cell membranes. Cell. 2004;116:577–589. doi: 10.1016/s0092-8674(04)00167-9. [DOI] [PubMed] [Google Scholar]
- 4.Hess S.T., Kumar M., Verma A., Farrington J., Kenworthy A. Quantitative electron microscopy and fluorescence spectroscopy of the membrane distribution of influenza hemagglutinin. J. Cell Biol. 2005;169:965–976. doi: 10.1083/jcb.200412058. [DOI] [PMC free article] [PubMed] [Google Scholar]
- 5.Parton R.G., Hancock J.F. Lipid rafts and plasma membrane microorganization: insights from Ras. Trends Cell Biol. 2004;14:141–147. doi: 10.1016/j.tcb.2004.02.001. [DOI] [PubMed] [Google Scholar]
- 6.Hancock J.F., Prior I.A. Electron microscopic imaging of Ras signaling domains. Methods. 2005;37:165–172. doi: 10.1016/j.ymeth.2005.05.018. [DOI] [PMC free article] [PubMed] [Google Scholar]
- 7.Zhang J., Leiderman K., Pfeiffer J.R., Wilson B.S., Oliver J.M. Characterizing the topography of membrane receptors and signaling molecules from spatial patterns obtained using nanometer-scale electron-dense probes and electron microscopy. Micron. 2006;37:14–34. doi: 10.1016/j.micron.2005.03.014. [DOI] [PubMed] [Google Scholar]
- 8.Kellner R.R., Baier C.J., Willig K.I., Hell S.W., Barrantes F.J. Nanoscale organization of nicotinic acetylcholine receptors revealed by stimulated emission depletion microscopy. Neuroscience. 2007;144:135–143. doi: 10.1016/j.neuroscience.2006.08.071. [DOI] [PubMed] [Google Scholar]
- 9.Hess S.T., Gould T.J., Gudheti M.V., Maas S.A., Mills K.D. Dynamic clustered distribution of hemagglutinin resolved at 40 nm in living cell membranes discriminates between raft theories. Proc. Natl. Acad. Sci. USA. 2007;104:17370–17375. doi: 10.1073/pnas.0708066104. [DOI] [PMC free article] [PubMed] [Google Scholar]
- 10.Ripley B.D. Modelling spatial patterns. J. R. Stat. Soc. Series B Stat. Methodol. 1977;39:172–192. [Google Scholar]
- 11.Besag J. Comments on Ripley's paper. J. R. Stat. Soc. Series A. 1977;B39:193–195. [Google Scholar]
- 12.Ehrlich M., Boll W., Van Oijen A., Hariharan R., Chandran K. Endocytosis by random initiation and stabilization of clathrin-coated pits. Cell. 2004;118:591–605. doi: 10.1016/j.cell.2004.08.017. [DOI] [PubMed] [Google Scholar]
- 13.Heneberg P., Lebduska P., Draberova L., Korb J., Draber P. Topography of plasma membrane microdomains and its consequences for mast cell signaling. Eur. J. Immunol. 2006;36:2795–2806. doi: 10.1002/eji.200636159. [DOI] [PubMed] [Google Scholar]
- 14.Kiyokawa E., Baba T., Otsuka N., Makino A., Ohno S. Spatial and functional heterogeneity of sphingolipid-rich membrane domains. J. Biol. Chem. 2005;280:24072–24084. doi: 10.1074/jbc.M502244200. [DOI] [PubMed] [Google Scholar]
- 15.Lillemeier B.F., Pfeiffer J.R., Surviladze Z., Wilson B.S., Davis M.M. Plasma membrane-associated proteins are clustered into islands attached to the cytoskeleton. Proc. Natl. Acad. Sci. USA. 2006;103:18992–18997. doi: 10.1073/pnas.0609009103. [DOI] [PMC free article] [PubMed] [Google Scholar]
- 16.Pelkmans L., Zerial M. Kinase-regulated quantal assemblies and kiss-and-run recycling of caveolae. Nature. 2005;436:128–133. doi: 10.1038/nature03866. [DOI] [PubMed] [Google Scholar]
- 17.Plowman S.J., Muncke C., Parton R.G., Hancock J.F. H-ras, K-ras, and inner plasma membrane raft proteins operate in nanoclusters with differential dependence on the actin cytoskeleton. Proc. Natl. Acad. Sci. USA. 2005;102:15500–15505. doi: 10.1073/pnas.0504114102. [DOI] [PMC free article] [PubMed] [Google Scholar]
- 18.Wyse B.D., Prior I.A., Qian H., Morrow I.C., Nixon S. Caveolin interacts with the angiotensin II type 1 receptor during exocytic transport but not at the plasma membrane. J. Biol. Chem. 2003;278:23738–23746. doi: 10.1074/jbc.M212892200. [DOI] [PubMed] [Google Scholar]
- 19.Chung M., Nason J. Spatial demographic and genetic consequences of harvesting within populations of the terrestrial orchid. Cymbidium goeringii. Biol. Conserv. 2007;137:125–137. [Google Scholar]
- 20.Stoyan D., Pettinen A. Recent applications of spatial point process methods in forestry statistics. Stat. Sci. 2000;15:61–78. [Google Scholar]
- 21.Weigand T., Moloney K. Rings, circles, and null-models for point patterns analysis in ecology. Oikos. 2004;104:209–229. [Google Scholar]