

Abstract
The inactive-to-active conformational transition of the catalytic domain of human c-Src tyrosine kinase is characterized using the string method with swarms-of-trajectories with all-atom explicit solvent molecular dynamics simulations. The activation process occurs in two main steps in which the activation loop (A-loop) opens first, followed by the rotation of the αC helix. The computed potential of mean force energy along the activation pathway displays a local minimum, which allows the identification of an intermediate state. These results show that the string method with swarms-of-trajectories is an effective technique to characterize complex and slow conformational transitions in large biomolecular systems.
Main Text
The Src family protein tyrosine kinases are enzymes that play key roles in transducing cellular signals regulating cell growth, differentiation, proliferation, migration and survival (1,2). Crystallographic x-ray structures of human c-Src in the inactive (3) and active conformation (4) allow clear structural distinctions to be drawn between the inactive and active states. Those x-ray structures, though rich in information about the two end-points of the activation event, do not show how the activation occurs and how it might be regulated.
Simulations and computational models, at different levels of approximation, can complement some of the missing information about Src and help address these important questions (5–14). Characterizing conformational transitions in large biomolecules such as Src is challenging, however, because the slow processes are not easily observed during simple unbiased molecular dynamics (MD) simulations (14). To circumvent those difficulties, previous studies of Src have relied on targeted MD (TMD; 5–8), biased sampling techniques (10–13), or have resorted to simplified coarse-grained models with no explicit solvent (9).
Recently, we have proposed the “string method with swarms-of-trajectories” to determine the optimal minimum free energy path between two stable conformations (15). The method, which was directly inspired by the work of Vanden-Eijnden and collaborators (16,17), represents the path parametrically on the basis of a set of “collective variables” z, ordered as a chain of M states or “images”, {z(1), z(2), …, z(M)}. Briefly, the algorithm consists in evolving the chain of states toward an optimal path (or paths) by making small adjustments Δz(m) to the images (15–17). The value Δz(m) is calculated as the average drift for an ensemble (swarms) of unbiased short trajectories of length τ initiated from each of the images, 〈z(m)(τ) – z(m)(0) 〉. This procedure is based on the assumption that, on the time scale τ, the set of collective variables z(t) evolves as an overdamped Brownian dynamics guided by a free energy landscape. Nevertheless, the true MD dynamical evolution of the atomistic degrees of freedom of the real system is used. The algorithm progressively refines the M images until the dynamical propagation takes place along the path on average (15).
Although the string method has been successfully applied to systems of various complexity (15–18), to our knowledge, this communication reports the first application to a large and complex conformational change in a protein with explicit solvent. The inactive (PDB 2SRC) and active (PDB 1Y57) x-ray structures of human c-Src kinase (3,4) are used as the two end-point conformations between which the activation pathway is determined. Only the catalytic domain (residues W260 to T521) is included in this study, without the regulatory SH2 and SH3 binding domains.
The choice of collective variables for representing the long time scale dynamics of the system is a critical aspect of the method (15). For the sake of simplicity, the Cartesian coordinates of the backbone carbone α and one representative side-chain atom of ∼25 key residues were used, for a total of ∼150 degrees of freedom in the subset z. Another critical issue concerns the initial conditions. Here, the starting path was taken from a nonequilibrium TMD trajectory used to “pull” the protein structure from the inactive to the active conformation. More details of the system and the string method with swarms-of-trajectories are provided in the Supporting Material.
The catalytic domains of c-Src kinase in the inactive and active states exhibit considerable structural differences (Fig. 1 A, D). Notably, in the inactive state the A-loop (residues D404 to R424) has two short pieces of the α-helix, allowing the phosphorylation site Tyr416 to be buried inside the catalytic site.
Figure 1.
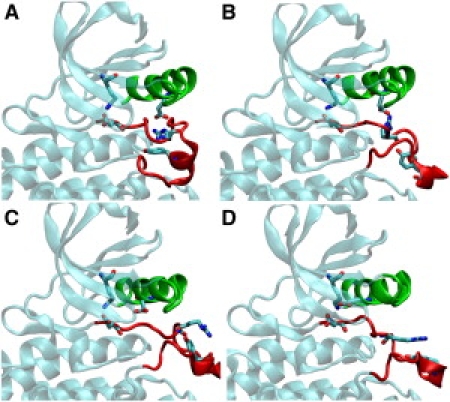
Conformations from one of the converged pathways. A, B, C, and D correspond to images 1, 21, 40, 50 from iteration 66, showing the progressive opening of the A-loop (red) and rotation of the αC helix (green). Residues shown in stick form illustrate the switching of electrostatic interactions between K295, E310, D404, R409 and Y416. See the animation of the conformational transition in the Supporting Material.
In contrast, the two short helices unfold and adopt an extended loop form in the active state. Some residues in the A-loop move as far as 30 Å as the loop opens. Accompanying the opening of the A-loop is the inward rotation of the αC helix (residues G300 to L317) exemplified by the movement of Glu310 side chain in Fig. 1.
The activation pathways obtained from the string method suggest that the complex conformational change follow well-orchestrated steps. First, the two short helices unfold and the A-loop partially opens, breaking a hydrophobic core formed by residues Phe307, Met314, Leu407 and Leu410. Once this hydrophobic core is broken, the αC helix rotates resulting in a movement of Glu310 toward the kinase catalytic site to form a salt bridge with Lys295. This step is also facilitated by the drifting away of Arg409 and the concerted breaking of the Glu310-Arg409 salt bridge as the A-loop opens further. At the final stage, the exposed Tyr416 at the A-loop is stabilized by Arg409 (Fig. 1 D). The DFG motif (Asp404, Phe405, Gly406) highly conserved among various tyrosine kinase families does not experience any particular conformational rearrangement during the activation process.
These details obtained from the string method are in good accord with the TMD pathway of Lyn kinase (6) and the umbrella sampling study of Hck kinase (11) in terms of the switching of electrostatic and hydrophobic interactions among several key residues. Furthermore, a recent study on the open-to-close transition of CDK5 kinase catalytic domain using metadynamics (13) also indicates that the reverse reaction active-to-inactive takes place in two well-defined steps: the αC helix rotates first and the A-loop refolds to assume inactive conformation later. Taken together, this study, as well as previous studies on Hck kinase (8–12), suggests that the conformational activation of different kinases may share a conserved mechanism, at least for the isolated catalytic domain.
The one-dimensional free energy profile computed by integrating the mean force along the activation pathway (17) indicates that the initial path from TMD is indeed being relaxed as the string evolves (Fig. 2). The free energy of the active state, starting around 80 kcal/mol, quickly drops to <10 kcal/mol in 55 iterations and fluctuates around that level afterward. This one-dimensional free energy profile also suggests that c-Src in the inactive state is relatively more stable than in the active state for the isolated catalytic domain, consistent with previous results on Hck (11,12) and CDK5 (13). Although the absolute value of the free energy barrier would require a more extensive sampling to reach quantitative accuracy, the gradual lowering of the free energy demonstrates the ability of the string method to improve upon the initial TMD.
Figure 2.
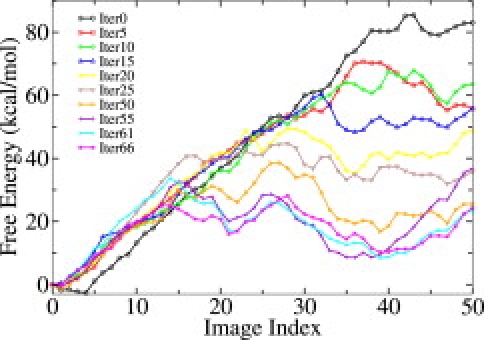
One-dimensional free energy profile along the activation pathways from iterations 0, 5, 10, 15, 20, 25, 50, 55, 61 and 66, showing the path is gradually being relaxed.
The existence of an intermediate conformational state can be identified as a local minimum in the one-dimensional free energy profile of the converged pathways (near image 21). This intermediate state (Fig. 1 B) exhibits structural features in between those of the inactive and active states. Specifically, the A-loop is already partially opened whereas the αC helix adopts a conformation close to that of the inactive state, in which the Glu310-Arg409 salt bridge remains intact. A similar intermediate state has also been reported in the conformational transitions of Hck kinase (9,11,12), CDK5 kinase (13) and Abl kinase (14).
It is informative to examine projections of the pathways onto a small number of relevant coordinates. In Fig. 3 A, the difference between the initial path from TMD and the relaxed paths from the string method, projected on two order parameters corresponding to the movement of the A-loop and the αC helix, is apparent. A free energy map (Fig. 3 A, inset) describing the activation of Hck kinase in terms of the same order parameters (12) suggests that the TMD transits directly through a region corresponding to some high free energy. In contrast, the relaxed pathways from the string method evolve within a low free energy region an intermediate state (near image 21, green dots in Fig. 3 A). As shown in Fig. 3 B, the conformational change is accompanied by an electrostatic switching process involving several salt bridges (6,8). The initial TMD path is distinct from the string paths in that the transition is more sudden in TMD but the characteristic is qualitatively preserved with the string paths.
Figure 3.
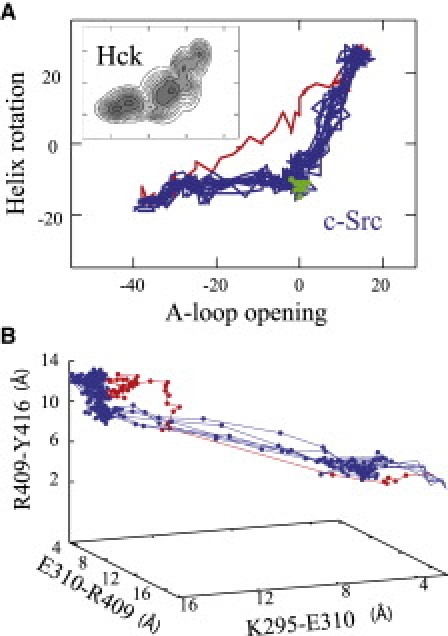
(A) Projection of the pathways onto two order parameters corresponding to the relative number of native contacts formed by the A-loop and the αC helix in the inactivate and active states. Initial TMD path (red) and string paths (blue) compared with the coarse-grained two-dimensional free energy map of Hck kinase (inset) from Yang et al. (12). The upper right region is the active state and lower left the inactive state. The intermediate state in the middle approximately matches to image 21 of the string pathways (green). (B) Pathways showing the switch of K295-E310, E310-R409 and R409-Y416 electrostatic network reported in Ozkirimli and Post (6). The string paths (blue) are quantitatively different from the initial TMD path (red).
This study reports the first application of the string method with swarms-of-trajectories to study a conformational change in a large biomolecule based on atomistic simulations with explicit solvent. The pathways are shown to gradually relax from the initial TMD path, as the string is evolved following the swarms-of-trajectories procedure (15). Converged pathways and free energy profile along the path allow us to propose that the A-loop opening happens first, and is followed by the rotation of the αC helix. An intermediate state is identified along the two-step activation pathway, which may provide useful support to structure-based design of kinase inhibitors. Comparison of the c-Src pathways to previously reported studies on Lyn (6), Hck (9,11,12) and CDK5 kinase (13) suggests that different kinases may share a unified activation mechanism. Since both the structure and biological function of protein kinase catalytic domain are highly conserved, a deeper understanding of the atomistic details and free energy landscape of c-Src conformational transition will likely shed light on the activation mechanism of other protein kinase families encoded by the human kinome.
Supporting Material
Computer scripts, tables and figures are available at http://www.biophysj.org/biophysj/supplemental/S0006-3495(09)01117-5.
Supporting Material
Acknowledgments
We thank Albert C. Pan, Deniz Sezer and Luca Maragliano for discussions.
This work was supported by grant MCB0415784 from the National Science Foundation (NSF), grant CA93577 from the National Institutes of Health (NIH), and computing grant TG-MCA01S018 from the National Center for Supercomputing Applications (NCSA).
References and Footnotes
- 1.Bolen J.B. Nonreceptor tyrosine protein kinases. Oncogene. 1993;8:2025–2031. [PubMed] [Google Scholar]
- 2.Parsons S.J., Parsons J.T. Src family kinases, key regulators of signal transduction. Oncogene. 2004;23:7906–7909. doi: 10.1038/sj.onc.1208160. [DOI] [PubMed] [Google Scholar]
- 3.Xu W., Doshi A., Lei M., Eck M.J., Harrison S.C. Crystal structures of c-Src reveal features of its autoinhibitory mechanism. Mol. Cell. 1999;3:629–638. doi: 10.1016/s1097-2765(00)80356-1. [DOI] [PubMed] [Google Scholar]
- 4.Cowan-Jacob S.W., Fendrich G., Manley P.W., Jahnke W., Fabbro D. The crystal structure of a c-Src complex in an active conformation suggests possible steps in c-Src activation. Structure. 2005;13:861–871. doi: 10.1016/j.str.2005.03.012. [DOI] [PubMed] [Google Scholar]
- 5.Young M.A., Gonfloni S., Superti-Furga G., Roux B., Kuriyan J. Dynamic coupling between the SH2 and SH3 domains of c-Src and Hck underlies their inactivation by C-terminal tyrosine phosphorylation. Cell. 2001;105:115–126. doi: 10.1016/s0092-8674(01)00301-4. [DOI] [PubMed] [Google Scholar]
- 6.Ozkirimli E., Post C.B. Src kinase activation: A switched electrostatic network. Protein Sci. 2006;15:1051–1062. doi: 10.1110/ps.051999206. [DOI] [PMC free article] [PubMed] [Google Scholar]
- 7.Ozkirimli E., Yadav S.S., Miller W.T., Post C.B. An electrostatic network and long-range regulation of Src kinases. Protein Sci. 2008;17:1871–1880. doi: 10.1110/ps.037457.108. [DOI] [PMC free article] [PubMed] [Google Scholar]
- 8.Banavali N.K., Roux B. Anatomy of a structural pathway for activation of the catalytic domain of Src kinase Hck. Proteins. 2007;67:1096–1112. doi: 10.1002/prot.21334. [DOI] [PubMed] [Google Scholar]
- 9.Yang S., Roux B. Src kinase conformational activation: thermodynamics, pathways, and mechanisms. PLoS. Comput. Biol. 2008;4:e1000047. doi: 10.1371/journal.pcbi.1000047. [DOI] [PMC free article] [PubMed] [Google Scholar]
- 10.Banavali N.K., Roux B. The N-terminal end of the catalytic domain of SRC kinase Hck is a conformational switch implicated in long-range allosteric regulation. Structure. 2005;11:1715–1723. doi: 10.1016/j.str.2005.09.005. [DOI] [PubMed] [Google Scholar]
- 11.Banavali N.K., Roux B. Flexibility and charge asymmetry in the activation loop of Src tyrosine kinases. Proteins. 2008;74:378–389. doi: 10.1002/prot.22153. [DOI] [PMC free article] [PubMed] [Google Scholar]
- 12.Yang S., Banavali N.K., Roux B. Mapping the conformational transition in Src activation by cumulating the information from multiple molecular dynamics trajectories. Proc. Natl. Acad. Sci. USA. 2009;106:3776–3781. doi: 10.1073/pnas.0808261106. [DOI] [PMC free article] [PubMed] [Google Scholar]
- 13.Berteotti A., Cavalli A., Branduardi D., Gervasio F.L., Recanatini M. Protein conformational transitions: the closure mechanism of a kinase explored by atomistic simulations. J. Am. Chem. Soc. 2009;131:244–250. doi: 10.1021/ja806846q. [DOI] [PubMed] [Google Scholar]
- 14.Shan Y., Seeliger M.A., Eastwood M.P., Frank F., Xu H. A conserved protonation-dependent switch controls drug binding in the Abl kinase. Proc. Natl. Acad. Sci. USA. 2009;106:139–144. doi: 10.1073/pnas.0811223106. [DOI] [PMC free article] [PubMed] [Google Scholar]
- 15.Pan A.C., Sezer D., Roux B. Finding transition pathways using the string method with swarms of trajectories. J. Phys. Chem. B. 2008;112:3432–3440. doi: 10.1021/jp0777059. [DOI] [PMC free article] [PubMed] [Google Scholar]
- 16.Ren W., Weinan E., Vanden-Eijnden E. String method for the study of rare events. Phys. Rev. B. 2002;66:52301–52304. doi: 10.1021/jp0455430. [DOI] [PubMed] [Google Scholar]
- 17.Maragliano L., Fischer A., Vanden-Eijnden E., Ciccotti G. String method in collective variables: minimum free energy paths and isocommittor surfaces. J. Chem. Phys. 2006;125:24106–24120. doi: 10.1063/1.2212942. [DOI] [PubMed] [Google Scholar]
- 18.Miller T.F., Vanden-Eijnden E., Chandler D. Solvent coarse-graining and the string method applied to the hydrophobic collapse of a hydrated chain. Proc. Natl. Acad. Sci. USA. 2007;104:14559–14564. doi: 10.1073/pnas.0705830104. [DOI] [PMC free article] [PubMed] [Google Scholar]
Associated Data
This section collects any data citations, data availability statements, or supplementary materials included in this article.