

Abstract
Background
Gray matter (GM) pathology is an important component of the multiple sclerosis (MS) disease process. Accelerated gray matter atrophy has been observed in MS patients, but its relationship to neurological disability is not defined. This study was done to determine the relationship between whole brain, GM, and white matter (WM) atrophy and MS disability progression.
Methods
Patients with MS and Clinically Isolated Syndromes (CIS), and age- and gender-matched healthy controls were entered into an observational protocol. Baseline brain parenchymal fraction (BPF), GM fraction, and WM fraction, and change over 4 years were correlated with sustained disability progression over the entire study duration. Disability progression was measured using the multiple sclerosis functional composite (MSFC) and the expanded disability status scale (EDSS).
Results
Seventy MS and CIS patients and 17 HCs were studied for an average of 6.6 years (range, 3.6-7.8 years). At the final visit, 7 patients were classified as CIS, 36 as relapsing-remitting MS (RRMS), and 27 as secondary progressive MS (SPMS). Baseline whole brain, GM, and WM atrophy predicted EDSS ≥ 6.0 at the last study visit. Twenty-one (33%) patients worsened using the EDSS to define disability progression; 29 (46%) worsened using MSFC to define disability progression. Patients with MSFC progression had significantly higher GM atrophy rates compared with patients who were stable on MSFC. White matter atrophy was similar in patients with and without disability progression. Atrophy rates were not different in patients with or without disability progression defined using EDSS.
Conclusions
Whole brain, GM, and WM atrophy predicted MS disability progression observed over the next 6.6 years. Gray matter atrophy rates over 4 years correlated with disability progression measured with the MSFC, but not EDSS. This indicates that MSFC defined disability progression is more closely linked to brain atrophy than EDSS defined disability progression, and provides important new insight into the poor correlation between MRI and clinical disability in MS. The findings confirm the clinical relevance of gray matter atrophy in MS.
Introduction
Multiple sclerosis has historically been classified as a white matter disease. Conspicuous foci of demyelination are evident post-mortem, and are easily visualized by magnetic resonance imaging (MRI), explaining why MS has long been perceived as a white matter disease. Recently, many studies have demonstrated prominent pathological changes in GM in MS brains as well. These changes include widespread demyelination, activated microglia, apoptotic neurons, and atrophy affecting the cortex, and deep GM structures(1-4). Focal GM lesions are not well visualized by conventional MRI scanning, however. Therefore, the time course and relevance of GM pathology has not been fully elucidated.
Magnetic resonance imaging studies have documented that GM volumes are lower in MS patients than in healthy age-matched controls, and some studies have suggested that GM atrophy may begin early in the course of disease.(5-11) Evolution of GM atrophy over the course of MS, its relationship to disability, and the pathogenesis of GM pathology remain important questions in the MS field. The objective of this study was to determine the clinical relevance of GM atrophy in a spectrum of MS patients, by correlating correlate whole brain, GM, and WM atrophy with sustained disability progression.
Methods
Research Subjects
Patients and age- and gender-matched HC subjects were recruited from the Mellen Center. The study was approved by the Cleveland Clinic Institutional Review Board and each subject provided informed consent. Subjects with MS met the International Panel criteria(12) and each had a cranial MRI demonstrating lesions consistent with MS. Patients were classified as RRMS if they had 2 or more relapses with significant neurologic recovery in the prior 3 years, or as SPMS if they reported continued deterioration for at least 6 months, with or without relapses, and a history of at least 2 prior relapses. Subjects with CIS had an episode of neurological dysfunction typical for an initial MS presentation. Disease therapy with interferon β, glatiramer acetate, methotrexate, or azathioprine was allowed. Age- and gender-matched healthy controls were required to have a normal neurological examination, a normal brain MRI, and no history of symptoms suggestive of MS. Patients and controls were excluded if they received corticosteroid therapy within 2 months, were on bimonthly corticosteroid pulses, required therapy for hypertension, or had a history of TIA or stroke, heart disease, pulmonary disease, diabetes, or chronic renal insufficiency.
Visit Schedule
Healthy control subjects were evaluated annually; CIS and MS patients were evaluated bi-annually for 4 years, and annually thereafter. Demographic information, date of disease onset, and clinical pattern of disease were recorded at baseline. Kurtzke Extended Disability Status Scale (EDSS), timed ambulation, 9-hole peg test, 3-second Paced Auditory Serial Addition Test (PASAT), relapse history, and medications were recorded at each visit. The timed ambulation, 9-hole peg test, and PASAT scores were transformed into the Multiple Sclerosis Functional Composite (MSFC) by normalization to a published MS reference group.(13) Subjects had standardized MRI exams using the same protocol throughout the study. For subjects requiring corticosteroids for relapses, study visits were postponed at least 6 weeks. Disease worsening among the MS subjects was defined in two ways: 1) Disability progression using the MSFC was defined as a sustained change of ≥ 20% from baseline for any of the 3 components of the MSFC, sustained for two successive visits. 2) Disability progression using EDSS was defined as worsening from baseline by 1.0 EDSS point (or 0.5 point for those who started the study with EDSS >= 5.5), sustained at two successive visits. For both MSFC and EDSS disability progression, worsening was required to persist for ≥ 6 months.
MRI Exams
Images were acquired on a 1.5T Siemens MR scanner. The standardized protocol included T2-weighted fluid attenuated inversion recovery (FLAIR) and T1-weighted spin echo (SE) images that were used for volumetric measurements. Acquisition parameters for the FLAIR sequence were: repetition time 6000ms, echo time = 105ms, inversion time = 2000ms; and for the T1 SE: repetition time 800ms, echo time = 35ms. Both images had in-plane resolution = 0.9mm × 0.9mm; and slice thickness = 5mm. MRIs were analyzed to calculate brain parenchymal fraction (BPF), gray matter fraction (GMF), and white matter fraction (WMF) using fully-automated software developed at the Cleveland Clinic, as previously described(11;14;15). Partial volume effects were accounted for in the calculation of all volumes using linear mixture models and GM volumes were adjusted for the effects of T2 lesions. The scan-rescan coefficient of variability for BPF, GMF, and WMF were determined to be 0.19%, 1.1%, and 1.4%, respectively.
Statistical Analyses
Magnetic resonance imaging data was available for the initial 4 years of the study; clinical data was available for a mean of 6.6 years. Baseline and on-study changes in atrophy measures were compared among disease subgroups and healthy controls using analysis of variance (ANOVA). T-test was used to compare groups in MSFC and EDSS progression status. For categorical variables, a chi-square test or Fisher's exact test was performed. Spearman Rank correlation was used for correlations between GM atrophy, WM atrophy and clinical disability. All analyses were performed using SAS version 8.2 (SAS Institute Inc., Cary, NC).
Results
One hundred six research subjects were enrolled in the original study. Nineteen subjects discontinued the protocol for various reasons; this report provides information on the remaining 87 subjects. These 87 research subjects were observed for a mean of 6.6 years (range: 3.6-7.8 years). Eight of 15 subjects who initially entered with a diagnosis of CIS transitioned to MS during the course of the study; 7 to RRMS, and 1 to SPMS. The remaining 7 CIS patients remained stable and were still classified as CIS at the final visit. In the 7 cases transitioning to RRMS, conversion was based on a second relapse. Seven of the 36 patients initially categorized as RRMS transitioned to SPMS.
Baseline characteristics for the research subjects are listed in Table 1, grouped according to disease classification at the final visit. There were no significant differences between BPF, GMF, or WMF in HCs compared with CIS patients who did not convert to MS during the study (all p-values > 0.79). Brain parenchymal fraction was significantly lower in RRMS patients compared with HCs (p<0.01), and significantly lower in SPMS patients compared with RRMS patients (p <0.0001). Similarly, GMF and WMF were significantly lower in MS patients compared with HCs (all p-values <0.01), and lower in SPMS compared with RRMS (p<0.001). Figure 1 shows the percent difference at baseline between HCs and the patients groups at baseline. Patients with RRMS had average BPF values 2.2% lower than HCs; SPMS had average baseline values 6.8% lower than HCs.
Table 1. Baseline Characteristics.
| HC (n=17) |
CIS (n=7) |
RRMS (n=36) |
SPMS (n=27) |
|
|---|---|---|---|---|
| Mean (sd) Age, years | 41.6 (8.1) | 44.2 (10.9) | 39.4 (8.4) | 47.5 (7.8) |
| n Female (%) | 10 (59%) | 6 (86%) | 28 (78%) | 18 (67%) |
| Mean (sd) symptom duration, years | (na) | 0.25 (0.1) | 5.7 (5.4) | 17.0 (7.6) |
| Mean (sd) EDSS | (na) | 1.0 (0.76) | 1.9 (1.5) | 5.1 (1.5) |
| Mean (sd) MSFC | 0.55 (27) | 0.36 (0.35) | 0.43 (0.58) | -0.82 (1.34) |
| Mean (sd) T2 lesion volume, ml | (na) | 2.5 (2.3) | 18.1 (17.2) | 42.7 (24.9) |
| Mean (sd) T1 lesion volume, ml | (na) | 0.15 (0.22) | 1.72 (2.89) | 8.30 (8.31) |
| % GD Positive | (na) | 14.3% | 22.2% | 18.5% |
| Mean (sd) BPF | 0.862 (0.012) | 0.862 (0.008) | 0.843 (0.026) | 0.804 (0.04) |
| Mean (sd) GMF | 0.554 (0.015) | 0.553 (0.010) | 0.541 (0.019) | 0.520 (0.028) |
| Mean (sd) WMF | 0.308 (0.011) | 0.309 (0.009) | 0.302 (0.017) | 0.283 (0.016) |
Abbreviations: sd = standard deviation; HC = Healthy controls; CIS = patients who had a clinically isolated syndrome and did not meet the criteria for a diagnosis of clinically definite MS over the course of 6.5 years; RRMS = relapsing-remitting MS patients (throughout study); SPMS = secondary progressive MS patients (throughout study); EDSS = Expanded Disability Status Score; MSFC = Multiple Sclerosis Functional Composite; % GD Positive = percent of patients with gadolinium-enhancing lesions; BPF = brain parenchymal fraction; GMF = gray matter fraction; WMF = white matter fraction
Figure 1. Percent Difference From Healthy Controls At Start Of Study.
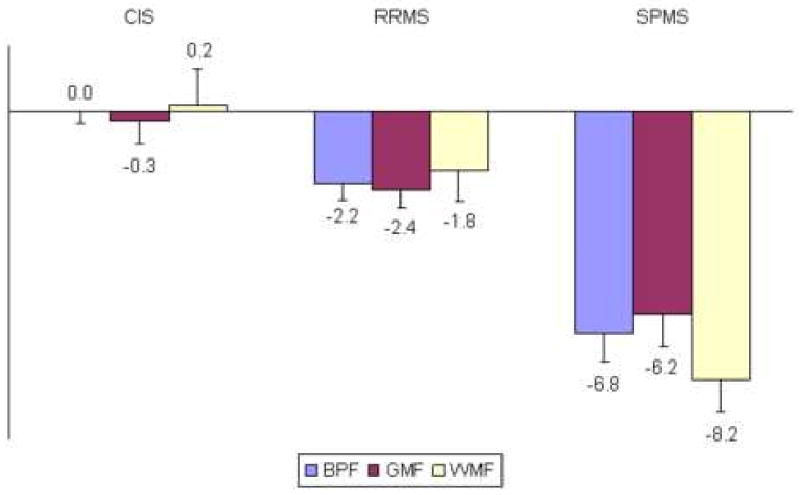
Mean percent difference in BPF, GMF, and WMF compared with healthy controls at the study baseline. Error bars are standard error of the mean. Corrected for disease duration, the average annual deviation from healthy controls for BPF was calculated as about -0.40% for both RRMS and SPMS patients.
Subsequent analyses excluded the 7 CIS cases who did not convert to MS during the study, and focused on 63 MS patients and the HCs. At baseline, GMF and WMF were both moderately correlated to EDSS, MSFC, and all 3 components of the MSFC. Baseline correlations with disability were generally stronger for WM atrophy than GM atrophy for each disability measure except for the PASAT. The strongest disability correlate of WMF was 9HT (r = 0.63, p < 0.0001) and for GMF it was the overall MSFC (r=0.49, p<0.0001).
Baseline BPF, GMF and WMF for the MS patients correlated with EDSS status at the last visit. Twenty of 63 patients (32%) had EDSS scores ≥ 6.0 at the last visit. Compared with the less disabled group, the group with EDSS ≥ 6.0 had lower baseline GM fraction (0.521 +/- 0.029 vs 0.537 +/- 0.022, p<0.05), and WM fraction (0.281 +/- 0.014 vs 0.300 +/- 0.018, p<0.01). Baseline BPF, GMF and WMF were correlated with last visit EDSS status as illustrated in Figure 2. For each of the 3 atrophy measures, there was significantly increased likelihood of being in the EDSS ≥ 6.0 category at the follow up visit in the quartile with the highest amount of atrophy at baseline compared to the quartile with the lowest amount. Patients in the worst quartile of baseline atrophy scores had ≥ 50% likelihood of being in the EDSS ≥ 6.0 group at the final visit; patients in the best quartile of baseline atrophy scores had ≤ 13% risk of being in the EDSS ≥ group at the final visit.
Figure 2. Percent EDSS ≥ 6.0 At Last Visit According To Atrophy At Baseline Visit.
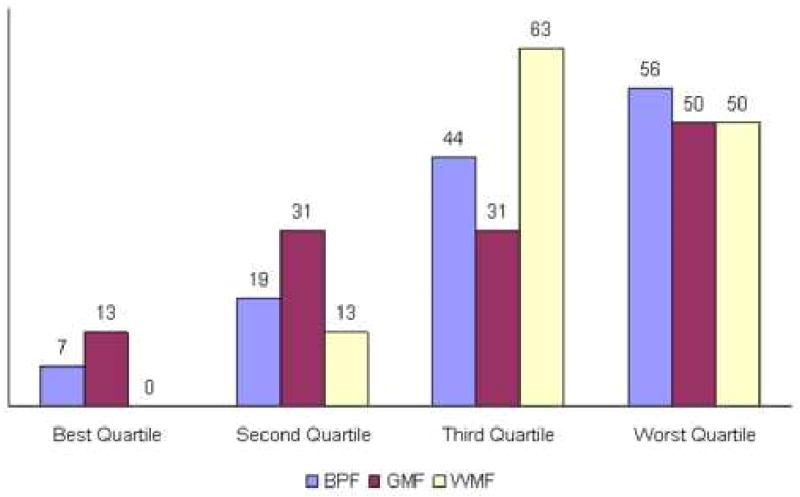
Percentage of patients at different baseline atrophy scores who were classified as EDSS ≥ 6.0 at the last visit. Patients with MS were divided into quartiles of BPF, GMF, and WMF at study entry, and the proportion at the EDSS milestone at the last visit shown. Patients in the worst quartile had significantly higher risk of poor clinical outcome compared with subjects in the most favorable quartile.
Disability progression defined using MSFC occurred more frequently than disability progression defined using EDSS. Forty-six percent of the MS patients had disability progression measured by MSFC, compared with 33% measured by EDSS. Characteristics of patients with disability progression defined using MSFC are shown in Table 2. Patients with disability progression were older, had longer disease duration, were more likely to be classified as SPMS at baseline, had higher baseline EDSS, more EDSS change, worse baseline atrophy, and higher annual rates of GMF decline during the study. Figure 3 shows the rate of GMF and WMF decline for patients with MSFC-defined disability progression compared with MSFC-stable patients, shown as fold-increases compared with concurrently studied HCs. White matter fraction decline was similar in the two groups (2.8-fold increase in patients with MSFC-progression vs 3.9-fold increase in MSFC-stable patients). In contrast, the GMF decline was 14.2-fold higher in patients with MSFC -progression compared with 6.3-fold increase in MSFC-stable patients.
Table 2. Characteristics of Study Subjects by MSFC Progression Status.
| Clinical and MRI Characteristics | Worse (n=29) | Not Worse (n=34) | p-value |
|---|---|---|---|
| Age | 44.64 (9.65) | 41.30 (8.34) | 0.15 |
| Symptom Duration at Baseline | 15.04 (8.90) | 6.75 (6.0) | <0.001 |
| Time In Longitudinal Study (Months) | 6.63(0.95) | 6.65(0.70) | 0.93 |
| % Time on DMT During Study | 63.8%(37.7) | 79.7%(35.0) | 0.093 |
| MS Classification at Baseline | |||
| CIS | 2(7%) | 6(18%) | <0.01 |
| RR | 12(41%) | 24(71%) | |
| SP | 15(52%) | 4(11%) | |
| EDSS at Baseline | 4.35 (2.05) | 2.35(1.91) | <0.001 |
| EDSS Δ Baseline to Last Visit | 0.69 (1.07) | 0.09 (0.79) | 0.016 |
| MSFC at Baseline | -0.51(1.34) | 0.24(0.84) | 0.012 |
| MSFC Δ Baseline to Last Visit | -0.47 (1.38) | -0.024(0.81) | 0.14 |
| BPF at Baseline | 0.813 (0.042) | 0.838 (0.030) | 0.01 |
| GMF at Baseline | 0.526 (0.030) | 0.537 (0.019) | 0.08 |
| WMF at Baseline | 0.286 (0.017) | 0.301 (0.019) | <0.01 |
| BPF % Δ/year | -0.380 (0.242) | -0.196 (0.22) | 0.01 |
| GMF % Δ/year | -0.396 (0.469) | -0.175 (0.279) | 0.03 |
| WMF % Δ/year | -0.215 (0.435) | -0.296 (0.678) | 0.57 |
Abbreviations = See Table 1; Also, DMT = Disease Modifying Therapy; Δ = Change
Figure 3. Fold Increase In Atrophy Rates Compared With Healthy Controls By Disability Progression1.
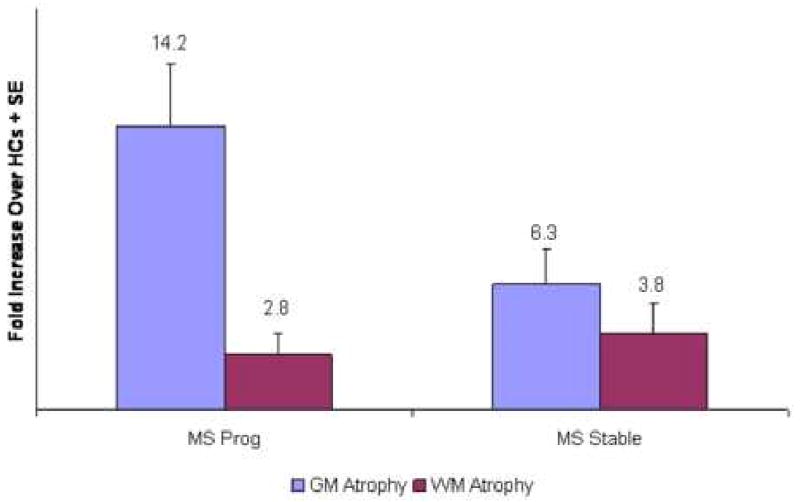
1Progression Defined Using MSFC
Plot of the mean fold-increase over healthy controls in the annual rates of gray matter and white matter atrophy in MS patients with MSFC progression compared with stable patients. Gray matter atrophy was defined as the annualized percentage decline in the gray matter fraction. White matter atrophy was defined as the annualized percentage decline in the white matter fraction. Error bars are standard error of the mean. Compared to healthy control rates, gray matter atrophy was higher than white matter atrophy in both groups. In contrast to white matter atrophy, gray matter atrophy was higher in patients with disability progression measured with the MSFC.
Accelerated GM atrophy was observed in both RRMS and SPMS patients with MSFC-defined disability progression. Annual GM fraction decline for RRMS and SPMS with MSFC -progression was -0.311% and -0.423%, respectively. Annual GM fraction decline for RRMS and SPMS who were MSFC-stable was -0.174% and -0.183%, respectively. This finding indicates that the relationship between MSFC disability progression and GM fraction decline was constant across disease categories, and not driven by the higher proportion of SPMS patients with MSFC disability progression.
In contrast, there were no differences in GM fraction or WM fraction change in patients with EDSS disability progression compared with EDSS-stable patients. Characteristics of patients with EDSS disability progression are shown in Table 3. They were less likely to be classified as SPMS at the baseline, indicating that the EDSS scale identifies more patients with disability progression at earlier stages of the disease than at later stages. This suggests that the scale becomes less sensitive in SPMS patients. Otherwise, the characteristics of patients with EDSS disability progression were similar to EDSS-stable patients. In particular, there were no differences in BPF, GM fraction, or WM fraction at baseline, or in atrophy progression during the study.
Table 3. Characteristics of Study Subjects by EDSS Progression Status.
| Clinical and MRI Characteristics | Worse (n=21) | Not Worse (n=42) | p-value |
|---|---|---|---|
| Age | 44.36 (7.24) | 42.07 (9.83) | 0.30 |
| Symptom Duration at Baseline | 10.81 (8.89) | 10.45 (8.38) | 0.88 |
| Time In Longitudinal Study (Months) | 6.64(0.78) | 6.64(0.84) | 0.99 |
| % Time on DMT | 68.1%(33.3) | 74.6%(38.58) | 0.50 |
| MS Classification at Baseline | |||
| CIS | 3(14%) | 5(12%) | 0.86 |
| RR | 11(53%) | 25(59%) | |
| SP | 7(33%) | 12(29%) | |
| EDSS at Baseline | 3.10 (2.56) | 3.36(2.02) | 0.69 |
| EDSS Δ Baseline to Last Visit | 1.17(1.00) | -0.04(0.67) | <0.001 |
| MSFC at Baseline | -0.33(1.36) | 0.004(1.04) | 0.33 |
| MSFC Δ Baseline to Last Visit | -0.63 (1.51) | -0.028(0.83) | 0.10 |
| BPF at Baseline | 0.827 (0.040) | 0.826 (0.036) | 0.92 |
| GMF at Baseline | 0.532 (0.028) | 0.532 (0.024) | 0.91 |
| WMF at Baseline | 0.293 (0.020) | 0.294 (0.019) | 0.84 |
| BPF % Δ/year | -0.300 (0.260) | -0.264 (0.242) | 0.65 |
| GMF % Δ/year | -0.339 (0.399) | -0.246 (0.388) | 0.38 |
| WMF % Δ/year | -0.276 (0.468) | -0.251 (0.629) | 0.86 |
Abbreviations = See Table 1; Also, DMT = Disease Modifying Therapy; Δ = Change
The data in tables 2 and 3 demonstrate that MSFC progression correlated with whole brain and gray matter atrophy, while EDSS progression did not. This finding emphasized the fact that different patients were classified as having progressed on disability by use of the two measures, as shown in Table 4. Only 62% of the patients were classified the same by both MSFC- and EDSS-based definitions of disability progression, while 38% were classified as disability progression by one but not the other measure. Twenty-five percent worsened on MSFC but not EDSS, and 13% worsened on EDSS but not MSFC. Twenty-one percent worsened on both MSFC and EDSS, and 41% were stable on both measures.
Table 4. Relationship Between MSFC and EDSS Progression.
| EDSS Progressed | EDSS Stable | Total | |
|---|---|---|---|
| MSFC Progressed | 13 | 16 | 29 (46%) |
| MSFC Stable | 8 | 26 | 34 (54%) |
| Total | 21 (33%) | 42 (67%) |
Characteristics of patients classified as discordant for MSFC and EDSS progression are compared in Table 5. Compared with subjects who progressed only by EDSS criteria, patients who progressed only by MSFC criteria had longer disease duration, were more likely to be SPMS patients, had higher baseline EDSS, and worse baseline atrophy scores. These results indicate that disability defined by EDSS but not confirmed by MSFC occurs largely in patients at low levels of the EDSS scale, and in patients with low levels of brain atrophy and low rates of brain atrophy progression. Subjects who progressed only by MSFC criteria had higher EDSS scores, higher levels of brain atrophy, and greater brain atrophy progression. Taken together, these results suggest that EDSS misclassifies MS disability progression in patients at the low end of the EDSS scale. In those cases, function is stable as measured by MSFC, and brain atrophy rates are low. The data further suggests that EDSS is an insensitive measure of disability progression in more severely affected patients. In those cases, EDSS is stable, but patients worsen as measured by MSFC and have high rates of brain atrophy. The combination of these two problems probably accounts for lack of correlation between EDSS progression and rates of brain atrophy, and suggests that MSFC progression has more biological meaning than EDSS progression.
Table 5. Characteristics of Patients By MSFC and EDSS Progression.
| Characteristics | MSFC Progressed EDSS Stable n=16 (25%) |
EDSS Progressed MSFC Stable n=8 (13%) |
p-value | ALL MS n=63 |
|---|---|---|---|---|
| Age | 45.5(11.3) | 45.6(7.1) | 0.98 | 42.8(9.1) |
| Symptom Duration | 16.4(8.5) | 6.6(6.3) | < 0.01 | 10.6(8.5) |
| % Time on DMT | 64.5(40.3) | 76.0(30.1) | 0.48 | 72.5%(36.8) |
| MS Classification at Baseline | ||||
| CIS | 1(6%) | 2(25%) | 0.10 | 8(13%) |
| RR | 6(38%) | 5(63%) | 36(57%) | |
| SP | 9(56%) | 1(13%) | 19(30%) | |
| EDSS at Baseline | 4.53(1.78) | 1.44(1.99) | < 0.001 | 3.27(2.20) |
| EDSS Δ Baseline to Last Visit | 0.22(0.68) | 1.0(0.60) | 0.012 | 0.37(0.97) |
| MSFC at Baseline | -0.41(1.29) | 0.17(1.12) | 0.29 | -0.11(1.15) |
| MSFC Δ Baseline to Last Visit | 0.01(0.68) | 0.07(0.33) | 0.83 | -0.23(1.13) |
| BPF at Baseline | 0.812(0.040) | 0.848(0.020) | 0.03 | 0.826(0.037) |
| GMF at Baseline | 0.525(0.027) | 0.543(0.011) | 0.10 | 0.532(0.025) |
| WMF at Baseline | 0.286(0.018) | 0.305(0.021) | 0.04 | 0.294(0.019) |
| BPF % Δ/year | -0.344(0.252) | -0.128(0.191) | 0.07 | -0.277(0.246) |
| GMF % Δ/year | -0.361(0.514) | -0.177(0.313) | 0.37 | -0.277(0.391) |
| WMF % Δ/year | -0.116(0.397) | -0.175(0.487) | 0.75 | -0.259(0.576) |
Discussion
Accelerated rates of brain volume loss have been reported in MS patients.(16-18) Over the years, brain volume declines 5-8 times faster in MS patients than healthy, age-matched controls, leading to the obvious interpretation that loss of brain volume is an end stage consequence of the pathologic processes operating in the disease.
However, measures of brain volume are pathologically nonspecific. Fluid shifts may increase or decrease brain volume; gliosis may increased brain volume; and pathological processes unrelated to MS, such as drug toxicity or co-existing brain conditions, may reduce brain volume. Despite these complexities and nuances, the consistent observation that MS patients lose brain volume at an accelerated rate over the long course of the disease must be explained by loss of axons and myelin as a result of the MS disease process. Therefore, in this paper, we use the terms “brain volume loss” and “brain atrophy” interchangeably.
As was previously observed by other investigators(19), accelerated brain atrophy was observed in patients with CIS who converted to MS, indicating that brain atrophy begins early in the disease process. Brain atrophy in RRMS often occurs with a very weak relationship to relapses or EDSS, suggesting that brain atrophy can be clinically silent during the early stages of the disease. However, brain atrophy during early disease stages is clinically relevant. The rate of brain atrophy during the RRMS stage was shown to strongly correlate with future clinical disability and with development of SPMS(20). Anti-inflammatory drugs slow brain atrophy during the RRMS disease stage(14;21), but not in the SPMS stage.(22;23) In some prior studies, brain atrophy rates were similar in RRMS and SPMS patients,(24-26) in our prior report of 4-year atrophy rates in a spectrum of MS patients(11) we observed higher rates of atrophy in SPMS compared with RRMS. In nearly all prior studies, the extent of whole brain atrophy correlated better with disability than did lesions.(18)
Reports about gray matter pathology have accumulated in recent years. Based on pathologic studies, tissue damage in gray matter appears to be a large component of overall MS disease burden.(2;27) Previous studies demonstrated GM atrophy during the course of MS.(7-10) However, because conventional MRI techniques are not sensitive to lesions in gray matter,(28) atrophy measures are one of the only current method that can be used to quantify gray matter pathology in MS patients without the need for specialized image acquisitions. We recently reported that the rate of gray matter atrophy increased substantially in later stages of MS, and that gray matter atrophy correlated with measures of white matter pathology in RRMS but not SPMS(11), suggesting an evolution in the pathological basis for gray matter pathology as the disease evolves.
Numerous prior reports have documented correlations between whole brain atrophy and neurological disability,(16-18) but most prior studies have shown weak or no correlations between gray matter atrophy and disability.(9;29;30) A recent report, however, documented good correlations between GM atrophy and neurological disability 20 years after CIS.(31) In the current study, we measured gray matter atrophy at all stages of MS to determine its relationship to disability progression. A limitation of this and other observational studies relates to variable use of disease modifying drugs during the follow up, which could affect both progression rates, atrophy rates, and the relationship between atrophy and disability progression.
Despite that limitation, there were a number of interesting findings. First, we found that baseline levels of brain atrophy correlated with EDSS ≥ 6.0 at a follow up 6.5 years later. This replicates in a separate population our prior report that BPF and the rate of BPF worsening in RRMS predicted EDSS ≥ 6.0 status after an 8 year interval(32). The new findings further demonstrate that both GM and WM atrophy predict the EDSS 6.0 milestone. Second, we observed a significant correlation between brain atrophy and disability progression measured using MSFC. Patients with disability progression measured with MSFC had significantly higher rates of whole brain atrophy, and gray matter atrophy, but not white matter atrophy. Gray matter atrophy was increased 14.1 fold over HCs in patients with MSFC disability progression, compared with 6.3 fold increased in patients stable by MSFC. White matter atrophy was similar in patients with MSFC disability progression (2.8-fold increased) and MSFC stable patients (3.9-fold increased). These data suggest that gray matter pathology underlies disability progression measured by MSFC. This is the first report defining sustained disability progression using the MSFC, although 20% worsening on quantitative measures of neurologic function, including components of the MSFC, have been suggested by others(33).
An important and unique finding in this study was that disability progression measured by EDSS did not correlate with whole brain, GM, or WM atrophy, while MSFC disability progression did. This was explained by relatively low concordance between disability progression defined by the two measures. The rate of concordance between MSFC and EDSS progression was 62%, indicating that the two scales indentified overlapping but distinct patient populations. The question arises as to why atrophy correlations were evident with MSFC but not EDSS. Conceivably, patients with disability progression from spinal cord disease were identified using EDSS but missed by MSFC. EDSS is known to be sensitive to ambulation, and insensitive to other dimensions including cognition. Also, one study showed minimal correlation between spinal cord atrophy and brain atrophy(34). However, it seems unlikely that EDSS would identify progressive spinal cord dysfunction but MSFC would not, since MSFC progression is largely determined by changes in walking and arm function, two dimensions that are measured by MSFC components. Our data suggests that EDSS incorrectly classifies disability progression in two ways. First, EDSS was less sensitive than MSFC in identifying disability progression in patients with higher levels of disability. This is consistent with a prior finding that patients with SPMS had stable EDSS scores but deteriorated on quantitative tests of walking and arm function(33). EDSS appears to be insensitive to disease worsening in SPMS patients, obscuring the relationship between disability progression and brain atrophy. Secondly, EDSS classified a number of patients as having disability progression who had stable MSFC scores, and mild MS with low EDSS scores. This would have the effect of further diluting atrophy correlations, by incorrectly classifying patients who had changes on neurological exam but no disability. Presumably, imprecision in the EDSS instrument at this level of the scale contributed to incorrect classification, as suggested by the finding that sustained improvement in EDSS occurs very frequently in RRMS(35). MSFC progression was more closely related to brain atrophy, suggesting that MSFC is more suited as an outcome measure for clinical trials. The data raise concerns about the use of EDSS progression as a disability measure in RRMS because it misclassifies patients as disability progression, and also raise concerns about using EDSS to define disability progression in SPMS, where it appears to be insensitive to disease progression measured using brain atrophy or MSFC.
The results of this study further document the relevance of brain atrophy progression, demonstrate that GM atrophy but not WM atrophy correlates with disability progression, and suggest that MSFC should be used to define disability progression. The results imply that therapeutic interventions should be tested for their effects on the rate of GM atrophy progression.
Acknowledgments
This study was supported by the National Institutes of Health NINDS (P01-NS38667) and the National Multiple Sclerosis Society (RG-3099-A). The authors would like to thank Patricia Jagodnik for help with image data management and image analysis, Dee Ivancic, and Claire Hara-Cleaver for assistance with patient visits, Swati Chakraborty, Vicky Konig, and Alan Liu for database development and management, and all the patients and volunteers who kindly agreed to participate in this long-term follow-up study.
Footnotes
Publisher's Disclaimer: This is a PDF file of an unedited manuscript that has been accepted for publication. As a service to our customers we are providing this early version of the manuscript. The manuscript will undergo copyediting, typesetting, and review of the resulting proof before it is published in its final citable form. Please note that during the production process errors may be discovered which could affect the content, and all legal disclaimers that apply to the journal pertain.
Reference List
- 1.Pirko I, Lucchinetti CF, Sriram S, Bakshi R. Gray matter involvement in multiple sclerosis. Neurology. 2007 Feb 27;68(9):634–42. doi: 10.1212/01.wnl.0000250267.85698.7a. [DOI] [PubMed] [Google Scholar]
- 2.Kidd D, Barkhof F, McConnell R, Algra PR, Allen IV, Revesz T. Cortical lesions in multiple sclerosis. Brain. 1999 Jan;122(Pt 1):17–26. doi: 10.1093/brain/122.1.17. [DOI] [PubMed] [Google Scholar]
- 3.Peterson JW, Bo L, Mork S, Chang A, Trapp BD. Transected neurites, apoptotic neurons, and reduced inflammation in cortical multiple sclerosis lesions. Ann Neurol. 2001 Sep;50(3):389–400. doi: 10.1002/ana.1123. [DOI] [PubMed] [Google Scholar]
- 4.Kutzelnigg A, Lassmann H. Cortical lesions and brain atrophy in MS. J Neurol Sci. 2005 Jun 15;233(12):55–9. doi: 10.1016/j.jns.2005.03.027. [DOI] [PubMed] [Google Scholar]
- 5.Ge Y, Grossman RI, Udupa JK, Babb JS, Nyul LG, Kolson DL. Brain atrophy in relapsing-remitting multiple sclerosis: fractional volumetric analysis of gray matter and white matter. Radiology. 2001 Sep;220(3):606–10. doi: 10.1148/radiol.2203001776. [DOI] [PubMed] [Google Scholar]
- 6.Tedeschi G, Lavorgna L, Russo P, Prinster A, Dinacci D, Savettieri G, et al. Brain atrophy and lesion load in a large population of patients with multiple sclerosis. Neurology. 2005 Jul 26;65(2):280–5. doi: 10.1212/01.wnl.0000168837.87351.1f. [DOI] [PubMed] [Google Scholar]
- 7.Dalton CM, Chard DT, Davies GR, Miszkiel KA, Altmann DR, Fernando K, et al. Early development of multiple sclerosis is associated with progressive grey matter atrophy in patients presenting with clinically isolated syndromes. Brain. 2004 May;127(Pt 5):1101–7. doi: 10.1093/brain/awh126. [DOI] [PubMed] [Google Scholar]
- 8.Chard DT, Griffin CM, Parker GJ, Kapoor R, Thompson AJ, Miller DH. Brain atrophy in clinically early relapsing-remitting multiple sclerosis. Brain. 2002 Feb;125(Pt 2):327–37. doi: 10.1093/brain/awf025. [DOI] [PubMed] [Google Scholar]
- 9.Tiberio M, Chard DT, Altmann DR, Davies G, Griffin CM, Rashid W, et al. Gray and white matter volume changes in early RRMS: a 2-year longitudinal study. Neurology. 2005 Mar 22;64(6):1001–7. doi: 10.1212/01.WNL.0000154526.22878.30. [DOI] [PubMed] [Google Scholar]
- 10.Chard DT, Griffin CM, Rashid W, Davies GR, Altmann DR, Kapoor R, et al. Progressive grey matter atrophy in clinically early relapsing-remitting multiple sclerosis. Mult Scler. 2004 Aug;10(4):387–91. doi: 10.1191/1352458504ms1050oa. [DOI] [PubMed] [Google Scholar]
- 11.Fisher E, Lee JC, Nakamura K, Rudick RA. Gray matter atrophy in multiple sclerosis: A longitudinal study. Ann Neurol. 2008 Jul 25;64(3):255–65. doi: 10.1002/ana.21436. [DOI] [PubMed] [Google Scholar]
- 12.Polman CH, Reingold SC, Edan G, Filippi M, Hartung HP, Kappos L, et al. Diagnostic criteria for multiple sclerosis: 2005 revisions to the “McDonald Criteria”. Ann Neurol. 2005 Dec;58(6):840–6. doi: 10.1002/ana.20703. [DOI] [PubMed] [Google Scholar]
- 13.Cutter GR, Baier ML, Rudick RA, Cookfair DL, Fischer JS, Petkau J, et al. Development of a multiple sclerosis functional composite as a clinical trial outcome measure. Brain. 1999 May;122(Pt 5):871–82. doi: 10.1093/brain/122.5.871. [DOI] [PubMed] [Google Scholar]
- 14.Rudick RA, Fisher E, Lee JC, Simon J, Jacobs L. Use of the brain parenchymal fraction to measure whole brain atrophy in relapsing-remitting MS. Multiple Sclerosis Collaborative Research Group. Neurology. 1999 Nov 10;53(8):1698–704. doi: 10.1212/wnl.53.8.1698. [DOI] [PubMed] [Google Scholar]
- 15.Nakamura K, Fisher E. Segmentation of brain magnetic resonance images for measurement of gray matter atrophy in multiple sclerosis patients. NeuroImage. 2008 doi: 10.1016/j.neuroimage.2008.09.059. [DOI] [PMC free article] [PubMed] [Google Scholar]
- 16.Miller DH, Barkhof F, Frank JA, Parker GJ, Thompson AJ. Measurement of atrophy in multiple sclerosis: pathological basis, methodological aspects and clinical relevance. Brain. 2002 Aug;125(Pt 8):1676–95. doi: 10.1093/brain/awf177. [DOI] [PubMed] [Google Scholar]
- 17.Bermel RA, Bakshi R. The measurement and clinical relevance of brain atrophy in multiple sclerosis. Lancet Neurol. 2006 Feb;5(2):158–70. doi: 10.1016/S1474-4422(06)70349-0. [DOI] [PubMed] [Google Scholar]
- 18.Fisher E. Measurement of central nervous system atrophy. In: Cohen J, Rudick R, editors. Multiple Sclerosis Therapeutics. London: Informa Healthcare; 2007. pp. 173–99. [Google Scholar]
- 19.Brex PA, Jenkins R, Fox NC, Crum WR, O'Riordan JI, Plant GT, et al. Detection of ventricular enlargement in patients at the earliest clinical stage of MS. Neurology. 2000 Apr 25;54(8):1689–91. doi: 10.1212/wnl.54.8.1689. [DOI] [PubMed] [Google Scholar]
- 20.Fisher E, Rudick RA, Simon JH, Cutter G, Baier M, Lee JC, et al. Eight-year follow-up study of brain atrophy in patients with MS. Neurology. 2002 Nov 12;59(9):1412–20. doi: 10.1212/01.wnl.0000036271.49066.06. [DOI] [PubMed] [Google Scholar]
- 21.Filippi M, Rovaris M, Inglese M, Barkhof F, De SN, Smith S, et al. Interferon beta-1a for brain tissue loss in patients at presentation with syndromes suggestive of multiple sclerosis: a randomised, double-blind, placebo-controlled trial. Lancet. 2004 Oct 23;364(9444):1489–96. doi: 10.1016/S0140-6736(04)17271-1. [DOI] [PubMed] [Google Scholar]
- 22.Molyneux PD, Kappos L, Polman C, Pozzilli C, Barkhof F, Filippi M, et al. The effect of interferon beta-1b treatment on MRI measures of cerebral atrophy in secondary progressive multiple sclerosis. European Study Group on Interferon beta-1b in secondary progressive multiple sclerosis. Brain. 2000 Nov;123(Pt 11):2256–63. doi: 10.1093/brain/123.11.2256. [DOI] [PubMed] [Google Scholar]
- 23.Filippi M, Rovaris M, Iannucci G, Mennea S, Sormani MP, Comi G. Whole brain volume changes in patients with progressive MS treated with cladribine. Neurology. 2000 Dec 12;55(11):1714–8. doi: 10.1212/wnl.55.11.1714. [DOI] [PubMed] [Google Scholar]
- 24.Fox NC, Jenkins R, Leary SM, Stevenson VL, Losseff NA, Crum WR, et al. Progressive cerebral atrophy in MS: a serial study using registered, volumetric MRI. Neurology. 2000 Feb 22;54(4):807–12. doi: 10.1212/wnl.54.4.807. [DOI] [PubMed] [Google Scholar]
- 25.Ge Y, Grossman RI, Udupa JK, Wei L, Mannon LJ, Polansky M, et al. Brain atrophy in relapsing-remitting multiple sclerosis and secondary progressive multiple sclerosis: longitudinal quantitative analysis. Radiology. 2000 Mar;214(3):665–70. doi: 10.1148/radiology.214.3.r00mr30665. [DOI] [PubMed] [Google Scholar]
- 26.Kalkers NF, Ameziane N, Bot JC, Minneboo A, Polman CH, Barkhof F. Longitudinal brain volume measurement in multiple sclerosis: rate of brain atrophy is independent of the disease subtype. Arch Neurol. 2002 Oct;59(10):1572–6. doi: 10.1001/archneur.59.10.1572. [DOI] [PubMed] [Google Scholar]
- 27.Lumsden CE. The neuropathology of multiple sclerosis. In: Vinken PJ, Bruyn GW, editors. Handbook of Clinical Neurology. New York: American Elsevier; 1970. p. 217. [Google Scholar]
- 28.Adams R, Richardson E. The demyelinative diseases of the human nervous system. In: Folch-Pi J, editor. Chemical Pathology of the Nervous System. Oxford: Pergamon Press; 1961. p. 163. [Google Scholar]
- 29.Oreja-Guevara C, Rovaris M, Iannucci G, Valsasina P, Caputo D, Cavarretta R, et al. Progressive gray matter damage in patients with relapsing-remitting multiple sclerosis: a longitudinal diffusion tensor magnetic resonance imaging study. Arch Neurol. 2005 Apr;62(4):578–84. doi: 10.1001/archneur.62.4.578. [DOI] [PubMed] [Google Scholar]
- 30.Sastre-Garriga J, Ingle GT, Chard DT, Ramio-Torrenta L, Miller DH, Thompson AJ. Grey and white matter atrophy in early clinical stages of primary progressive multiple sclerosis. NeuroImage. 2004 May;22(1):353–9. doi: 10.1016/j.neuroimage.2004.02.008. [DOI] [PubMed] [Google Scholar]
- 31.Fisniku LK, Chard DT, Jackson JS, Anderson VM, Altmann DR, Miszkiel KA, et al. Gray matter atrophy is related to long-term disability in multiple sclerosis. Ann Neurol. 2008 Jun 20;64(3):247–54. doi: 10.1002/ana.21423. [DOI] [PubMed] [Google Scholar]
- 32.Fisher E, Rudick RA, Cutter G, Baier M, Miller D, Weinstock-Guttman B, et al. Relationship between brain atrophy and disability: an 8-year follow-up study of multiple sclerosis patients. Mult Scler. 2000 Dec;6(6):373–7. doi: 10.1177/135245850000600602. [DOI] [PubMed] [Google Scholar]
- 33.Schwid SR, Goodman AD, Mattson DH, Mihai C, Donohoe KM, Petrie MD, et al. The measurement of ambulatory impairment in multiple sclerosis. Neurology. 1997 Nov;49(5):1419–24. doi: 10.1212/wnl.49.5.1419. [DOI] [PubMed] [Google Scholar]
- 34.Zivadinov R, Banas AC, Yella V, Abdelrahman N, Weinstock-Guttman B, Dwyer MG. Comparison of three different methods for measurement of cervical cord atrophy in multiple sclerosis. AJNR Am J Neuroradiol. 2008 Feb;29(2):319–25. doi: 10.3174/ajnr.A0813. [DOI] [PMC free article] [PubMed] [Google Scholar]
- 35.Ebers GC, Heigenhauser L, Daumer M, Lederer C, Noseworthy JH. Disability as an outcome in MS clinical trials. Neurology. 2008 Aug 26;71(9):624–31. doi: 10.1212/01.wnl.0000313034.46883.16. [DOI] [PubMed] [Google Scholar]