Abstract
Objectives
Determination of causes, trends, and antibiotic resistance in reports of bacterial pathogens isolated from blood in England and Wales from 1990 to 1998.
Design
Description of bacterial isolates from blood, judged to be clinically significant by microbiology staff, reported to the Communicable Disease Surveillance Centre.
Setting
Microbiology laboratories in England and Wales.
Subjects
Patients yielding clinically significant isolates from blood.
Main outcome measures
Frequency and Poisson regression analyses for trend of reported causes of bacteraemia and proportions of antibiotic resistant isolates.
Results
There was an upward trend in total numbers of reports of bacteraemia. The five most cited organisms accounted for over 60% of reports each year. There was a substantial increase in the proportion of reports of Staphylococcus aureus resistant to methicillin, Streptococcus pneumoniae resistance to penicillin and erythromycin, and Enterococcus faecalis and Enterococcus faecium resistance to vancomycin. No increase was seen in resistance of Escherichia coli to gentamicin.
Conclusions
Reports from laboratories provide valuable information on trends and antibiotic resistance in bacteraemia and show a worrying increase in resistance to important antibiotics.
Introduction
Culture of blood is a fundamental investigation in infection. Illness associated with bacteraemia ranges from self limiting infection to life threatening sepsis that requires rapid and aggressive antimicrobial treatment,1 which is complicated by increasing antibioticresistance worldwide.2–5 Information on trends and antibiotic resistance in bacteraemia is needed to inform prescribing and infection control policy and to guide development of new antibiotics and vaccines.1,3–7
Since 1989 blood isolates judged to be clinically significant by microbiologists working in laboratories in England and Wales have been reported to thePublic Health Laboratory Service Communicable Disease Surveillance Centre; this moved from paper to electronic transmission with EpiBase8 then CoSurv.9 Trends in resistance to key antibiotics have been published for Staphylococcus aureus,10,11 Streptococcus pneumoniae,12 and Escherichia coli.13 Here we present the first overall description of the system and causative organisms with further information on antibiotic resistance.
Methods
Blood isolates reported to the surveillance centre from 1990 to 1998 were entered on a computer database (LabBase).8 Replicate reports were identified by matching on date of birth, sex, specimen date, organism, antibiotic susceptibility, and source laboratory and merged if the specimen dates were less than eight days apart. This was undertaken manually from 1990 to 1994 and then by computer program.
We identified laboratories in England and Wales that reported blood isolates to the surveillance centre in 1998 from the Directory of the Association of Medical Microbiologists.14 Annual total bacteraemias and annual counts for each of 34 “categories” of bacteraemia defined by causative organism15 were analysed by Poisson regression analysis.16 Categories showing a year on year proportional increase were further analysed within age groups. The causes of bacteraemia between age groups were examined. Trends in the proportion resistant were determined for the subset of reports with a completed antibiotic susceptibility field. Intermediate resistance was recorded in less than 0.7% of reports and was counted as resistance.
Results
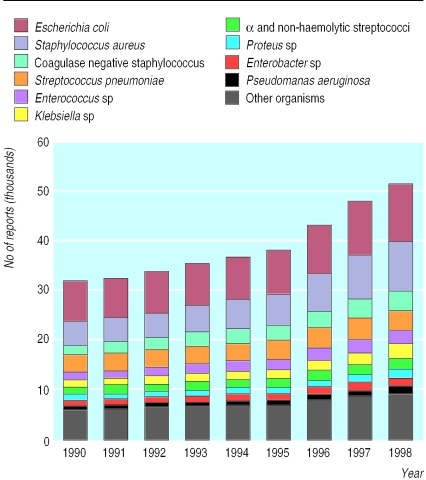
Of 229 laboratories identified in England and Wales in the directory,14 208 (91%) reported blood isolates to the surveillance centre in 1998. Reports increased from31 763in 1990 to 51 232 in 1998(P<0.05) (fig 1). E coli, Staph aureus, coagulase negative staphylococci, Strep pneumoniae, and either Enterococcus species (including E faecium, E faecalis, and group D streptococci)or Klebsiella species (fig 1) accounted for 60% of all reports each year. A further 20% comprised either Klebsiella species or Enterococcus species, α and non-haemolytic streptococci (other than pneumococci), and Proteus species, Enterobacter species, and Pseudomonas aeruginosa.
Figure 1.
Incidence of commonly reported causes of bacteraemia in England and Wales, 1990 to 1998
Poisson regression showed a year on year proportional increase for seven categories (table 1) that was also present within each age group. Haemophilus influenzae declinedsteeply from 1992. Most reports were from adults but the reporting rate was high in infants: 1149 reports for infants aged 0-28 days and 1169 for infants aged 29 to 365 days in 1998 (table 2).
Table 1.
Causative organisms of bacteraemia, showing year on year proportional increasing trend by Poisson regression analysis, 1990-8
| Category of bacteraemia | % Annual increase (95% CI) |
|---|---|
| Corynebacterium spp and diphtheroids | 16.9 (14.7 to 19.1) |
| Acinetobacter spp | 16.7 (15.2 to 18.1) |
| Serratia spp* | 14.7 (13 to 16.5) |
| Citrobacter spp | 9.2 (7.6 to 10.9) |
| Enterobacter spp | 9.0 (8.2 to 9.8) |
| Group C streptococci | 6.4 (3.7 to 9.2) |
| α and non-haemolytic streptococci (excluding pneumococci)* | 6.2 (5.5 to 6.9) |
Approximately log linear.
Table 2.
Numbers of reports of bacteraemia and report rate per 100 000 by age group in England and Wales, 1998. Denominators for rates were mid-year population estimates for England and Wales (Office for National Statistics, London)
| Age group (years) | No of reports (thousands) | No of reports per 100 000 |
|---|---|---|
| <1 | 2.318 | 366.19 |
| 1-4 | 1.256 | 48.03 |
| 5-9 | 0.618 | 17.88 |
| 10-14 | 0.484 | 14.51 |
| 15-44 | 6.985 | 31.76 |
| 45-64 | 10.853 | 89.67 |
| 65-74 | 10.466 | 237.84 |
| ⩾75 | 17.000 | 437.30 |
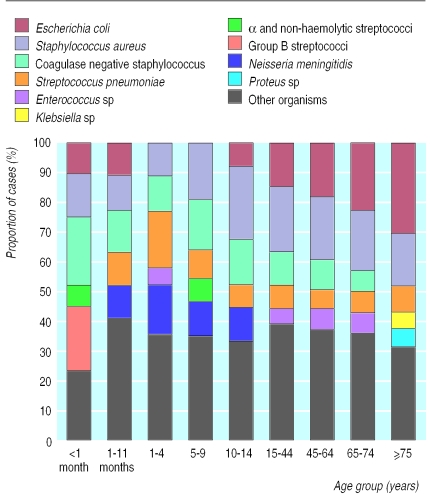
Staph aureus was among the top five causes of bacteraemia in every age group,whereas E coli, coagulase negative staphylococci, Strep pneumoniae, and Enterococcus species ranked lower at certain ages (fig 2). α and non-haemolytic streptococci (excluding pneumococci) accounted for 5-7% of bacteraemiasin children of all ages and for 2-4% aged over 14 years. Group B streptococci comprised 22% of reports in infants aged 0 to 28 days, 5% in infants aged 29 days to 1 year, were rare in children aged between 1and14 years (three reports in 1998), but contributed 1-2% in the adult age groups. Neisseria meningitidis accounted for 11-17%of reports in age groups from birth to 14 years,2% from 15 to 44 years, and less than 1% in older age groups. The proportion of reports contributed by each age group to each category of bacteraemia was similar in every year.
Figure 2.
Common causes of bacteraemia by age group as proportion of total reports for England and Wales, 1998 (age group <1 month equals ⩽28 days; 1-11 months equals 29-365 days)
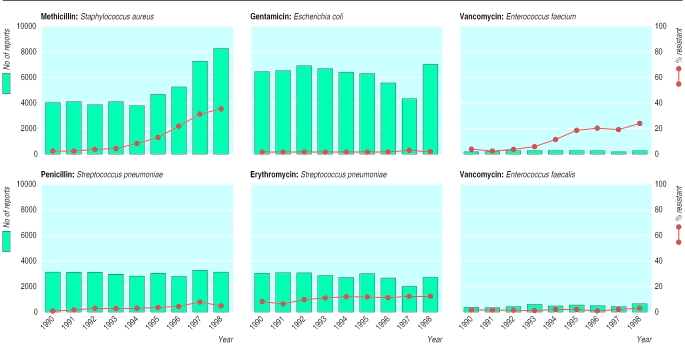
The subset of reports with completion of the antibiotic susceptibility field generally declined in 1996 and 1997 and recovered in 1998 (fig 3). Methicillin resistance in Staph aureus increased from 1.7% to 3.8% from 1990 to 1993, rose steeply to 32% in 1997 and to 34% in 1998 (fig 3). Gentamicin resistance in E coli increased from 1.7% in 1990 to 3% in 1997 declining to 2.2% in 1998. Vancomycin resistance in Ent faecium reached 6.3% in 1993, 20% in 1995, and 24% in 1998. Vancomycin resistance in Ent faecalis was under 3% from 1990 to 1996, increasing to 5% in 1998. Ampicillin resistance, however, was recorded in 15% of Ent faecalis and ampicillin sensitivity in 17% of Ent faecium reports in 1998, suggesting frequent mis-speciation. Penicillin resistance in Strep pneumoniae was under 1% in 1990 and 1991, increasing to 3.7% in 1996, to 7.4% in 1997, and 3.6% in 1998. Erythromycin resistance in Strep pneumoniae increased from 5% in 1990 to stabilise at about 11% from 1994 onwards.
Figure 3.
Antibiotic resistance ((number resistant + number intermediate)/(number resistant + number intermediate + number sensitive) x 100) in bacteraemia isolates (lines) and numbers of reports with antibiotic susceptibility data (bars) in England and Wales, 1990 to 1998
Discussion
The number of reports increased yearly; a steep increase between 1996 and 1998 (fig 1) coincided with efforts to encourage reporting, including “free” installation of CoSurv9 into laboratories, but the number bearing data on antimicrobial susceptibility did not increase except for methicillin against Staph aureus (fig 3). This was probably due to problems in the introduction of CoSurv and different degrees of effort in chasing up missing results for each antimicrobial susceptibility. Increased reporting may also have reflected rising incidence due to improved survival of severely ill patients.17,18
What is already known on this subject
Bacteraemia series from laboratories and programmes of nosocomial infection surveillance are generally derived from individual or small numbers of institutions
The collated data may be unrepresentative of the general population and inferences may lack precision because of the small number of reports
The need for representative and precise information on the causes and trends in antibiotic resistance in blood stream infections at national level made an overview of the system desirable at this time
What this paper adds
Over 90% of laboratories in England and Wales reported clinically significant blood isolates to the communicable disease surveillance centre in 1998, with total reports ranging from about 30 000 in 1990 to 50 000 in 1998
This reporting system probably captures information on a sizeable proportion of episodes of bacteraemia at national level
The value of this system for national level monitoring of antibiotic resistance and trends in the causes of bacteraemia has been demonstrated; regional analyses with multivariable methods may prove useful in the future
The causes of bacteraemia were similar to those seen in other large series.17–19 Categories with a marked upward trend (table 1) are a priority for further research. The trend for Corynebacterium species and diphtheroids may reflect a change from regarding these organisms as skin contaminants to being clinically significant, as occurred for coagulase negative staphylococci.20 Marked increases in Acinetobacter species, Serratia species, Citrobacter species, and Enterobacter species may reflect their facility to develop mutational resistance to cephalosporin antibiotics, which were used increasingly during the survey period. We found no shift to Gram positive organisms as reported elsewhere.1,17–20 This may have occurred before the study period or be specific to certain patient groups, such as patients with neutropaenia. The fall in H influenzae followed introduction of Hib immunisation in 1992.21
The rise in antibiotic resistance in blood isolates emphasises the importance of sound hospital infection control,6,7 rational prescribing policies, and the need for new antimicrobial drugs and vaccines.3–5 Validation of reported data on resistance has been undertaken by comparison with centralised testing of nationallyrepresentative sample strains.13 Regional analyses have been developed for methicillinagainst Staph aureus22 (http://www.phls.co.uk/facts/bact.htm). Further analysis of these data could include the determination of the independent effect on antibiotic resistance of region, year, age, and sex by using multivariable methods.16 This national reporting system should complement local surveillance of bacteraemia in which extensive data on risk factors may be collected.23,24
Acknowledgments
We thank the microbiology laboratory staff in England and Wales for reporting isolates to the surveillance centre.
Editorial by Amyes
Footnotes
Funding: Public Health Laboratory Service.
Competing interests: None declared.
References
- 1.Young LS. Sepsis syndrome. In: Mandell GL, Bennett JE, Dolin R, editors. Principles and practice of infectious diseases. New York: Churchill Livingstone; 1995. pp. 690–705. [Google Scholar]
- 2.Livermore D, MacGowan AP, Wale MCJ. Surveillance of antimicrobial resistance. BMJ. 1998;317:614–615. doi: 10.1136/bmj.317.7159.614. [DOI] [PMC free article] [PubMed] [Google Scholar]
- 3.House of Lords Select Committee on Science and Technology. Resistance to antibiotics and other antimicrobial agents. London: Stationery Office; 1998. [Google Scholar]
- 4.Standing Medical Advisory Committee: Subgroup on Antimicrobial Resistance. The path of least resistance. London: Department of Health; 1998. [Google Scholar]
- 5.Wise R, Hart T, Cars O, Streulens M, Helmuth R, Huovinen P, et al. Antimicrobial resistance is a major threat to public health. BMJ. 1998;317:609–610. doi: 10.1136/bmj.317.7159.609. [DOI] [PMC free article] [PubMed] [Google Scholar]
- 6.Duckworth G, Cookson B, Humphreys H, Heathcock R. Working party report: revised guidelines for the control of methicillin-resistant Staphylococcus aureus infection in hospitals. J Hosp Infect. 1998;39:253–290. doi: 10.1016/s0195-6701(98)90293-6. [DOI] [PubMed] [Google Scholar]
- 7.Hospital Infection Working Group of the Department of Health and the Public Health Laboratory Service. Hospital infection control: guidance on the control of infection in hospitals. London: Department of Health; 1995. [Google Scholar]
- 8.Grant AD, Eke E. Application of information technology to the laboratory reporting of communicable disease in England and Wales. Commun Dis Rep CDR Rev. 1993;3:R75–R78. [PubMed] [Google Scholar]
- 9.Henry R. CoSurv: a regional computing strategy for communicable disease surveillance. PHLS Microbiol Digest. 1996;13:26–28. [Google Scholar]
- 10.Speller DCE, Johnson AP, James D, Marples RR, Charlett A, George RC. Resistance to methicillin and other antibiotics in isolates of Staphylococcus aureus from blood and cerebrospinal fluid, England and Wales, 1989-95. Lancet. 1997;350:323–325. doi: 10.1016/s0140-6736(97)12148-1. [DOI] [PubMed] [Google Scholar]
- 11.Johnson AP, James D, Livermore DM. Increasing prevalence of methicillin-resistance amongst Staphylococcus aureus blood culture isolates. J Antimicrob Chemother. 1999;43:160. doi: 10.1093/jac/43.1.160. [DOI] [PubMed] [Google Scholar]
- 12.Laurichesse H, Grimaud O, Waight P, Johnson AP, George RC, Miller E. Pneumococcal bacteraemia and meningitis in England and Wales, 1993 to 1995. Commun Dis Publ Hlth. 1998;1:22–27. [PubMed] [Google Scholar]
- 13.Livermore DM, Threlfall EJ, Reacher MH, Johnson AP, James D, Cheasty T, et al. Are routine sensitivity test data suitable for the surveillance of resistance? Resistance rates amongst Escherichia coli from blood and CSF from 1991-97 as assessed by routine and centralised testing. J Antimicrob Chemother (in press). [DOI] [PubMed]
- 14.Anonymous. AMM directory: medical microbiology services in the United Kingdom and the Republic of Ireland. St Leonards on Sea: Association of Medical Microbiologists; 1998. pp. 139–143. [Google Scholar]
- 15.Anonymous. Look inside: the presentation of bacteraemia data in the CDR weekly has changed. Commun Dis Report CDR Wkly. 1997;7:13. [Google Scholar]
- 16.Clayton D, Hills M. Statistical models in epidemiology. Oxford: Oxford University Press; 1993. Poisson and logistic regression; pp. 227–236. [Google Scholar]
- 17.Bannerjee SN, Emori TG, Culver DH, Gaynes RP, Jarvis WR, Horan T, et al. Secular trends in nosocomial bloodstream infections in the United States. Am J Med. 1991;91(suppl 3B):86–9S. doi: 10.1016/0002-9343(91)90349-3. [DOI] [PubMed] [Google Scholar]
- 18.Pittet D, Wenzel RP. Nosocomial bloodstream infections. Arch Int Med. 1995;155:1177–1184. doi: 10.1001/archinte.155.11.1177. [DOI] [PubMed] [Google Scholar]
- 19.Cockerill FR, Hughes JG, Vetter EA, Mueller RA, Weaver A L, Ilstrup DM, et al. Analysis of 281,797 consecutive blood cultures performed over an eight-year period: trends in micro-organisms isolated and the value of anaerobic culture of blood. Clin Infect Dis. 1997;24:403–418. doi: 10.1093/clinids/24.3.403. [DOI] [PubMed] [Google Scholar]
- 20.Johnson AP. Antibiotic resistance among clinically important Gram positive bacteria in the UK. J Hosp Infect. 1998;40:17–26. doi: 10.1016/s0195-6701(98)90020-2. [DOI] [PubMed] [Google Scholar]
- 21.Hargreaves RM, Slack MPE, Howard AJ, Anderson E, Ramsay ME. Changing patterns of invasive Haemophilus influenzae disease in England and Wales after introduction of the Hib vaccination programme. BMJ. 1996;312:160–161. doi: 10.1136/bmj.312.7024.160. [DOI] [PMC free article] [PubMed] [Google Scholar]
- 22.Anonymous. Staphylococcus aureus bacteraemia: England and Wales, January to March 1999. Commun Dis Rep CDR Wkly. 1999;9:185. [Google Scholar]
- 23.Anonymous. Nosocomial infection national surveillance scheme. Commun Dis Report CDR Wkly. 1996;6:83. [Google Scholar]
- 24.Anonymous. National nosocomial infections surveillance (NNIS) system report, data summary from October 1986-April 1998, issued June 1998. Am J Infect Control. 1998;26:522–533. doi: 10.1016/s0196-6553(98)70026-4. [DOI] [PubMed] [Google Scholar]


