Recent articles in EMBO reports have addressed the issues of decreasing research funding (Wolinsky, 2009) and the importance of research evaluation (Bornmann & Daniel, 2009). Both topics are directly connected to one other. In the light of stagnant or even decreasing private and public funding for research, precise rules for funding policies have become indispensable in order to identify good research projects and proposals. The use of benchmarking systems to assess the quality of research is therefore an important feature of implementing an efficient funding policy. Although individual scientometric and bibliometric methods can be used to analyse the research activities of faculties or single scientists, these techniques often do not provide a larger picture of scientific quality and quantity in relation to funding. Without the use of scientometric methods and other techniques to analyse whether existing funding schemes are successful or not, there will be a growing disrespect for funding policies among scientists. To address this, we present an example of how to visualize research quantity and quality across the European Union (EU).
Reviews of European research funding and other comments make it clear that the EU needs to improve its research strategy (Fricker, 2007; Kingdon, 2006; Mayor, 2007; Watts, 2008). In this respect, a recent news report stated that “European science is not as intense as hoped” (Clery, 2009). Although research activities in the EU increased between 2000 and 2006, research spending as a percentage of the gross domestic product (GDP) was stuck at about 1.84. However, many scientists argue that the success of European science should not only be measured in terms of ‘work force' and spending, but also in terms of its actual output—that is, publications.
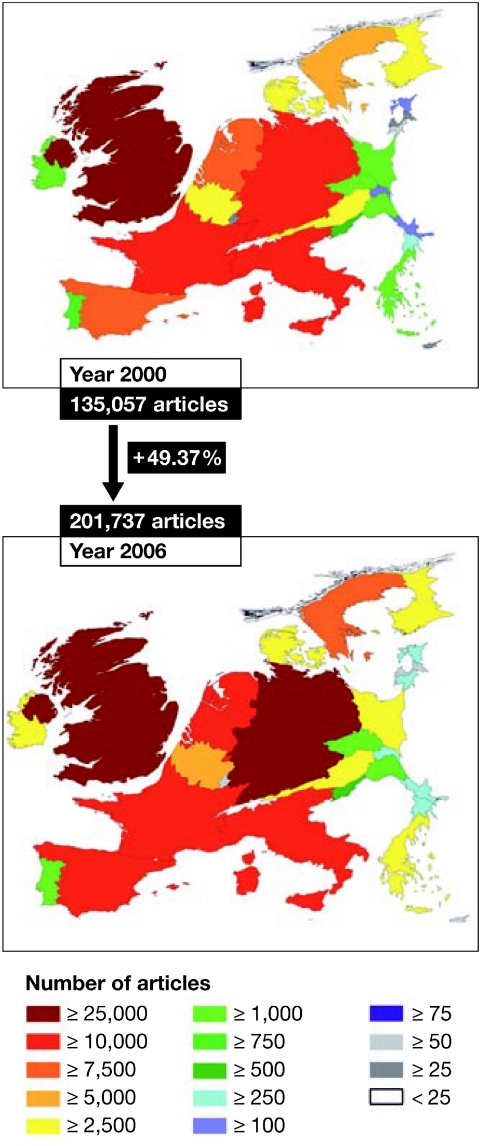
A combination of scientometric tools and new visualizing techniques such as density equalizing mapping (Gastner & Newman, 2004; Groneberg-Kloft et al, 2008), shows that research in the EU has actually developed well: the total number of publications from European research groups in all journals listed in PubMed increased between 2000 and 2006 (Table 1; Fig 1). In this regard, the number of European publications has increased by 49.37%. The growth in scientific publications ranges from 24.09% in Finland, to 37.02% in the UK and 44.09% in Germany, to immense increases of 162.12% in Portugal and 402.70% in Lithuania (Table 1). This increase correlates significantly with the GDP of each country, adjusted to the purchasing power parity index (2000: r = 0.90, P = 0.01; 2006: r = 0.92, P = 0.01).
Table 1.
Analysis of national research output in 2006 compared with 2000
| Position | Country | 2000 | 2006 | Increase (%) |
|---|---|---|---|---|
| 1 | Lithuania | 74 | 372 | 402.70 |
| 2 | Portugal | 821 | 2,152 | 162.12 |
| 3 | Greece | 1,847 | 4,763 | 157.88 |
| 4 | Romania | 177 | 405 | 128.81 |
| 5 | Poland | 2,395 | 4,874 | 103.51 |
| 6 | Czech Republic | 1,129 | 2,194 | 94.33 |
| 7 | Estonia | 135 | 260 | 92.59 |
| 8 | Spain | 7,886 | 14,758 | 87.14 |
| 9 | Cyprus | 39 | 71 | 82.05 |
| 10 | Slovakia | 199 | 360 | 80.90 |
| 11 | Latvia | 33 | 59 | 78.79 |
| 12 | Luxembourg | 41 | 69 | 68.29 |
| 13 | Ireland | 1,515 | 2,513 | 65.87 |
| 14 | Italy | 13,990 | 22,839 | 63.25 |
| 15 | Belgium | 3,891 | 6,124 | 57.39 |
| 16 | Bulgaria | 302 | 469 | 55.30 |
| 17 | Netherlands | 8,833 | 13,567 | 53.59 |
| 18 | Hungary | 1,274 | 1,934 | 51.81 |
| 19 | Austria | 2,780 | 4,057 | 45.94 |
| 20 | Denmark | 3,379 | 4,871 | 44.16 |
| 21 | Germany | 22,840 | 32,911 | 44.09 |
| 22 | United Kingdom | 34,387 | 47,118 | 37.02 |
| 23 | Slovenia | 531 | 701 | 32.02 |
| 24 | France | 16,800 | 22,161 | 31.91 |
| 25 | Sweden | 7,034 | 9,214 | 30.99 |
| 26 | Finland | 3,362 | 4,172 | 24.09 |
| 27 | Malta | 19 | 21 | 10.53 |
Figure 1.
Density-equalizing maps illustrating the number of published articles in the PubMed library for each EU country in 2000 and 2006. Colors encode the number of contributions per country.
The increase in the total number of published articles is a quantitative marker. To assess qualitative or semi-qualitative parameters, we used citation indices—total citation numbers or average citation per publication—from the Web of Science (WoS) database. The data were analysed for the total number of articles from a specific country, the total number of citations for a specific country, the average number of citations per published item for countries with at least 30 published articles, and any bilateral research cooperations.
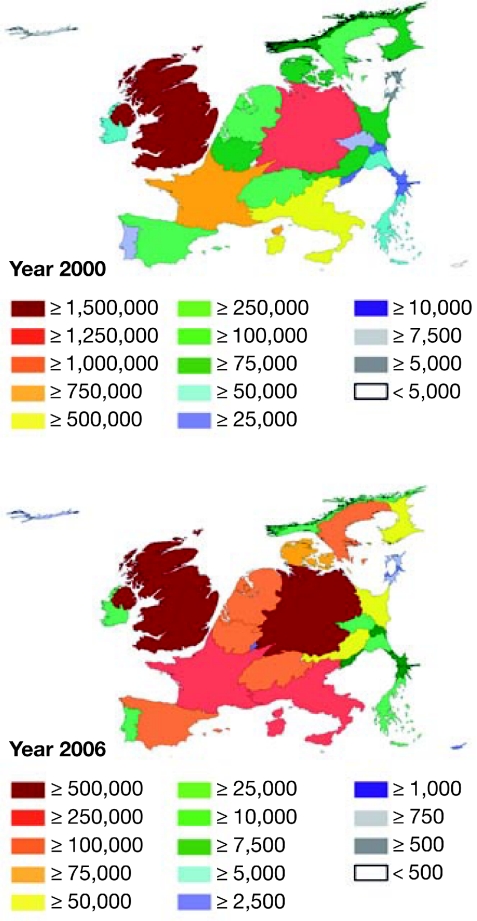
A total of 808,287 published items were identified and analysed; 367,777 items from 2000 and 440,510 (+19.78%) from 2006. This number shows some differences between the data held by PubMed and WoS, owing to the different sources—journals, conference proceedings, for example—that each includes. Although both databases report an increase in the total number of published items, the total number of citations does not follow this trend: citation numbers were higher in 2000 than in 2006 (Fig 2). The UK leads the field (with 1,604,858 citations for publications from 2000 and 636,058 citations for publications from 2006), followed by Germany (1,274,584 citations for 2000 and 525,734 citations for 2006), France (884,152 for 2000 and 367,227 for 2006), Italy (567,897 for 2000 and 284,768 for 2006), the Netherlands (457,555 for 2000 and 208,591 for 2006) and Switzerland (368,537 for 2000 and 167,945 for 2006). However, this finding is biased by the timing of the analysis; the articles published in 2000 have accumulated citations over a period of more than nine years, whereas the articles published in 2006 have only been citable for three years and have consequently received fewer citations. A future re-analysis—perhaps in 2011—could compare the citations of articles published in 2000 accumulated over a five-year period (2000–2004) with the citations of articles published in 2006 over a similar five-year period (2006–2010). This could lead to more objective results.
Figure 2.
Density-equalizing maps illustrating the overall number of citations in the Web of Science data base for publications from EU countries in 2000 and 2006. Colors encode the number of citations per country.
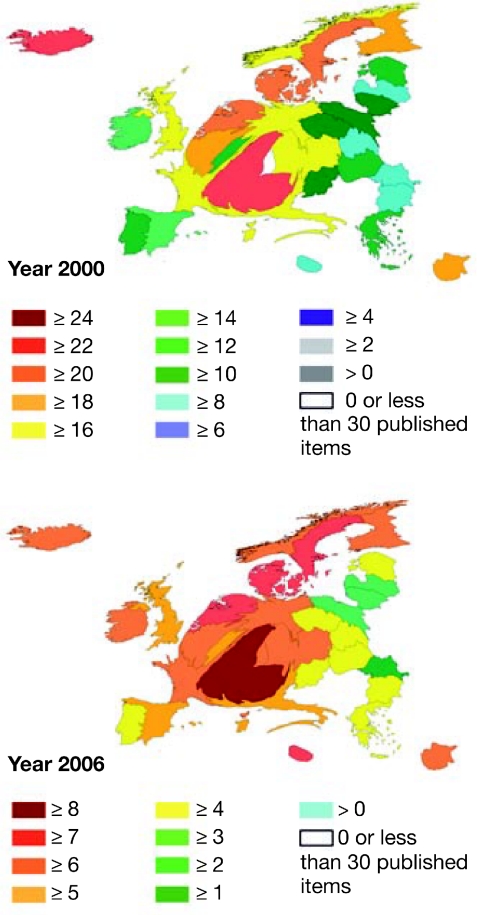
We also calculated the average citations per item as a second quality index. Here, smaller countries with lower overall numbers of publications dominated. In 2000, Switzerland led with an index of 23.77 citations per published item, followed by Iceland (23.65), Monaco (21.47), Denmark (21.37), the Netherlands (20.94), Sweden (20.55) and Finland (19.93). The UK had an index of 16.14, Italy 16.09, France 17.04 and Germany 17.09.
In the year 2006, the indices were lower owing to the timing bias, but small countries dominated again: Switzerland had an average of 8.18 citations per publication, followed by Malta with 7.88, Denmark with 7.58, the Netherlands with 7.25, Sweden with 7.03 and Iceland with 6.97. The UK had an index of 5.99 citations per publication, Italy 5.83, France 6.10 and Germany 6.30. However, a transformation of the data to density equalizing maps revealed a significantly different image (Fig 3) in comparison with the maps of overall numbers of publications (Fig 1) or overall numbers of citations (Fig 2).
Figure 3.
Density-equalizing maps illustrating the average number of citations per publication index for EU countries in 2000 and 2006. Colors encode the average number of citations per publication for each country.
As the amount of bilateral or multilateral cooperations within the EU could act as a semi-qualitative marker, we included these networks in our analysis, which showed an increase in cooperations. From the 367,777 publications analysed from the year 2000, 41,602 were the result of a European cooperation (cooperations outside Europe were not analysed). In 2006, the total number of cooperations was 62,586 out of 440,510 (+50.43%). A chart technique can be used to visualize the bilateral networks in the years 2000 and 2006 (see supplementary information online).
In conclusion, scientometric tools, together with visualizing techniques such as density equalizing maps or radar charts, can be used efficiently to analyse scientific progress and display the results in an easily accessible manner. Moreover, it shows that R&D funding alone is not the only factor that determines the quantity and quality of research output. Future studies should also address parameters such as authorship and institution network analysis to evaluate research proposals on a supranational level.
Supplementary information is available at EMBO reports online (http://www.emboreports.org).
Supplementary Material
Supplementary Figure 1
Supplementary Figure 2
References
- Bornmann L, Daniel HD (2009) The state of h index research. Is the h index the ideal way to measure research performance? EMBO Rep 10: 2–6 [DOI] [PMC free article] [PubMed] [Google Scholar]
- Clery D (2009) Research funding. European science not as intense as hoped. Science 323: 570. [DOI] [PubMed] [Google Scholar]
- Fricker J (2007) Cancer research funding in Europe. Mol Oncol 1: 131–134 [DOI] [PMC free article] [PubMed] [Google Scholar]
- Gastner MT, Newman ME (2004) Diffusion-based method for producing density-equalizing maps. Proc Natl Acad Sci USA 101: 7499–7504 [DOI] [PMC free article] [PubMed] [Google Scholar]
- Groneberg-Kloft B, Scutaru C, Kreiter C, Kolzow S, Fischer A, Quarcoo D (2008) Institutional operating figures in basic and applied sciences: scientometric analysis of quantitative output benchmarking. Health Res Policy Syst 6: 6. [DOI] [PMC free article] [PubMed] [Google Scholar]
- Kingdon D (2006) Health research funding: mental health research continues to be underfunded. BMJ 332: 1510. [DOI] [PMC free article] [PubMed] [Google Scholar]
- Mayor S (2007) England's new research funding system leaves some fields of psychiatry out in cold. BMJ 334: 821. [DOI] [PMC free article] [PubMed] [Google Scholar]
- Watts G (2008) Getting the best from research funding. BMJ 336: 120–122 [DOI] [PMC free article] [PubMed] [Google Scholar]
- Wolinsky H (2009) The crash reaches the universities. The global financial crisis threatens private and public university funding in the USA and Europe. EMBO Rep 10: 209–211 [DOI] [PMC free article] [PubMed] [Google Scholar]
Associated Data
This section collects any data citations, data availability statements, or supplementary materials included in this article.
Supplementary Materials
Supplementary Figure 1
Supplementary Figure 2


