Abstract
Background and Purpose
Mitochondrial biogenesis is regulated through the coordinated actions of both nuclear and mitochondrial genomes to ensure that the organelles are replenished on a regular basis. This highly regulated process has been well defined in skeletal and heart muscle, but its role in neuronal cells, particularly when under stress or injury, is not well understood. In this study, we report for the first time rapidly increased mitochondrial biogenesis in a rat model of neonatal hypoxic/ischemic brain injury (H-I).
Methods
Postnatal day 7 rats were subjected to H-I induced by unilateral carotid artery ligation followed by 2.5 hours of hypoxia. The relative amount of brain mitochondrial DNA (mtDNA) was measured semiquantitatively using long fragment PCR at various time points after H-I. HSP60 and COXIV proteins were detected by Western blot. Expression of three genes critical for the transcriptional regulation of mitochondrial biogenesis, peroxisome proliferator-activated receptor coactivator-1 (PGC-1), nuclear respiratory factor-1 (NRF-1), and mitochondrial transcription factor A (TFAM), were examined by Western blot and RT-PCR.
Results
Brain mtDNA content was markedly increased 6 hours after H-I, and continued to increase up to 24 hours after H-I. Paralleling the temporal change in mtDNA content, mitochondrial number and proteins HSP60 and COXIV, and citrate synthase activity were increased in neurons in the cortical infarct border zone after H-I. Moreover, cortical expression of NRF-1 and TFAM were increased 6 to 24 hours after H-I, whereas PGC-1 was not changed.
Conclusions
Neonatal H-I brain injury rapidly induces mitochondrial biogenesis, which may constitute a novel component of the endogenous repair mechanisms of the brain.
Keywords: neonatal hypoxic ischemia, mitochondria biogenesis, nuclear respiratory factor-1, mitochondrial transcription factor A
Mitochondria play essential roles in energy metabolism, generation of reactive oxygen species (ROS), and regulation of apoptosis in response to neuronal brain injury.1 Although the involvement of mitochondria in neuronal injury has been well studied, much less is understood about the role of mitochondrial biogenesis after cerebral insults.
Mitochondrial biogenesis is a highly regulated process and occurs on a regular basis in healthy cells, where it is controlled by the nuclear genome. Alteration of mitochondrial biogenesis and increased expression of nuclear genes encoding mitochondrial proteins are responses triggered by mitochondrial dysfunction or high energy demands found in pathophysiological conditions.2,3 Transcriptional regulation of mitochondrial biogenesis includes the nuclear respiratory factors (NRF)-1 and 2, which coordinate between nuclear and mitochondrial gene expression; mitochondrial transcriptional factor A (TFAM, previously mtTF-1 and mtTFA), which stimulates mtDNA transcription; and peroxisome proliferator-activated receptor coactivator-1 (PGC-1), a stimulator of mitochondrial biogenesis in mammals.4
Neonatal hypoxic ischemia (H-I) is the most common type of injury that is seen in both preterm neonates and term infants suffering from birth asphyxia.5 During postnatal development, mitochondrial structure, function, and energy metabolism change over time, indicating that the physiology of mitochondria in neonates is different and thus may have different roles after neuronal injury compared to adults.5 Furthermore, mitochondria may play a critical role in the decision of cellular fate regarding neuronal survival after neonatal H-I.
Previous studies have revealed several mitochondrial disturbances after neonatal H-I injury, including reactive oxygen species generation, mitochondrial DNA (mtDNA) damage, and impairment of oxidative phosphorylation. The consequences of these alterations can lead to depression of mitochondrial respiration, intramitochondrial calcium accumulation, swelling, and mitochondrial permeability transition pore opening.6 In addition to these detrimental effects, H-I also induces endogenous protective signals. A cerebral H-I event of sufficient severity to deplete tissue energy reserves may, on reperfusion and reoxygenation, be followed by complete but transient restoration of glucose utilization and production of ATP and phosphocreatine.6 Because the brain responds to any injury with a plethora of both harmful and protective signals, the preponderance of signals in either direction influences the survival or death of neuronal tissue.7 Knowing how mitochondria react to H-I injury is therefore important for understanding and preventing delayed neuronal cell death in the brain.
The changes in mitochondrial biogenesis after neuronal injury have not been well studied. The evidence in support of cerebral mitochondrial biogenesis after neuronal injury is incomplete, as no study has definitively measured an increase in the number of mitochondria after neuronal injury.8–11 Furthermore, mitochondrial biogenesis has never been studied in neonatal hypoxic H-I. In this study, we hypothesized that H-I induces mitochondrial biogenesis in neonatal rats. Using measurements of mtDNA and mitochondrial-specific transcription factors, protein levels, and histology, we show for the first time rapidly increased mitochondrial biogenesis does indeed occur after neonatal H-I.
Materials and Methods
Rat Model of H-I Injury
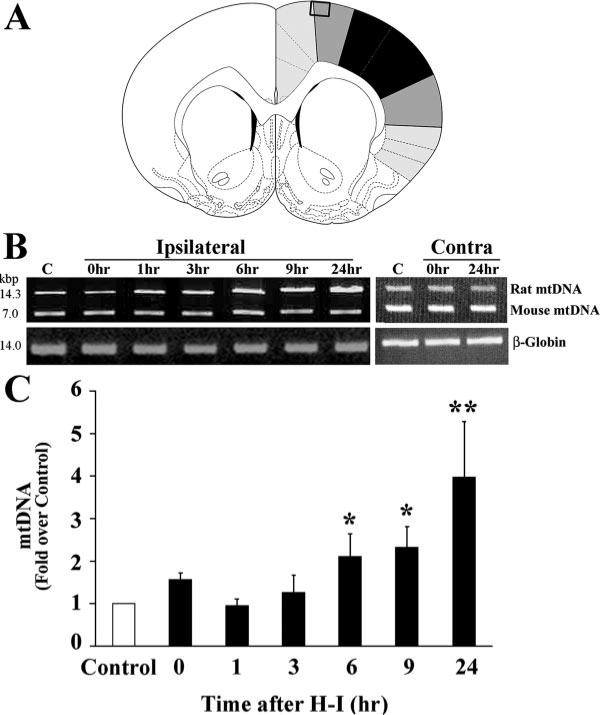
All animal protocols used in this study were approved by the Institutional Animal Care and Use Committee of the University of Pittsburgh. The procedures for the modeling of H-I injury were based on a modification of the Levine method,12 using Sprague-Dawley rat litters at postnatal day 7 (P7; Charles River Laboratory, Wilmington, Mass). Pups were anesthetized with 3% isoflurane mixed with ambient air under spontaneous inhalation, and the left common carotid artery was ligated. After a 1.5-hour recovery period, the pups were placed in glass chambers containing a humidified atmosphere of 8% oxygen/92% nitrogen and submerged in a 37°C water bath. After 2.5 hours of hypoxia, the pups were returned to their dam for the indicated time. For biochemical tissue analysis, a portion of the ipsilateral cortex was used for sample preparation for H-I (Figure 1A). Sham samples also had a ligature placed in the identical fashion but without actually occluding the vessel and without hypoxia. No differences were found between sham and contralateral H-I cortex in any of the parameters measured and were combined (Figures 1B and 3A).
Figure 1.
Mitochondrial DNA content after H-I. A, The shaded area in this coronal section of rat brain shows the region where cortical samples were taken for biochemical and molecular analysis (adapted from Paxinos and Watson30). Cortical samples from black area was excluded, whereas the boxed region represents the area used for morphological studies. B, The relative amounts of cortical mtDNA at various times after H-I was measured semiquantitatively using long fragment PCR. Mouse genomic DNA was also amplified in the same tube as an internal control. Ipsilateral indicates cortical samples from the ipsilateral side to the ligation; Contra, cortical samples from the contralateral side to the ligation. C, The fold change of rat mtDNA over control was significantly increased beginning 6 hours after H-I injury. Amplification of mouse genomic DNA or β-globin did not significantly vary between samples. For each time point, n=6 pups. *P<0.05, **P<0.01 compared with control.
Figure 3.
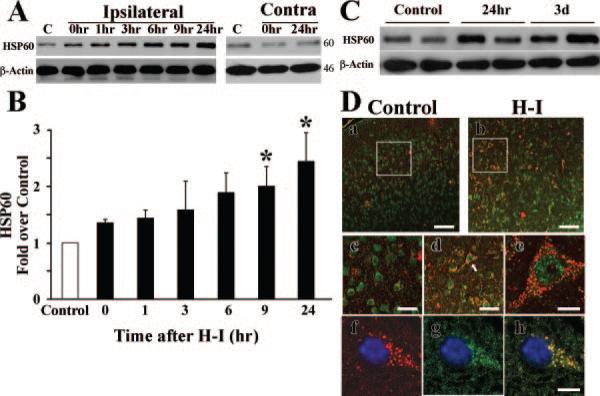
Expression of HSP60 protein after H-I. A, Representative Western blots showing HSP60 protein levels at different times after H-I. Beta-actin was used as the loading control, and the approximate molecular weights for each band are shown at the right. Ipsilateral indicates cortical samples from the ipsilateral side to the ligation; Contra, cortical samples from the contralateral side to the ligation. B, Graph showing semiquantitative analysis of the protein levels in A. Six animals were included in each group. *P<0.05 compared with control group. C, Representative Western blots demonstrating that the increase in HSP60 protein was sustained for 3 days after H-I. D, Confocal images of NeuN (green) and HSP60 (red) immunostaining observed 24 hours after H-I (a and b, low power; c and d, high power). High-power image of HSP60 and NeuN (e) identified by the arrow shows that increased HSP60 is expressed in a large, pyramidal-shaped neuron. h, Merged image of HSP60 (red, f) and VDAC (green, g), showing the colocalization of HSP60 with VDAC. Scale bars: a and b=50 μm, c and d=25 μm, e and h=10 μm.
Long Fragment PCR and mtDNA Quantification
Long fragment PCR was used to quantify the relative abundance of intact mtDNA as previously described.13 Total DNA was purified using the genomic DNA isolation kit (Qiagen). The DNA derived from rat or mouse brain was first linearized by digestion with the restriction enzyme SacII (Promega). The PCR reaction used LA Taq polymerase (TaKaRa Shuzo Co). The same amount (0.4 ng) of total DNA derived from mouse brains was added to the polymerase chain reaction (PCR) reaction mixture to serve as an internal standard. The primers used for the amplification of 14.3 kbp mitochondrial genomes for both rat and mouse13 were: 59-ATATTTTCACTGCTGAGTCCCGTGG-39 (forward); 59-AATTTCGGTTGGGGTGACCTCGGAG-39 (reverse). Conditions for PCR consisted of denaturation for 1 minute at 94°C followed by 26 cycles of denaturation at 94°C for 10 seconds, annealing and extension at 68°C for 15 minutes, and a final extension at 72°C for 10 minutes. The PCR products were then digested with the restriction enzyme NcoI (Promega). The reaction yielded DNA fragments of 14.3 kbp, representing the amplified rat mtDNA, and 2 fragments of 7.0 and 7.3 kbp from the amplified mouse mtDNA that contains an NcoI restriction site. These 2 bands migrated as a single band on 1% agarose gel. The bands were semiquantitatively measured using MCID Elite Image Analysis system (Image Research, Linton, England). The relative content of rat mtDNA was derived by normalization of the amplified products with the amplified mouse mtDNA included in each sample.13 As a further control, rat β-globin DNA was amplified according to primer pairs designed in house.
Real-Time RT-PCR
Total RNA was isolated from frozen cortical samples using the RNeasy Mini kit according to the manufacturer's instructions (Qiagen), and 5 μg was used to synthesize the first strand of cDNA using random hexamer primers and the Superscrip First-strand synthesis system for RT-PCR (Invitrogen); PCR was performed using SYBR green PCR Master Mix (Applied Biosystems). Fluorescence was quantified using SDS v1.2x system software (Applied Biosystems). The forward and reverse primers used were: TFAM, GAAAGCACAAATCAAGAGGAG, CTGCTTTTCATCATGAGACAG; NRF-1, TTACTCTGCTGTGGCTGATGG, CCTCTGATGCTTGCGTCGTCT; PGC-1a, GTGCAGCCAAGACTCTGTATGG, GTCCAGGTCATTCACATCAAGTTC; and Beta-actin, GGGTCAGAAGGATTCCTATG, GGTCTCAAACATGATCTGGG.
RT-PCR
1 μg RNA was reverse transcribed and amplified by PCR using Superscript III One Step RT-PCR system (Invitrogen). Gene transcripts were amplified by RT-PCR using the specific primers: TFAM, GCTTCCAGGAGGCTAAGGAT, and CCCAATCCCAATGACAACTC; NRF-1, CCACGTTGGATGAGTACACG, and CTGAGCCTGGGTCATTTTGT; PGC-1, TGAGTGTTCTGGTACCCAAG, and GGATCTTGAAGAGGATCTAC; and GAPDH, CACGGAAGGCCATGCCAGTGAG and CTGGCGTCTTCACCACCATGGAG. GAPDH mRNA levels were used to control for variation in the efficiency of RNA extraction, reverse transcription, and amplification for nuclear RNA expression.14 Cycle conditions for RT-PCR: 65°C 40 seconds, 94°C 2 minutes to start, then 40 cycles of 94°C for 15 seconds, 55°C (TFAM), 62°C (NRF-1), 50°C (PGC-1) for 1 minute, and 72°C 1 minute, ending with 72°C for 7 minutes. The gene bands in each sample were normalized to the corresponding GAPDH band using MCID.
Western Blot
Cortical tissues were harvested from each of the two hemispheres at 0, 3, 6, 12, 24, and 72 hours after H-I insult. Cortical protein extracts and Western blot analysis were performed as previously described15 using 10 μg of protein extract per lane. Immunoreactivity on each lane was semiquantified using a gel densitometric-scanning program and analyzed with MCID. Primary mouse monoclonal antibodies used in this study were as follows: anti-HSP60 (H-1), anti-NRF-1 and anti-PGC-1 (all from Santa Cruz Biotechnology Inc), anti-COXIV (Molecular Probes, Invitrogen), anti-β-actin (Cell Signaling Technology, Inc).
Electron Microscopy
Brains were removed 24 hours after H-I, and a section of the cortex was cut into pieces about 1 mm3 and processed as described previously.16 For morphometric studies of mitochondria, 30 randomly selected areas per animal, which included large neuronal-like nuclei covering about one-fourth of the visible image were photographed at 5000× magnification and counted (3 animals per group).
Immunohistochemistry
Immunofluorescence staining was performed on paraffin-embedded coronal sections as described previously.15 Sections were incubated with the primary antibodies anti-NeuN, anti-GFAP (monoclonal antibody, Chemicon), or anti-VDAC (Cell Signaling Technology, Inc), then with secondary antibodies conjugated with the fluorochromes Cy-3 or Alexafluor-488. TUNEL staining was performed using the In situ Cell Death Detection kit (Hoffmann-La Roche Inc). In some sections, Hoechst 33258 (Sigma) was used to stain nuclei.
Citrate Synthase Activity
Citrate synthase activity was measured using the Citrate Synthase Assay Kit (Sigma). Arbitrary activity units were calculated per manufacture's instruction.
Statistical Analysis
All values are reported as the mean±SEM. Multiple comparisons between groups were determined by using 1-way ANOVA followed by Fisher protected least significant difference test (PLSD) post hoc test. Differences were considered statistically significant at a level of P<0.05.
Results
Effect of H-I on mtDNA Content
The relative abundance of mitochondria in the H-I lesioned cerebral cortex was inferred by measuring mtDNA content using long fragment PCR. Mouse genomic DNA was used as an internal amplification standard between samples.13 Postnatal day 7 rats were subjected to H-I, and cerebral cortices were collected at 0, 1, 3, 6, 9, and 24 hours after the insult. After H-I, there was a rise in relative cortical mtDNA content compared to control. Beginning at 6 hours, mtDNA content significantly increased until it was 4-fold greater than control at 24 hours (Figure 1B and 1C). There was no significant difference in amplification of the mouse mtDNA between samples. There was no significant differences between sham and the contralateral (H-I) sides at 0 hours or 24 hours after H-I. The rat β-globin gene was also amplified and did not vary between each condition. The observed increase in relative mtDNA content suggests that mitochondrial biogenesis may occur after H-I injury.
Effect of H-I on the Number of Mitochondria in the Cortex
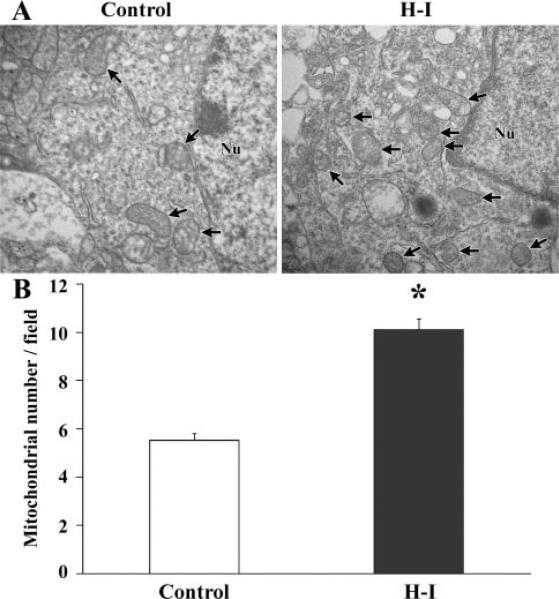
To determine whether mitochondria in the H-I cortex appeared normal morphologically, the ultrastructure of surviving cells in the cortical infarct border was examined using transmission electron photomicrographs of ultrathin sections. Quantification of the number of mitochondria observed showed that there was an increase 24 hours after H-I (Figure 2). We also observed many damaged cells surrounding the live cells, which contained damaged mitochondria that were markedly swollen and with broken or disrupted cristae (not shown).
Figure 2.
The number of mitochondria in the cortex 24 hours after H-I. A, Transmission electron microscope image of a section from control brain showing normal ultrastructural features in cortical cells. The nucleus (Nu) is surrounded by relatively uniform and compact mitochondria. In the H-I–exposed ipsilateral cortex, an enhanced number of mitochondria were observed. B, Quantification of the number of cortical mitochondria per photomicrograph. The increase in mitochondrial density was approximately 76% 24 hours after H-I. Magnification of brain sections, 5000×. Nu indicates nucleus; arrows, mitochondria. For each group, n=3 pups and 30 photomicrographs were counted per animal. *P<0.05 compared with control.
Effect of H-I on Mitochondrial Protein Expression
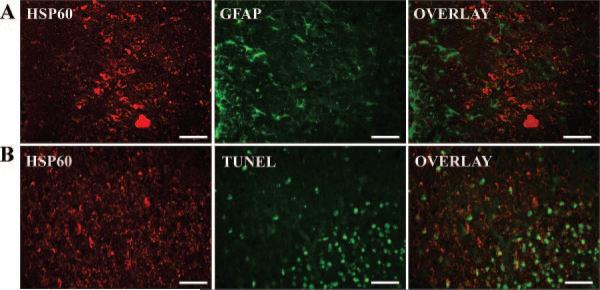
To gain additional evidence for the H-I–induced generation of mitochondria, the expression level of several proteins normally enriched in mitochondria was investigated. Heat shock protein-60 (HSP60) is an abundant protein located primarily in mitochondria, with only 15% to 20% normally found in the cytosol.17 We found that cortical HSP60 levels had risen significantly 9 hour after H-I (Figure 3A and 3B). The enhanced levels of HSP60 were sustained for 3 days, although they reached maximal levels 1 day after H-I (Figure 3C). Similarly, no differences were found between sham and contralateral samples (Figure 3A). To determine whether the distribution of HSP60 was altered specifically in neuronal or other cell types, we examined the cellular distribution of HSP60 using immunohistochemical analysis of cortical brain sections. We found that the expression of HSP60-like immunoreactivity was colocalized with the neuronal marker NeuN and showed a punctuate pattern, suggestive of mitochondrial localization (Figure 3Da through 3De). Colocalization of HSP60 with the mitochondrial outer membrane protein voltage-dependent anion channel (VDAC) confirmed that HSP60 immunoreactivity is localized to mitochondria (Figure 3Df through 3Dh). In contrast, immunoreactivity for HSP60 did not colocalize with either GFAP (Figure 4A), a marker for activated astrocytes, or with TUNEL, a marker for DNA fragmentation typically occurring in dead cells (Figure 4B).
Figure 4.
Localization of HSP60, GFAP, and TUNEL staining. Immunoreactivity in the cortex 24 hours after H-I is shown for HSP60 (red) and GFAP (green, top row, A) or TUNEL staining (green, bottom row, B). The merged images (rightmost column) show that HSP60 did not colocalize with either GFAP or TUNEL staining. Scale bars=50 μm.
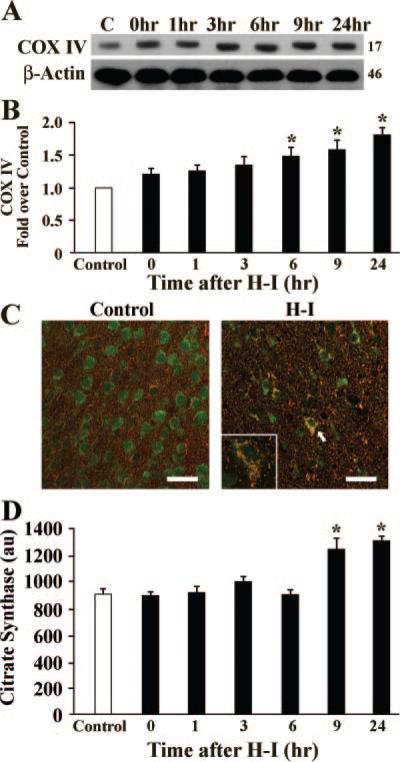
To address the question of whether an increase in HSP60 might simply be a manifestation of the stress response instead of genuine mitochondrial biogenesis, we examined the expression of the mitochondrial-specific protein, mitochondrial respiratory protein cytochrome C oxidase subunit IV (COXIV). COXIV protein levels showed a temporal increase in the cortex beginning 6 hours after H-I (Figure 5A and 5B), which peaked at 1 day, and remained above normal levels for 3 days after H-I (data not shown). Immunohistochemical staining for COX IV in the cortex appeared robust at 24 hours after H-I compared to control cortex (Figure 5C) and coexpressed with NeuN (Figure 5C). This protein expression study adds additional credence to the hypothesis that H-I induces mitochondrial biogenesis.
Figure 5.
Expression of COXIV and citrate synthase activity in the cortex. A, Representative Western blots stained for COXIV protein at the times indicated after H-I. C is control lane; β-actin was used as a loading control, and the approximate molecular weights for each band are shown at the right. B, Histogram showing semiquantitative analysis of the COXIV protein levels in (A) relative to control. For each time point, n=6 pups. *P<0.05 compared to the control group. C, Confocal fluorescent images of the cortex from Control or H-I brains at 24 hours showing COXIV immunoreactivity in red and NeuN in green. High expression of COXIV is seen in neurons. Insert shows high-power (60×) magnification of a neuron identified by the arrow. D, Citrate synthase activity (arbitrary units, au) at the times indicated after H-I. *P<0.05 compared to the control group. Scale bar=125 μm.
To determine whether there was a concomitant increase in mitochondrial function, citrate synthase activity was measured after H-I. Citrate synthase activity is considered to be a biochemical determination of mitochondrial mass.18 Cortical citrate synthase activity increased at 9 and 24 hours after H-I (Figure 5D). Thus, in addition to morphogenic analysis and enhanced mitochondrial protein levels, an increase in functional mitochondria was confirmed.
Effect of H-I on Mitochondrial Biogenesis Factors
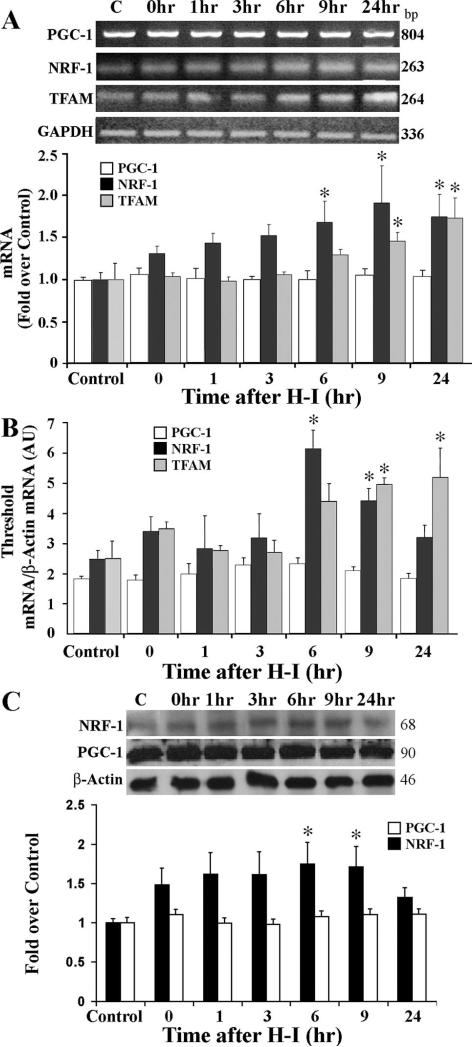
To investigate the molecular mechanisms that might be responsible for regulating mitochondrial biogenesis after H-I, we examined three transcription factors considered essential for mitochondrial gene expression in mammals. Mitochondrial transcription factor A (TFAM) is a transcription factor critical for the regulation of mitochondrial gene transcription and DNA replication. Expression of TFAM is at least partially under the control of nuclear respiratory factor 1 (NRF-1), also a positive regulator of transcription.19 We examined the mRNA expression of these factors using both RT-PCR and real-time RT-PCR. NRF-1 and TFAM mRNA increased in a time-dependent fashion after H-I, beginning at 6 hours for NRF-1 and 9 hours for TFAM, and remaining elevated until 24 hours after H-I. The peak mRNA levels for NRF-1 were earlier than that of TFAM (9 versus 24 hours, respectively; Figure 6A and 6B) and is consistent with the notion that NRF-1 is upstream of TFAM. These results were further quantified and confirmed using real time RT-PCR, where nearly identical results were observed except that increased NRF-1 was not detected by real-time RT-PCR at 24 hours after H-I (Figure 6B). In support of the RT-PCR data, a concomitant increase in NRF-1 protein level was also detected at 9 hours and 24 hours after H-I (Figure 6C). These data indicate that NRF-1 and TFAM may be involved in increased mitochondrial biogenesis after H-I. We also analyzed mRNA and protein expression for the coactivator PGC-1α, which can act in concert with NRF-1 to transactivate many target genes important for mitochondrial biogenesis. In this study, however, we failed to detect any H-I induced changes in either PGC-1 mRNA (Figure 6A and 6B) or protein levels (Figure 6C).
Figure 6.
mRNA and protein expression of mitochondrial biogenesis factors in the cortex. A, Representative agarose gel of RT-PCR products of PGC-1, NRF-1, and TFAM mRNA prepared from control (C) or at the indicated times after H-I. The histogram below shows semiquantitative measurement of PCR products from (A) obtained by densitometric analysis relative to the control level. B, Analysis of quantitative real-time RT-PCR from control or H-I brains at the indicated times for PGC-1, NRF-1, and TFAM normalized to β-actin. C, Representative Western blots for PGC-1 and NRF-1 in cortex from control and various time points after H-I. For each group in all experiments, n=6 pups. *P<0.05 compared with the respective control.
Discussion
This study established, for the first time, increased mitochondrial biogenesis after neonatal H-I brain injury. Measurement of the relative amount of brain mtDNA up to 24 hours after H-I showed an increase in cortical mtDNA content. Comparable to the increase in mtDNA, a temporal increase in the number of mitochondria, the expression of two mitochondrial proteins, HSP60 and COXIV, and citrate synthase activity was found. Moreover, increased expression of NRF-1 and TFAM were also detected. These results suggest that rapidly increased mitochondrial biogenesis is an inducible response by the neonatal brain after H-I injury and constitutes a novel component of the endogenous repair mechanisms of the brain.
Numerous studies support the hypothesis that disruption of mitochondrial function plays a central role in the pathophysiology of many neurological diseases.20 Conditions or events that specifically hinder mitochondrial performance, such as H-I–induced cerebral damage, place the brain at risk for compromised energy production and thus secondary injury. An obvious strategy to help minimize damage attributable to lost energy resources is to increase the number of mitochondria themselves. The evidence for this occurring in cerebral H-I models is not clear and has been examined in only a few studies using adult ischemic models. For example, increased mitochondrial elongation, a well documented step in the process of mitochondrial biogenesis, was observed in the CA1 region of the hippocampus after transient global ischemia in adults.9,11 Histological evidence of mitochondrial biogenesis was also found after transient global ischemia in adult rats.11 In transient focal ischemia, 30 minutes of ischemia induced a reduction in mtDNA content; however, mtDNA was restored to nearly preischemic levels 24 hours later.13 This transient loss might be explained by the hypothesis that in adult mice mtDNA deletions or additions are more likely to occur than in young mice to produce decreased viable numbers of mitochondria in the adult.21,22 Our data using the neonatal H-I model lends credence to this possibility.
Other dynamic changes besides mitochondrial senescence, however, contribute to loss of mitochondria after H-I.5 One of the major factors that are upregulated after hypoxic insults is hypoxia-inducible factor 1 (HIF-1).23 While HIF-1 can enhance the ability of tissue to survive reduced oxygen levels, one of the byproducts of this process is the inhibition of mitochondrial biogenesis via loss of c-myc upregulation by PGC-1.24 We in fact found that mRNA and protein levels of PGC-1 did not increase after H-I, indicating that the maximum potential for mitochondrial biogenesis may not have been achieved in our study. Thus, at least one acute response, the upregulation of HIF-1 that is protective against H-I, may be maladaptive in the long term overriding any beneficial mechanisms that are attempting to increase mitochondrial biogenesis.
The upregulation of HSP60 is another response that occurs after many stressors, and is indicative of mitochondrial biogenesis.25 The majority of constitutively expressed HSP60 is in the mitochondria and is involved in stabilizing both newly synthesized proteins and mtDNA, the latter via mitochondrial nucleoids, discrete protein-DNA complexes critical for the regulation of mtDNA transmission and biogenesis of new mitochondria.26 In our H-I model, we did find increased levels of this mitochondrial-enriched protein in surviving neurons, as would be predicted after enhanced biogenesis. In addition to HSP60 being a marker for the presence of mitochondria, it may also be an integral part of the mechanism involved in mitochondrial biogenesis after H-I.
Recent studies have shown that exogenously supplied factors may be able to drive mitochondrial biogenesis in addition to or by augmenting endogenous signaling responses. One such compound is resveratrol, a polyphenol that can activate AMP-activated kinase and that also induces mitochondrial biogenesis in neurons.27 Because resveratrol is also protective in several cerebral ischemic models including neonatal ischemia,28 this raises the possibility that mitochondrial biogenesis may be one of its neuroprotective mechanisms. The involvement of the AMP-kinase cascade is also worth investigating in future studies of neonatal H-I because it plays a key role in sensing and transduction of cellular energy levels.29 Future studies also should include examining exogenously supplied compounds capable of inducing or aiding mitochondrial biogenesis to limit or even contribute to neonatal brain repair.
The functional significance of mitochondrial biogenesis is unknown. Increased mitochondrial mass would clearly improve the overall oxidative function and energy state of the H-I brain. This may be an endogenous neuroprotective response against H-I injury. Evidence for such a role cannot be made until the H-I–induced signaling mechanisms controlling neuronal mitochondrial biogenesis have been elucidated. Further studies to identify the specific signaling pathways will help directly address this issue and determine whether these signaling pathways can be enhanced to ameliorate brain damage due to perinatal H-I.
Sources of Funding
This project was supported by NIH/NINDS grants NS45048, NS36736, NS43802, and NS44178. J.C. was also supported in part by the Geriatric Research, Education and Clinical Center, Veterans Affairs, Pittsburgh Health Care System, Pittsburgh, Pennsylvania.
Footnotes
Disclosures
None.
References
- 1.Achanta G, Sasaki R, Feng L, Carew JS, Lu W, Pelicano H, Keating MJ, Huang P. Novel role of p53 in maintaining mitochondrial genetic stability through interaction with DNA pol gamma. EMBO J. 2005;24:3482–3492. doi: 10.1038/sj.emboj.7600819. [DOI] [PMC free article] [PubMed] [Google Scholar]
- 2.Fiskum G. Mitochondrial participation in ischemic and traumatic neural cell death. J Neurotraum. 2000;17:843–855. doi: 10.1089/neu.2000.17.843. [DOI] [PubMed] [Google Scholar]
- 3.St-Pierre J, Drori S, Uldry M, Silvaggi JM, Rhee J, Jager S, Handschin C, Zheng K, Lin J, Yang W, Simon DK, Bachoo R, Spiegelman BM. Suppression of reactive oxygen species and neurodegeneration by the pgc-1 transcriptional coactivators. Cell. 2006;127:397–408. doi: 10.1016/j.cell.2006.09.024. [DOI] [PubMed] [Google Scholar]
- 4.Scarpulla RC. Nuclear control of respiratory gene expression in mammalian cells. J of Cell Biochem. 2006;97:673–683. doi: 10.1002/jcb.20743. [DOI] [PubMed] [Google Scholar]
- 5.Blomgren K, Hagberg H. Free radicals, mitochondria, and hypoxia-ischemia in the developing brain. Free Radic Biol Med. 2006;40:388–397. doi: 10.1016/j.freeradbiomed.2005.08.040. [DOI] [PubMed] [Google Scholar]
- 6.Hagberg H. Mitochondrial impairment in the developing brain after hypoxia-ischemia. J Bioenerg Biomembr. 2004;36:369–373. doi: 10.1023/B:JOBB.0000041770.00567.4f. [DOI] [PubMed] [Google Scholar]
- 7.Bazan NG, Marcheselli VL, Cole-Edwards K. Brain response to injury and neurodegeneration: Endogenous neuroprotective signaling. Ann N Y Acad Sci. 2005;1053:137–147. doi: 10.1196/annals.1344.011. [DOI] [PubMed] [Google Scholar]
- 8.Yang SJ, Liang HL, Wong-Riley MT. Activity-dependent transcriptional regulation of nuclear respiratory factor-1 in cultured rat visual cortical neurons. Neuroscience. 2006;141:1181–1192. doi: 10.1016/j.neuroscience.2006.04.063. [DOI] [PubMed] [Google Scholar]
- 9.Liang HL, Wong-Riley MT. Activity-dependent regulation of nuclear respiratory factor-1, nuclear respiratory factor-2, and peroxisome proliferator-activated receptor gamma coactivator-1 in neurons. Neuro-report. 2006;17:401–405. doi: 10.1097/01.wnr.0000204980.98876.11. [DOI] [PubMed] [Google Scholar]
- 10.Gutsaeva DR, Suliman HB, Carraway MS, Demchenko IT, Piantadosi CA. Oxygen-induced mitochondrial biogenesis in the rat hippocampus. Neuroscience. 2006;137:493–504. doi: 10.1016/j.neuroscience.2005.07.061. [DOI] [PubMed] [Google Scholar]
- 11.Bertoni-Freddari C, Fattoretti P, Casoli T, Di Stefano G, Solazzi M, Perna E, De Angelis C. Reactive structural dynamics of synaptic mitochondria in ischemic delayed neuronal death. Ann N Y Acad Sci. 2006;1090:26–34. doi: 10.1196/annals.1378.003. [DOI] [PubMed] [Google Scholar]
- 12.Rice JE, III, Vannucci RC, Brierley JB. The influence of immaturity on hypoxic-ischemic brain damage in the rat. Ann Neurol. 1981;9:131–141. doi: 10.1002/ana.410090206. [DOI] [PubMed] [Google Scholar]
- 13.Chen H, Hu CJ, He YY, Yang DI, Xu J, Hsu CY. Reduction and restoration of mitochondrial dna content after focal cerebral ischemia/reperfusion. Stroke. 2001;32:2382–2387. doi: 10.1161/hs1001.097099. [DOI] [PubMed] [Google Scholar]
- 14.Piantadosi CA, Suliman HB. Mitochondrial transcription factor a induction by redox activation of nuclear respiratory factor 1. J Biol Chem. 2006;281:324–333. doi: 10.1074/jbc.M508805200. [DOI] [PubMed] [Google Scholar]
- 15.Yin W, Cao GD, Johnnides MJ, Signore AP, Luo YM, Hickey RW, Chen J. Tat-mediated delivery of bcl-xl protein is neuroprotective against neonatal hypoxic-ischemic brain injury via inhibition of caspases and aif. Neurobiol of Dis. 2006;21:358–371. doi: 10.1016/j.nbd.2005.07.015. [DOI] [PubMed] [Google Scholar]
- 16.Nisoli E, Falcone S, Tonello C, Cozzi V, Palomba L, Fiorani M, Pisconti A, Brunelli S, Cardile A, Francolini M, Cantoni O, Carruba MO, Moncada S, Clementi E. Mitochondrial biogenesis by no yields functionally active mitochondria in mammals. Proc Natl Acad Sci U S A. 2004;101:16507–16512. doi: 10.1073/pnas.0405432101. [DOI] [PMC free article] [PubMed] [Google Scholar]
- 17.Gupta S, Knowlton AA. Cytosolic heat shock protein 60, hypoxia, and apoptosis. Circulation. 2002;106:2727–2733. doi: 10.1161/01.cir.0000038112.64503.6e. [DOI] [PubMed] [Google Scholar]
- 18.Lopez-Lluch G, Hunt N, Jones B, Zhu M, Jamieson H, Hilmer S, Cascajo MV, Allard J, Ingram DK, Navas P, de Cabo R. Calorie restriction induces mitochondrial biogenesis and bioenergetic efficiency. Proc Natl Acad Sci U S A. 2006;103:1768–1773. doi: 10.1073/pnas.0510452103. [DOI] [PMC free article] [PubMed] [Google Scholar]
- 19.Kain KH, Popov VL, Herzog NK. Alterations in mitochondria and mttfa in response to lps-induced differentiation of b-cells. Biochim Biophys Acta. 2000;1494:91–103. doi: 10.1016/s0167-4781(00)00223-2. [DOI] [PubMed] [Google Scholar]
- 20.Mandemakers W, Morais VA, De Strooper B. A cell biological perspective on mitochondrial dysfunction in parkinson disease and other neurodegenerative diseases. J Cell Sci. 2007;120:1707–1716. doi: 10.1242/jcs.03443. [DOI] [PubMed] [Google Scholar]
- 21.Pikó L, Hougham AJ, K.J. B. Studies of sequence heterogeneity of mitochondrial DNA from rat and mouse tissues: Evidence for an increased frequency of deletions/additions with aging. Mech Ageing Dev. 1988;43:297–293. doi: 10.1016/0047-6374(88)90037-1. [DOI] [PubMed] [Google Scholar]
- 22.Zeng ZH, Zhang ZY, Yu HS, Corbley MJ, Tang ZQ, Tong T. Mitochondrial DNA deletions are associated with ischemia and aging in balb c mouse brain. J Cell Biochem. 1999;73:545–553. [PubMed] [Google Scholar]
- 23.Jin KL, Mao XO, Nagayama T, Goldsmith PC, Greenberg DA. Induction of vascular endothelial growth factor and hypoxia-inducible factor-1 alpha by global ischemia in rat brain. Neuroscience. 2000;99:577–585. doi: 10.1016/s0306-4522(00)00207-4. [DOI] [PubMed] [Google Scholar]
- 24.Zhang HF, Gao P, Fukuda R, Kumar G, Krishnamachary B, Zeller KI, Dang CV, Semenza GL. Hif-1 inhibits mitochondrial biogenesis and cellular respiration in vhl-deficient renal cell carcinoma by repression of c-myc activity. Cancer Cell. 2007;11:407–420. doi: 10.1016/j.ccr.2007.04.001. [DOI] [PubMed] [Google Scholar]
- 25.Hood DA, Adhihetty PJ, Colavecchia M, Gordon JW, Irrcher I, Joseph AM, Lowe ST, Rungi AA. Mitochondrial biogenesis and the role of the protein import pathway. Med Sci Sport Exer. 2003;35:86–94. doi: 10.1097/00005768-200301000-00015. [DOI] [PubMed] [Google Scholar]
- 26.Kaufman BA, Kolesar JE, Perlman PS, Butow RA. A function for the mitochondrial chaperonin hsp60 in the structure and transmission of mitochondrial DNA nucleoids in saccharomyces cerevisiae. J Cell Biol. 2003;163:457–461. doi: 10.1083/jcb.200306132. [DOI] [PMC free article] [PubMed] [Google Scholar]
- 27.Dasgupta B, Milbrandt J. Resveratrol stimulates amp kinase activity in neurons. Proc Natl Acad Sci U S A. 2007;104:7217–7222. doi: 10.1073/pnas.0610068104. [DOI] [PMC free article] [PubMed] [Google Scholar]
- 28.West T, Atzeva M, Holtzman DM. Pomegranate polyphenols and resveratrol protect the neonatal brain against hypoxic-ischemic injury. Dev Neurosci-Basel. 2007;29:363–372. doi: 10.1159/000105477. [DOI] [PMC free article] [PubMed] [Google Scholar]
- 29.Hardie DG. Minireview: The amp-activated protein kinase cascade: The key sensor of cellular energy status. Endocrinology. 2003;144:5179–5183. doi: 10.1210/en.2003-0982. [DOI] [PubMed] [Google Scholar]
- 30.Paxinos G, Watson C. The Rat Brain in Stereotaxic Coordinates. Academic Press Limited; London: 1997. [Google Scholar]


