Abstract
Hyperglycemic effects on the gastric slow wave are not well understood, and no studies have examined the effects that hyperglycemia has on gastric slow wave magnetic fields. We recorded multichannel magnetogastrograms (MGGs) before and after intravenous administration of glucagon and subsequent modest hyperglycemia in 20 normal volunteers. Normal slow waves were evident in baseline MGG recordings from all 20 subjects, but within 15 minutes after glucagon had been given, we noted significant effects on MGG signals. In addition to an overall decrease in the slow wave frequency from 2.9 ± 0.5 cycles per minute (cpm) to 2.2 ± 0.1 cpm (p < 0.05), we observed significant changes in the number and range of spectral peaks recorded. Furthermore, the propagation velocity determined from surface current density maps computed from the multichannel MGG decreased significantly (7.1 ± 0.8 mm/s to 5.0 ± 0.3 mm/s, p < 0.05). This is the first study of biomagnetic effects of hyperglycemia in normal subjects. Our results suggest that the analysis of the magnetogastrogram provides parameter quantification for gastric electrical activity specific to and characteristic of slow wave abnormalities associated with increased serum glucose by injection of glucagon.
Background
Hyperglycemia alters the electrical slow wave of the stomach (14), and previous electrogastrogram (EGG) studies have demonstrated an increase in gastric slow wave frequency in response to glycemic overload (14; 18). These effects are pronounced in patients with diabetes mellitus, where recent evidence suggests that depletion of interstitial cells of Cajal is associated with this disease (23; 28). Interstitial cells of Cajal are the progenitors and propagators of gastrointestinal (GI) slow waves, and their absence is associated with disruptions in gastric and intestinal electrical activities (27; 33).
While the EGG is generally capable of describing the frequency dynamics of the gastric slow wave, its sensitivity to the electrical conductivity profile of the abdomen complicates the routine analysis of other clinically relevant parameters such as amplitude and propagation velocity (7; 25). The magnetic fields generated by gastric slow wave currents are less influenced by these conductivity differences. As a result, the magnetogastrogram (MGG) allows assessment of gastric slow wave frequency as well as amplitude, propagation velocity, and other relevant spatiotemporal parameters (3; 5).
Given the ability of the MGG to accurately characterize the gastric slow wave, we hypothesized that MGG recordings would reflect slow wave changes caused by a modest degree of hyperglycemia in normal human subjects.
Methods
Normal human volunteers (N = 20) fasted overnight before undergoing the study. We inserted an intravenous line into the subject’s arm and performed a fasting blood glucose test. We placed two pairs of bipolar nonmagnetic cutaneous EKG electrodes (Rochester Electro-Medical, Tampa, FL) on the abdomen above the epigastrium and asked the subjects to lie quietly underneath a Superconducting QUantum Interference Device (SQUID) magnetometer (Tristan Technologies, San Diego) for a thirty minute baseline recording. Respiration was monitored throughout the course of the study with a thermocouple placed outside the nose and mouth. Following the baseline recording, with the subjects remaining underneath the magnetometer, we injected 9 mcg/kg glucagon. We obtained blood samples for glucose level tests at baseline and 20, 40 and 60 minutes after injection of glucagon. We continued recording biomagnetic and cutaneous electrode signals for a period of one hour following glucagon injection.
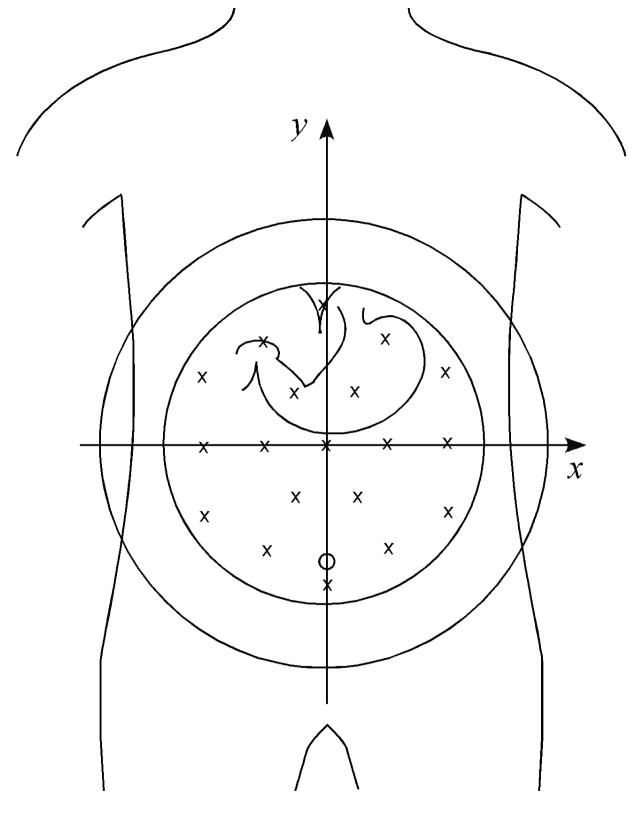
The magnetometer contains 19 detection coils at the bottom of a liquid helium-filled dewar oriented normal to the dewar bottom and arranged in a honeycomb pattern. The approximate locations of the individual sensors relative to a typical subject’s abdomen are illustrated in Figure 1. As a reference for our analysis, we defined a Cartesian coordinate system with reference to the magnetometer and the subject, with the xy plane co-planar with a coronal anatomical plane, the x axis parallel to an axial plane and the y axis parallel to a sagittal plane.
Figure 1.
The approximate location of SQUID sensors is illustrated by x’s in reference to a typical adult torso and stomach. The coordinate system used in subsequent figures is illustrated with reference to the magnetometer.
MGG data were amplified (DC-SQUID Model 5000 amplifier, Quantum Dynamics, San Diego), digitized (PCI-6033e, National Instruments, Austin) and acquired on a PC (Dell, Austin) running LabVIEW (National Instruments, Austin). EGG and respiratorysignals were also amplified (James Long, New York) and were digitized and acquired with the same instrumentation and software as the SQUID signals. We removed linear trends from each channel of data and applied a 2nd order Butterworth digital bandpass filter between 1 and 30 cycles per minute (cpm).
We used MATLAB (Mathworks, Natick, MA) to compute the amplitude of signals in individual channels by computing the difference between the signal minima and maxima in specific time ranges. We plotted data from individual magnetic channels at relative locations of their sensors to examine the multiple time series and investigate any spatiotemporal trends or patterns. We also create false-color maps of data at individual time points. A sequential display of these false-color maps provides a visual representation of spatiotemporal signal characteristics.
We performed spectral analysis using an autoregressive analysis method (3; 8). Spectral analyses from multiple data channels were used to compute spatial maps of the MGG signal frequency content in different frequency bands. These maps allowed us to estimate the location of the contribution of MGG activity in different frequency ranges. We used a map in the range of 2–4 cpm to identify the MGG channel with the strongest contribution from gastric slow wave activity. We computed the gastric slow wave frequency as the dominant frequency recorded in this magnetic channel from its power spectrum.
Power spectra obtained throughout the course of the experiment allowed us to create running spectral analyses. We analyzed signals from seven different time points: ten minutes before the end of the baseline study, and then 5, 15, 25, 35, and 45 minutes after glucagon was infused. Respiration-free segments of data closest to these time points were identified and used to compute AR power spectra for each subject. We also used these spectra to compute the percentage of power distributed in ranges normally considered bradygastric (< 2 cpm), normogastric (2–4 cpm) and tachygastric (> 4 cpm). In addition, we used the power spectra to determine the number of spectral peaks present, defined as a local maximum in the spectrum greater than 25% of the global maximum. We also computed the range of spectral peaks present. These values help us detect the presence of multiple slow wave frequencies suggestive of functional electrical disturbances in the gastric syncytium.
Finally, to examine the propagation of the gastric slow wave, we computed the surface current density (SCD) from the 19 MGG sensor data, as described in (3). Spatiotemporal dynamics of the pattern maxima in the SCD maps were evaluated as reflective of propagation of the gastric electrical activity. We computed the 2-D pattern maximum and estimated propagation velocity as the result of the spatial extent of the motion of the maximum divided by the time of travel from the subject’s left to right. Previous studies have shown that propagation velocities obtained in this way are consistent with the known propagation velocity of the gastric slow wave (3). Additionally, yet-to-be-published data from our lab show that the propagation velocity computed from SCD maps reflects the propagation velocity measured directly with serosal electrodes (Bradshaw et al., unpublished data).
Results
Pre- and Post-glucagon MGGs
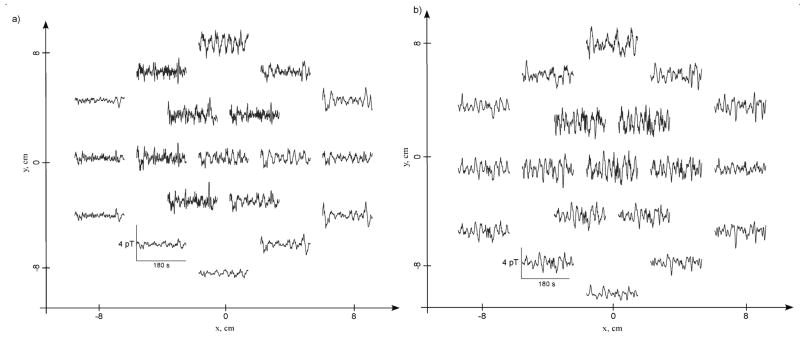
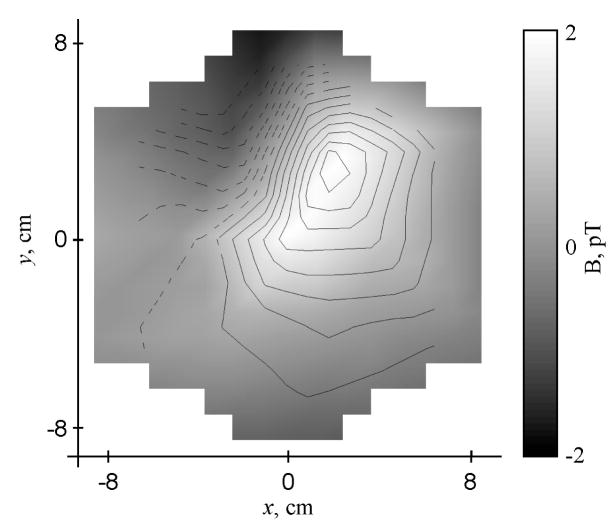
Magnetogastrograms from all subjects indicated gastric slow wave activity at a normal preprandial frequency. Typical three-minute pre- and post-glucagon MGGs mapped to the location of the SQUID sensor array are shown in Figure 2. In Figure 2a, channels located in the upper and central part of the array record consistent slow waves near 3 cpm. Channels interposed between these locations also record 3 cpm slow waves, but with smaller amplitudes, suggesting the presence of a dipolar slow wave current source near the epigastrium. A false-color spatial plot of MGG values at one time point (Figure 3) exhibits the double-lobe pattern characteristic of current dipoles. To confirm the dipolar nature of this model, we performed a linear least-squares fit of these data to the magnetic field of a simple current dipole. The results of the fit are illustrated by the contour lines in the figure. These data provide further evidence of the validity of the propagating current dipole model proposed earlier (4; 5).
Figure 2.
Three minutes of MGG data acquired at the 19 SQUID sensor locations (a) before and (b) after administration of glucagon. Sensors in the upper part of the array are nearest the epigastrium and record normal 3 cpm slow waves pre-glucagon. After glucagon is administered (b), the same sensors record gastric dysrhythmias, including brady- and tachygastria.
Figure 3.
A false-color map of baseline magnetic field values recorded at the peak of a gastric slow wave measured in the sensor located at (−2 cm, 3.5 cm) shows that the gastric magnetic field assumes an approximately dipolar pattern. For comparision, the magnetic field lines from a current dipole that best fit these field data are also drawn. The dipole is located at (0, 4.5) cm on the map 4.0 cm below the plane of the magnetometer pickup coils and is oriented 135o CCW from the y-axis.
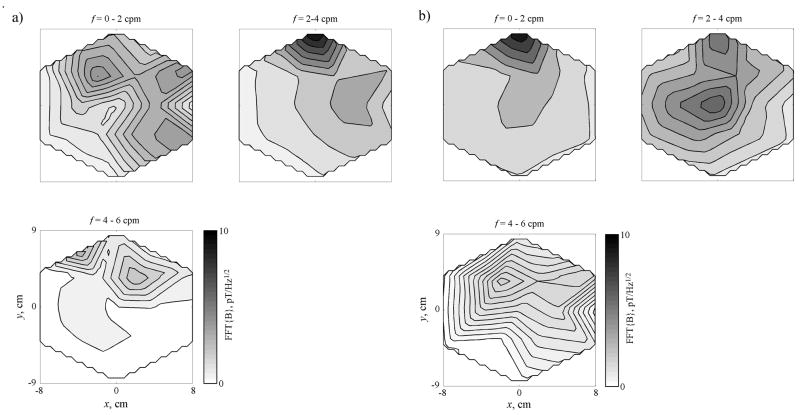
MGGs change substantially following the administration of glucagon. Post-glucagon MGG maps (Figure 2b) taken from data recorded 30 minutes after glucagon administration show that MGGs in individual channels are highly variable in their frequency content. In this case, lower frequency values are recorded in the upper array, while the central and lower parts of the array appear to contain higher-than-normal frequencies. These observations are confirmed by spatial plots of the MGG frequency content, shown in Figure 4. In the pre-glucagon frequency maps shown in Figure 4a, activity is concentrated in the upper (epigastric) portion of the array in the frequency band from 2–3 cpm. Frequency maps obtained from data recorded 37 minutes after administration of glucagon show activity no longer concentrated in one location or in one distinct frequency band. MGG activity appears post-glucagon in frequency ranges that would be considered bradygastric (1–2 cpm) and tachygastric (4–5 cpm).
Figure 4.
a) Spatial maps of MGG signal frequency content shows activity primarily in the 2–3 cpm range before glucagon is administered. b) At t = 35 min, 15 minutes after the second injection of glucagon in this study, the frequency content is distributed into frequency ranges both lower and higher than normal.
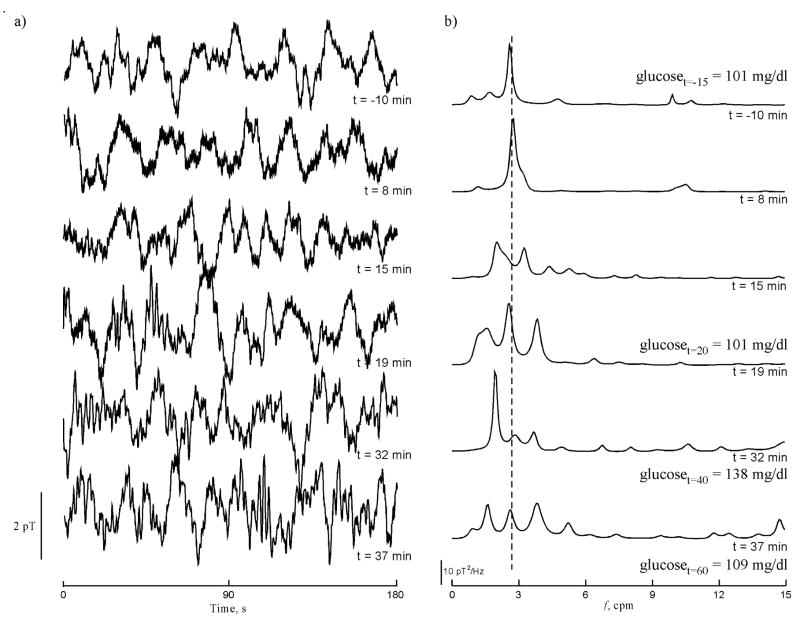
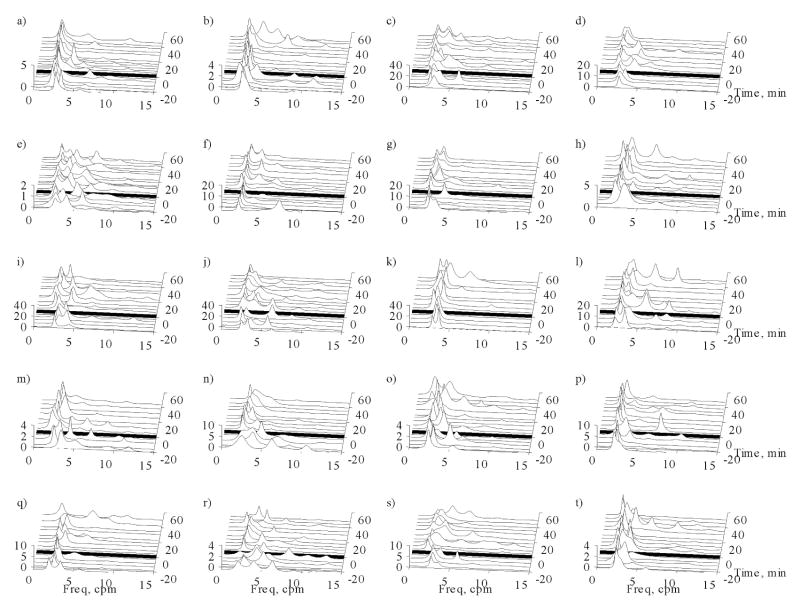
Figure 5 illustrates the effect glucagon had on the magnetic signal in one array channel over the course of one experiment. We observed normal gastric slow waves in baseline (t = −10 min) and in the early period after glucagon was administered (t = 8 min). The power spectrum changed dramatically 15 minutes after glucagon was given, and the effect continued throughout the course of the experiment. We observed peaks in the frequency spectra (Figure 5b) corresponding both to lower- and higher-than-normal slow wave frequencies. The presence of multiple peaks is strongly indicative of rhythm disturbances of the gastric syncytium in response to glucagon. For a more quantitative assessment of signal changes during the course of the experiment, we examined parameters of the power spectra. Running spectral analyses of the MGG data in each of the 20 volunteers during respiration suspension through the time course of the experiments are shown in Figure 6. Before glucagon injection, power spectra tend to reflect only one dominant frequency near the known gastric frequency of 3 cpm. After glucagon administration (indicated by the solid black line in each of the waterfall plots), the power spectra exhibit changes similar to those seen in Figure 5. The spectra in these waterfall plots and the data from which they are computed are used for the analyses of MGG parameters that follow.
Figure 5.
a) MGG signals recorded in a sensor near the center of the array at (4 cm, 0 cm) show the observed magnetic field changes over time as glucagon is administered at t=0 min. Glucagon induces both brady- and tachygastria. b) Power spectra of the MGG data shown in (a) contain peaks at normal gastric frequencies before glucagon is administered and 8 minutes post-glucagon. Signal changes are evident by 15 minutes after glucagon is administered and these changes continue throughout the study. The deviation of these slow wave frequencies from the normal 3 cpm to both “bradygastric” and “tachygastric” ranges suggests that glucagon affects the gastric syncytium resulting in a wider range of gastric slow wave frequencies.
Figure 6.
Running spectral analyses of the MGG from each of the 20 volunteers (a)–(t) plotted during respiration suspension throughout the course of the experiment. These plots further demonstrate that multiple frequencies are recorded after glucagon is infused, as also shown in Figures 7–9.
Effect of Glucagon in MGG and EGG
The level of blood glucose increased from a baseline of 89.8 ± 1.6 mg/dl to 105.7 ± 3.1 mg/dl (p<0.001) 20 minutes after glucagon was administered to 126 ± 3.9 mg/dl (p < 0.001) 40 minutes post-glucagon with a subsequent decrease (yet still with blood glucose significantly higher than baseline levels) to 102.8 ± 4.7 mg/dl (p < 0.01) at the end of the study. Two volunteers reported feeling nauseated shortly after injection of glucagon.
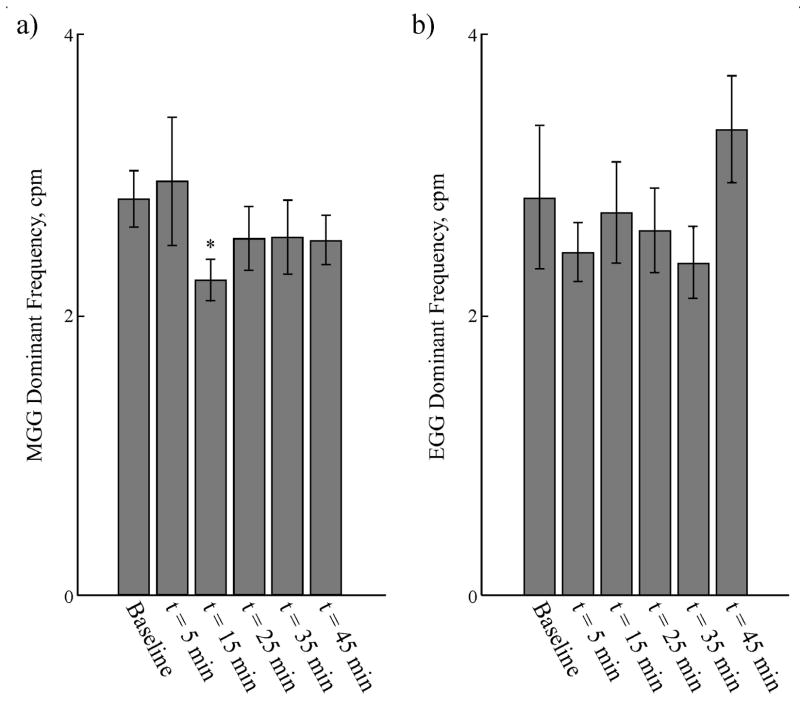
Slow wave frequencies computed from MGG and EGG through the course of the experiment were similar, as shown in Figure 7. MGG slow wave frequencies determined from post-glucagon signals showed a decrease in the slow wave frequencythat became statistically significant 15 minutes after glucagon was injected. By 25 minutes post-injection, the MGG slow wave frequency returned toward normal values with no statistically significant difference from baseline recorded at 25 minutes post-glucagon. EGG slow wave frequencies evaluated at the same time points were statistically similar to those recorded by MGG, although the frequencies had a much larger variation. EGG slow wave frequencies did not show the same decrease as observed in MGG (see Table 1). Pre-glucagon MGG and EGG signal amplitudes (2.6 ± 0.4 pT and 0.13 ± 0.02 mV) did not change significantly after glucagon was administered (2.0 ± 0.3 pT, p = 0.09 and 0.17 ± 0.03 mV post-glucagon, p = 0.1).
Figure 7.
(a) The gastric slow wave frequency determined from MGG exhibited a post-glucagon decrease that was statistically significant at t = 15 min after the glucagon injection. However, MGG slow waves at other time points during the study contained dominant frequencies that did not significantly differ from baseline. (b) EGG slow wave frequencies evaluated at all time points were not statistically different from MGG frequencies, but wider variation in the dominant frequency was noted, and there was no decrease in slow wave frequency noted after glucagon injection.
Table 1.
Temporal changes in slow wave parameters following glucagon injection, (mean ± SEM).
| Time (min post-glucagon) | Dominant MGG Frequency, cpm | Dominant EGG Frequency, cpm | Number of peaks in MGG spectrum | Frequency range of MGG spectral peaks, cpm | Propagation Velocity from SCD Maps, mm/s |
|---|---|---|---|---|---|
| Baseline | 2.8 ± 0.2 | 2.8 ± 0.5 | 1.6 ± 0.14 | 0.88 ± 0.26 | 7.1 ± 0.8 |
| 5 | 2.9 ± 0.5, p = 0.41 | 2.4 ± 0.2, p = 0.26 | 2.05 ± 0.18, p = 0.02 | 1.61 ± 0.33, p = 0.03 | 7.1 ± 0.8, p = 0.49 |
| 15 | 2.2 ± 0.1, p = 0.02 | 2.7 ± 0.4, p = 0.43 | 2.10 ± 0.18, p < 0.01 | 1.57 ± 0.27, p = 0.05 | 5.6 ± 0.3, p = 0.07 |
| 25 | 2.5 ± 0.2, p = 0.20 | 2.6 ± 0.3, p = 0.34 | 1.95 ± 0.17, p = 0.03 | 1.32 ± 0.23, p = 0.10 | 7.1 ± 0.6, p = 0.50 |
| 35 | 2.5 ± 0.3, p = 0.22 | 2.4 ± 0.3, p = 0.22 | 1.95 ± 0.17, p = 0.04 | 1.45 ± 0.25, p = 0.07 | 5.0 ± 0.3, p = 0.02 |
| 45 | 2.5 ± 0.2, p = 0.14 | 3.3 ± 0.4, p = 0.19 | 1.75 ± 0.20, p = 0.21 | 1.11 ± 0.31, p = 0.31 | 5.5 ± 0.4, p = 0.04 |
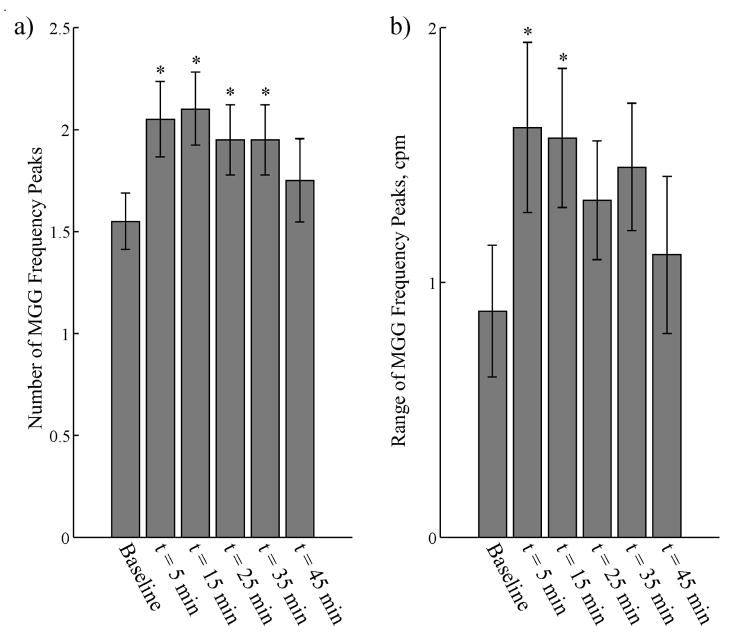
In addition to computing the dominant signal frequency, we also determined the number of peaks in the MGG frequency spectra and the range of these peaks. We used a peak detection algorithm to identify each peak in the spectrum whose spectral value was greater than 25% of the dominant peak. Previous studies have shown that uncoupling of the gastric syncytium precipitates the appearance of multiple, uncoupled pacemaking regions that could increase the number of peaks in the power spectrum and the range of frequencies detected (20; 28). We found a significant increase in the number of MGG frequency peaks after glucagon injection, as shown in Figure 8a. This increased number of peaks returned toward baseline values 45 minutes after glucagon injection. There was also an increase in the range of frequency peaks (Figure 8b), although the increase was only significant for the 5 and 15 minute post-glucagon samples.
Figure 8.
(a) We observed changes in the number of distinct peaks in the MGG power spectra after glucagon injection. Before injection, the AR power spectra contained an average of 1.6 ± 0.1 peaks. There was a significant increase in the number of spectral peaks in spectra obtained 5, 15, 25 and 35 minutes after the glucagon injection. This increase subsided 45 minutes post-glucagon. The increased number of peaks in the power spectrum suggest multiple slow wave frequencies recorded by the SQUID. (b) There were also increases in the range of recorded frequencies at the same time points, but these increases were only significant statistically for the 5 and 15 minute samples. The increases in these power spectrum parameters suggest that the presence of glucagon results in the appearance of slow waves with different frequencies.
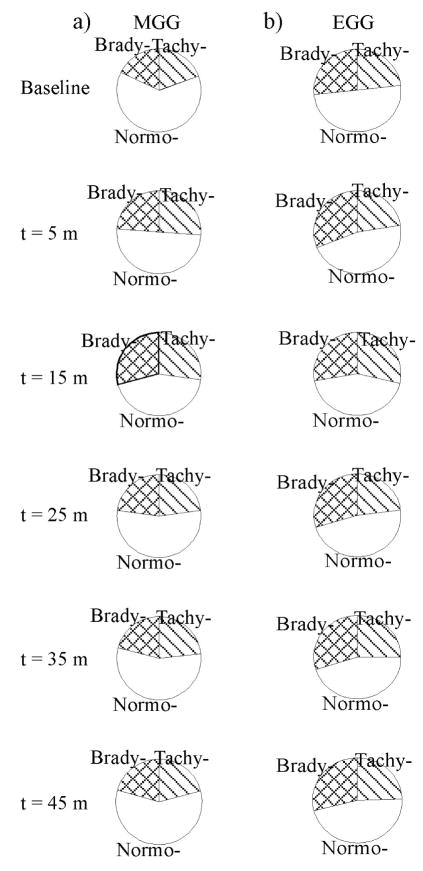
The percent power distribution (PPD) in frequency ranges associated with normal slow waves, bradygastria and tachygastria is frequently cited as indicative of functional changes in the gastric slow wave. In this study, PPDs computed from MGGs changed significantly post-glucagon, as illustrated in Figure 9 and Table 2. Whereas power in regions associated with normal slow wave decreased after glucagon administration (significant decreases noted at t = 5 min, t = 15 min, t = 25 min), the percentage of power in typically brady- and tachygastric regions tended to increase (significant increases noted at t = 5 min and t = 15 min). Similar changes were noted in EGG signals, but with the exception of the tachygastric region at t = 15 min post-glucagon, these changes were not significant statistically. These PPD changes are further suggestive of glucagon-associated functional changes in the gastric syncytium.
Figure 9.
Changes in the Percentage of Power Distributed (PPD) in bradygastric, normogastric and tachygastric frequency ranges in both (a) MGG and (b) EGG suggests that glucagon affects the gastric slow wave frequency spectrum. The enhanced low frequency response of the magnetometer results in a better sensitivity of MGG to changes toward the bradygastric region of the frequency spectrum compared with EGG. Both MGG and EGG signals show a decrease in the normogastric PPD, but significant low frequency changes are also noted in MGG data.
Table 2.
Percent Power Distribution (PPD) changes in MGG and EGG signals following glucagon injection.
| Time (min post-glucagon) | PPD (%), f <2 cpm | PPD (%), f =2–4 cpm | PPD(%), f >4 cpm | |||
|---|---|---|---|---|---|---|
| MGG | EGG | MGG | EGG | MGG | EGG | |
| Baseline | 17.9 ± 3.3 | 26.7 ± 3.9 | 63.1 ± 2.4 | 51.0 ± 3.1 | 19.5 ± 1.9 | 23.2 ± 2.7 |
| 5 | 23.9 ± 3.9, p = 0.16 | 31.3 ± 3.6, p = 0.21 | 50.4 ± 4.7, p < 0.01 | 46.7 ± 4.1, p = 0.21 | 26.2 ± 3.7, p = 0.05 | 22.7 ± 3.3, p = 0.45 |
| 15 | 29.5 ± 4.3, p = 0.02 | 28.1 ± 4.7, p = 0.40 | 44.0 ± 4.4, p < 0.001 | 43.8 ± 4.0, p = 0.07 | 27.5 ± 3.4, p = 0.04 | 29.0 ± 2.8, p = 0.05 |
| 25 | 23.1 ± 4.3, p = 0.12 | 29.8 ± 2.8, p = 0.22 | 54.5 ± 5.2, p = 0.03 | 47.6 ± 3.5, p = 0.24 | 23.1 ± 2.6, p = 0.12 | 23.3 ± 3.3, p = 0.49 |
| 35 | 21.1 ± 4.1, p = 0.27 | 30.0 ± 3.4, p = 0.27 | 56.0 ± 4.3, p = 0.11 | 45.6 ± 3.3, p = 0.13 | 23.5 ± 2.3, p = 0.12 | 25.1 ± 2.3, p = 0.22 |
| 45 | 20.7 ± 4.4, p =0.31 | 29.0 ± 3.7, p =0.28 | 59.0 ± 4.3, p = 0.20 | 47.1 ± 3.8, p = 0.15 | 20.9 ± 2.2, p = 0.28 | 24.8 ± 2.9, p = 0.35 |
Propagation Velocity
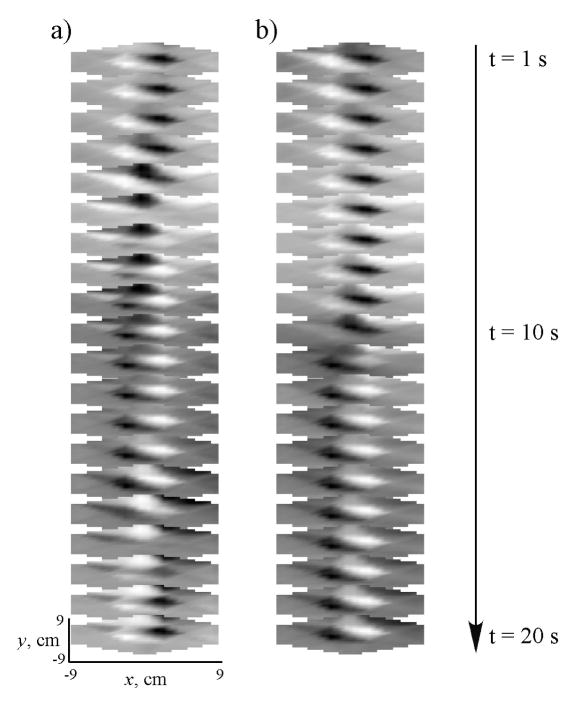
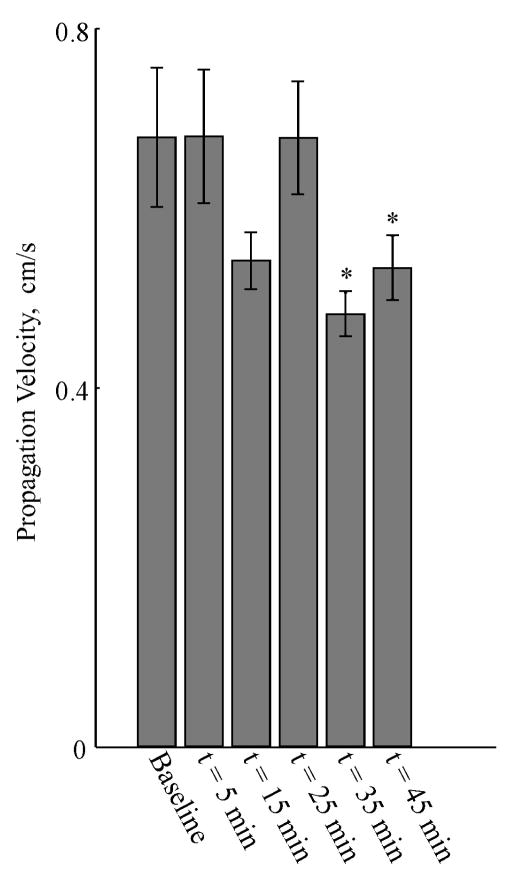
We used the multichannel MGG data to compute surface current density (SCD) maps, and from these maps, we computed the propagation velocity of the MGG signal. SCD maps before and after administration of glucagon are shown in a typical subject in Figure 10a and Figure 10b, respectively, for a twenty second duration during a typical gastric slow wave. Tracking the SCD pattern maximum allows us to estimate the slow wave propagation velocity from the MGG data. Both pre- and post-glucagon SCD sequences are chosen so that the pattern maxima is toward the subject’s left as the sequences begin. During the 20 second sequence, SCD maxima move toward the left side of the map (corresponding to the subject’s right side, the end of the gastric propagation pattern), consistent with the known direction of propagation of the gastric slow wave. In the baseline SCD map sequence, the pattern maxima revert to the right side (subject’s left) in the frame at t = 17 s, where the slow wave sequence is initiated at a location presumably corresponding to the gastric pacemaker. However, the post-glucagon sequence (Figure 10b) clearly shows a substantial delay in the slow wave propagation and does not reset by the end of the 20 s sequence. To quantify this, we computed the time required for the SCD maximum to propagate between two distinct channels, and divided this number by the distance between the channels to obtain our estimate of propagation velocity. The propagation velocities we obtained before glucagon injection correspond well with the known propagation velocity of the gastric slow wave (7.1 ± 0.8 mm/s). Figure 11 shows how the propagation velocity changes during the course of the experiment. A significant decrease in propagation velocity is noted only 35 minutes after glucagon injection, and the propagation velocity of the SCD maximum continues at a decreased rate after 45 minutes.
Figure 10.
a) Surface current density (SCD) maps computed from the pre-glucagon MGG signal plotted sequentially correspond to propagation of the gastric slow wave across the subject’s abdomen. b) The SCD maps after administration of glucagon show a distinct decrease in the slow wave propagation velocity. Whereas in the pre-glucagon baseline recording (a) the SCD maximum propagates through a complete cycle moving from the subject’s left to right and then resetting to the left in the frame at 18 s, the post-glucagon SCD maximum (b) reaches only into the middle of the sensor array.
Figure 11.
Propagation velocity determined from SCD maps computed from the multichannel MGG decreased significantly after the second dose of glucagon was administered at t = 20 m. Although a decrease in propagation velocity is observed at t = 15 min, it was not significantly different from baseline. Subsequently, propagation velocity decreases at t = 35 min and t = 45 min were statistically significant.
Conclusions and Discussion
We measured the effect of glucagon on the electrical slow wave of the stomach by non-invasive assessment of the magnetogastrogram. All 20 subjects exhibited normal gastric slow waves before we administered glucagon, characterized as periodic activity in the biomagnetic signal recorded from multiple SQUID sensors located near the epigastrium. Patterns of gastric magnetic fields were similar to those of a current dipole. The biomagnetic recordings enabled non-invasive evaluation of the frequency, amplitude, spectral characteristics, propagation velocity and percent power distribution of the gastric slow wave.
In previous studies, we have shown that slow wave parameters identified from the MGG agree with corresponding EGG values. We note stronger correlations postprandial, which is one explanation for the apparent (thought not statistically significant) difference between pre-glucagon slow wave frequencies determined from MGG and EGG. The increased postprandial strength of EGG signals results in higher signal-to-noise ratios that facilitate a more accurate computation of the slow wave frequency. Since our study involved only fasted subjects, we observed wider frequency variations, particularly in EGG signals.
Analysis of the biomagnetic power spectra suggested post-glucagon decreases in slow wave frequency in the period 5–15 minutes after glucagon injection, which is consistent with known half-life of glucagon in humans of 8–18 minutes (Eli Lilly and Company, Indianapolis). These changes appear to subside later in the study and the signal frequency return to baseline values. EGG recordings also exhibited a decrease in signal frequency, but primarily because of the wide variation in recorded frequencies, these changes were not observed to be statistically significant.
The EGG measures cutaneous potentials that may be smoothed and attenuated by alternating low- and high-conductivity abdominal layers. Though geometric asymmetries can cause small conductivity effects in the external magnetic signal, the MGG is not as affected by the conductivities of intervening tissues as the EGG and represents the internal sources of bioelectric current (7). Thus, frequency determinations from EGG may be affected by the lower signal-to-noise ratio caused by intervening abdominal layers as compared to frequencies determined by the MGG. However, we note that the much smaller number of sensors employed in this study for EGG recordings as compared to the number of MGG sensors used may bias this study against EGG, and for this reason, we do not feel that our results here reflect the fairest possible comparison of EGG with MGG.
Further analysis of the MGG power spectra suggests that the evaluation of dominant frequency alone may be an insufficient indicator of slow wave changes. We found that the number of peaks in MGG power spectra increased significantly after glucagon injection, as did the range of frequencies at which these peaks were identified. These data suggest that multiple slow waves at different frequencies result from the glucagon injection. Syncytial uncoupling in the stomach is one explanation for the appearance of multiple frequencies, but a definitive classification of these changes as “uncoupling” would require higher spatial resolution for a complete inverse analysis from MGG recordings and/or recordings from multiple electrodes in contact with the gastric syncytium. We hope to address these issues in future work.
We quantified MGG power spectrum changes through the course of the experiment. Although the slow wave frequency was statistically unchanged in the EGG, we did note changes in its PPD that were borderline statistically significant. More significant PPD changes occurred in MGG signals in the period immediately following glucagon injection. While an overall decrease in the slow wave frequency might suggest bradygastria, the additional changes we observed in the PPD, with signal power shifting into both brady- and tachygastric frequency ranges, suggests that glucagon induces more complicated rhythm disturbances in the gastric syncytium that could involve uncoupling, ectopic pacemakers, conduction pathway blocks and/or re-entry loops, similar to effects observed in diseased myocardium. We have observed similar PPD effects in mechanically uncoupled gastric tissue (2; 29) and in vagotomized rabbits (6).
We also observed a decrease in the propagation velocity of the biomagnetic signature of the gastric slow wave after administration of glucagon. Interestingly, these changes were not observed to be significant statistically until the later part of the study, which may suggest a longer temporal effect on gastric activity from glucagon. The determination of propagation velocity from EGG remains an elusive goal. While studies have demonstrated that multiple EGG sensors may contain phase shifts consistent with propagation (10), the ability to compute the propagation velocity reliably has not been shown, in part due to the loss of spatial resolution caused by the intervening volume conductor layers in the abdomen (7). On this basis some have questioned the validity of parametric information besides temporal frequencies obtained from EGG (11; 24; 26). We should note, however, that the spatial resolution of our magnetometer as well as the distance of the sensors from the gastric sources allows us to compute only a single value for the propagation velocity, whereas the gastric syncytium is known to have a distally increasing velocity of propagation. It is likely that the propagation we are observing is primarily in the antrum where biomagnetic signals would be stronger than in the corpus.
Hyperglycemia has been shown to increase the occurrence of both dysrhythmias and arrhythmias in gastric slow waves, but tachygastria is more consistently observed in EGG signals (1; 12–14; 18). For both normal subjects and in gastroparetics, hyperglycemia is associated with decreased gastric emptying, and it attenuates the effects of prokinetic agents (15; 16; 19; 30; 32). The causative relationship between hyperglycemia and gastric dysrhythmias is unknown, but the similarity between these dysrhythmias and those observed during uncoupling of the ICC network has been noted (12; 13; 31). In particular, the results of Qian et al. suggest that an ectopic pacemaker in the distal antrum causes both tachygastria and bradygastria (31), though a recent study of ICC population depletion in both diabetic and idiopathic gastroparesis showed only tachygastria in EGG recordings (12). Horvath and colleagues have presented evidence that ICC population depletion in diabetes is caused not by hyperglycemia, but by reduced insulin and IGF-I signalling (17), suggesting that the evaluation of insulin and IGF levels may be more critical than that of glucose, as in the present study. The difficulty of obtaining high-quality common mode rejection in the EGG at low frequencies may be one explanation for the observed prevalence of tachygastria over bradygastria, whereas our power spectra from our MGG recordings with DC-SQUID magnetometers reflect primarily lower dominant signal frequencies after glucagon injection. The distinction between bradygastria, tachygastria, gastric uncoupling and other rhythm disturbances may prove critical to the characterization of gastric electrical abnormalities and may have a significant influence on the direction of treatment options. A study by Brzana et al. showed that EGG parameters were different in patients with gastric outlet obstruction and patients with idiopathic gastroparesis (9). Further, many of the effects we observed from glucagon injection were small and only borderline significant statistically. These effects may be dose-dependent, and we intend to conduct further studies into the relationship between blood glucose, insulin and IGF-I levels and MGG and EGG signal changes.
The sensitive low-frequency response of the SQUID magnetometer combined with the ability to obtain data from multiple spatially distributed sensors allowed non-invasive, noncontact characterization of glucagon-associated rhythm disturbances by the assessment of the slow wave frequency profile, including the dominant frequency, the number and range of spectral peaks, the percentage of power distributed in MGG signals, and the evaluation of slow wave propagation velocity. The ability to assess noninvasively these slow wave parameters may prove critical to the effective clinical assessment of gastric disorders such as gastroparesis.
Some of the challenges to be addressed as clinical implementation is pursued include better noise response due to motion artefact and ambient magnetic noise. Although we are always able to detect and record the magnetogastrogram, we use a magnetically shielded room and take special precautions to avoid unnecessary motion of metallic objects during the study. Continuous technological advances are increasing the ability of SQUID magnetometers to be used in unshielded, clinical environments. Furthermore, operational costs for the SQUID are relatively high owing to the necessity of using liquid helium as a cryogen for the SQUID sensors. We will continue to monitor the development of high-temperature superconductors and explore their use in our gastrointestinal applications, as they are already being employed in clinical investigations of the magnetocardiogram and without magnetic shielding (21; 22). In concert with improvements to our signal-to-noise ratio, we are working on signal identification and signal processing methods that will allow us to better reject physiological noise in our signals such as respiration artefact and non-physiological noise such as the magnetic signature of moving metal objects. Also, we are continuing to work on more sophisticated algorithms for the inverse analysis of externally-recorded biomagnetic fields to get a more accurate representation of the underlying gastric sources of bioelectric current.
Acknowledgments
The authors wish to thank Joan Kaiser, RN for experimental assistance, and Andrei Irimia for his helpful comments. The authors also acknowledge the support of the General Clinical Research Center via grant M01 RR-00095 from the National Center for Research Resources, National Institutes of Health at Vanderbilt University. Funding for this study was provided by grants from the National Institutes of Health (R01 DK 58697 and R01 DK 58197).
Reference List
- 1.Abell TL, Malagelada JR. Glucagon-evoked gastric dysrhythmias in humans shown by an improved electrogastrographic technique. Gastroenterology. 1985;88:1932–1940. doi: 10.1016/0016-5085(85)90022-8. [DOI] [PubMed] [Google Scholar]
- 2.Bradshaw LA. In: Vargas FM, Franco RH, Juarez GG, editors. Biomagnetic techniques for assessing gastric and small bowel electrical activity; Proceedings of the 8th Mexican Symposium on Medica Physics. Ref Type: Conference Proceeding.2004. pp. 8–13. [Google Scholar]
- 3.Bradshaw LA, Irimia A, Sims JA, Gallucci MR, Palmer RL, Richards WO. Biomagnetic characterization of spatiotemporal parameters of the gastric slow wave. Neurogastroenterol Motil. 2006;18:619–631. doi: 10.1111/j.1365-2982.2006.00794.x. [DOI] [PubMed] [Google Scholar]
- 4.Bradshaw LA, Ladipo JK, Staton DJ, Wikswo JP, Jr, Richards WO. The human vector magnetogastrogram and magnetoenterogram. IEEE Trans Biomed Eng. 1999;46:959–970. doi: 10.1109/10.775406. [DOI] [PubMed] [Google Scholar]
- 5.Bradshaw LA, Myers A, Wikswo JP, Richards WO. A spatio-temporal dipole simulation of gastrointestinal magnetic fields. IEEE Trans Biomed Eng. 2003;50:836–847. doi: 10.1109/TBME.2003.813549. [DOI] [PubMed] [Google Scholar]
- 6.Bradshaw LA, Myers AG, Redmond A, Wikswo JP, Richards WO. Biomagnetic detection of gastric electrical activity in normal and vagotomized rabbits. Neurogastroenterol Motil. 2003;15:475–482. doi: 10.1046/j.1365-2982.2003.00432.x. [DOI] [PubMed] [Google Scholar]
- 7.Bradshaw LA, Richards WO, Wikswo JP., Jr Volume conductor effects on the spatial resolution of magnetic fields and electric potentials from gastrointestinal electrical activity. Med Biol Eng Comput. 2001;39:35–43. doi: 10.1007/BF02345264. [DOI] [PubMed] [Google Scholar]
- 8.Bradshaw LA, Wikswo JP. Autoregressive and eigenfrequency spectral analysis of magnetoenterographic signals. Proceedings of the 17th Annual IEEE EMBS. 1995;17:CD-ROM. [Google Scholar]
- 9.Brzana RJ, Koch KL, Bingaman S. Gastric myoelectrical activity in patients with gastric outlet obstruction and idiopathic gastroparesis. Am J Gastroenterol. 1998;93:1803–1809. doi: 10.1111/j.1572-0241.1998.00524.x. [DOI] [PubMed] [Google Scholar]
- 10.Chen JD, Zou X, Lin X, Ouyang S, Liang J. Detection of gastric slow wave propagation from the cutaneous electrogastrogram. Am J Physiol. 1999;277:G424–G430. doi: 10.1152/ajpgi.1999.277.2.G424. [DOI] [PubMed] [Google Scholar]
- 11.Familoni BO, Kingma YJ, Bowes KL. Study of trans cutaneous and intraluminal measurement of gastric electrical. Med Biol Eng Comput. 1987;25:397–402. doi: 10.1007/BF02443360. [DOI] [PubMed] [Google Scholar]
- 12.Forster J, Damjanov I, Lin Z, Sarosiek I, Wetzel P, McCallum RW. Absence of the interstitial cells of Cajal in patients with gastroparesis and correlation with clinical findings. J Gastrointest Surg. 2005;9:102–108. doi: 10.1016/j.gassur.2004.10.001. [DOI] [PubMed] [Google Scholar]
- 13.Gonlachanvit S, Chen YH, Hasler WL, Sun WM, Owyang C. Ginger reduces hyperglycemia-evoked gastric dysrhythmias in healthy humans: possible role of endogenous prostaglandins. J Pharmacol Exp Ther. 2003;307:1098–1103. doi: 10.1124/jpet.103.053421. [DOI] [PubMed] [Google Scholar]
- 14.Hasler WL, Soudah HC, Dulai G, Owyang C. Mediation of hyperglycemia-evoked gastric slow-wave dysrhythmias by endogenous prostaglandins. Gastroenterology. 1995;108:727–736. doi: 10.1016/0016-5085(95)90445-x. [DOI] [PubMed] [Google Scholar]
- 15.Hebbard GS, Samson M, Andrews JM, Carman D, Tansell B, Sun WM, Dent J, Horowitz M. Hyperglycemia affects gastric electrical rhythm and nausea during intraduodenal triglyceride infusion. Dig Dis Sci. 1997;42:568–575. doi: 10.1023/a:1018851227051. [DOI] [PubMed] [Google Scholar]
- 16.Horowitz M, O’Donovan D, Jones KL, Feinle C, Rayner CK, Samsom M. Gastric emptying in diabetes: clinical significance and treatment. Diabet Med. 2002;19:177– 194. doi: 10.1046/j.1464-5491.2002.00658.x. [DOI] [PubMed] [Google Scholar]
- 17.Horvath VJ, Vittal H, Ordog T. Reduced insulin and IGF-I signaling, not hyperglycemia, underlies the diabetes-associated depletion of interstitial cells of Cajal in the murine stomach. Diabetes. 2005;54:1528–1533. doi: 10.2337/diabetes.54.5.1528. [DOI] [PubMed] [Google Scholar]
- 18.Jebbink RJ, Samsom M, Bruijs PP, Bravenboer B, Akkermans LM, Vanberge-Henegouwen GP, Smout AJ. Hyperglycemia induces abnormalities of gastric myoelectrical activity in patients with type I diabetes mellitus. Gastroenterology. 1994;107:1390–1397. doi: 10.1016/0016-5085(94)90541-x. [DOI] [PubMed] [Google Scholar]
- 19.Kim CH, Azpiroz F, Malagelada JR. Characteristics of spontaneous and drug-induced gastric dysrhythmias in a chronic canine model. Gastroenterology. 1986;90:421–427. doi: 10.1016/0016-5085(86)90942-x. [DOI] [PubMed] [Google Scholar]
- 20.Kim CH, Zinsmeister AR, Malagelada JR. Mechanisms of canine gastric dysrhythmia. Gastroenterology. 1987;92:993–999. doi: 10.1016/0016-5085(87)90975-9. [DOI] [PubMed] [Google Scholar]
- 21.Leder U, Schrey F, Haueisen J, Dorrer L, Schreiber J, Liehr M, Schwarz G, Solbrig O, Figulla HR, Seidel P. Reproducibility of HTS-SQUID magnetocardiography in an unshielded clinical environment. Int J Cardiol. 2001;79:237–243. doi: 10.1016/s0167-5273(01)00440-5. [DOI] [PubMed] [Google Scholar]
- 22.Li Z, Wakai RT, Paulson DN, Schwartz B. HTS magnetometers for fetal magnetocardiography. Neurol Clin Neurophysiol. 2004;2004:25. [PubMed] [Google Scholar]
- 23.Long QL, Fang DC, Shi HT, Luo YH. Gastro-electric dysrhythm and lack of gastric interstitial cells of cajal. World J Gastroenterol. 2004;10:1227–1230. doi: 10.3748/wjg.v10.i8.1227. [DOI] [PMC free article] [PubMed] [Google Scholar]
- 24.Mintchev MP, Bowes KL. Comparative quantification of gastric electrical activity and electrogastrograms. Med Biol Eng Comput. 1998;36:96–100. doi: 10.1007/BF02522864. [DOI] [PubMed] [Google Scholar]
- 25.Mintchev MP, Bowes KL. Computer simulation of the effect of changing abdominal thickness on the electrogastrogram. Med Eng Phys. 1998;20:177–181. doi: 10.1016/s1350-4533(98)00019-8. [DOI] [PubMed] [Google Scholar]
- 26.Mintchev MP, Kingma YJ, Bowes KL. Accuracy of cutaneous recordings of gastric electrical activity. Gastroenterology. 1993;104:1273–1280. doi: 10.1016/0016-5085(93)90334-9. [DOI] [PubMed] [Google Scholar]
- 27.Ordog T, Baldo M, Danko R, Sanders KM. Plasticity of electrical pacemaking by interstitial cells of Cajal and gastric dysrhythmias in W/W mutant mice. Gastroenterology. 2002;123:2028–2040. doi: 10.1053/gast.2002.37056. [DOI] [PubMed] [Google Scholar]
- 28.Owyang C, Hasler WL. Physiology and pathophysiology of the interstitial cells of Cajal: from bench to bedside. VI. Pathogenesis and therapeutic approaches to human gastric dysrhythmias. Am J Physiol Gastrointest Liver Physiol. 2002;283:G8–15. doi: 10.1152/ajpgi.00095.2002. [DOI] [PubMed] [Google Scholar]
- 29.Palmer RL, Bradshaw LA, Myers AG, McDowell JG, Richards WO. Use of magnetogastrogram for detecting gastric uncoupling in an animal model. Neurogastroenterol Motil. 2002;14(4):445. Ref Type: Abstract. [Google Scholar]
- 30.Petrakis IE, Vrachassotakis N, Sciacca V, Vassilakis SI, Chalkiadakis G. Hyperglycaemia attenuates erythromycin-induced acceleration of solid-phase gastric emptying in idiopathic and diabetic gastroparesis. Scand J Gastroenterol. 1999;34:396–403. doi: 10.1080/003655299750026416. [DOI] [PubMed] [Google Scholar]
- 31.Qian LW, Pasricha PJ, Chen JD. Origins and patterns of spontaneous and drug- induced canine gastric myoelectrical dysrhythmia. Dig Dis Sci. 2003;48:508–515. doi: 10.1023/a:1022532515172. [DOI] [PubMed] [Google Scholar]
- 32.Rayner CK, Su YC, Doran SM, Jones KL, Malbert CH, Horowitz M. The stimulation of antral motility by erythromycin is attenuated by hyperglycemia. Am J Gastroenterol. 2000;95:2233–2241. doi: 10.1111/j.1572-0241.2000.02250.x. [DOI] [PubMed] [Google Scholar]
- 33.Sanders KM, Ordog T, Koh SD, Torihashi S, Ward SM. Development and plasticity of interstitial cells of Cajal. Neurogastroenterol Motil. 1999;11:311–338. doi: 10.1046/j.1365-2982.1999.00164.x. [DOI] [PubMed] [Google Scholar]


