

Abstract
Robust single-stranded DNA (ssDNA) microarrays are created by attaching amine-modified oligonucleotides to a monolayer of poly-L-glutamic acid (pGlu) that is electrostatically adsorbed onto a chemically modified gold thin film. This surface attachment chemistry methodology is first characterized with a combination of polarization-modulation Fourier transform infrared (PM-FTIR) spectroscopy and surface plasmon resonance (SPR) angle shift measurements. SPR imaging (SPRI) measurements of these ssDNA microarrays are then used to study two surface bioaffinity interactions: (i) the quantitative hybridization adsorption of complementary ssDNA onto mixed ssDNA microarray elements, and (ii) the adsorption of single-stranded binding protein (SSB) onto fully and partially hybridized DNA microarray elements. The Langmuir adsorption coefficient (KAds) of SSB binding to ssDNA was determined to be 5.5 (±0.4)× 109 M-1.
I. Introduction
DNA microarrays have become a mainstay for nucleic acid bioaffinity sensing measurements, with applications to a variety of biotechnological applications such as DNA diagnostics and detection,1 gene expression analysis,2 single nucleotide polymorphism (SNP) genotyping,3 and microRNA profiling.4 These arrays are used primarily for the detection and identification of complementary DNA or RNA by sequence-specific adsorption onto an array element consisting of single-stranded DNA (ssDNA) or RNA oligonucleotides that are chemically attached to the surface. It is assumed that the sequence specificity of the adsorption is due to the hybridization of the solution nucleic acids with the surface-bound oligonucleotides; this process is termed “hybridization adsorption.”
Although the vast majority of DNA microarray experiments detect the hybridization adsorption of fluorescently labeled DNA onto glass surfaces with fluorescence imaging, an increasingly popular alternative method is to detect the hybridization adsorption of unlabeled DNA or RNA onto chemically modified gold thin films with the optical technique of surface plasmon resonance imaging (SPRI).5,6 SPRI has been used to quantitatively detect not only unlabeled DNA and RNA, but also the adsorption of unlabelled proteins such as transcription factors onto DNA microarrays.7 Recent SPRI biosensing applications of DNA microarrays are becoming increasingly complex, often augmenting a hybridization adsorption event with a second surface enzymatic reaction to further process the adsorbed DNA and yield additional information.8 For example, SPRI measurements of SNP genotyping have been performed with DNA microarrays by using a surface ligation reaction after hybridization adsorption to detect and identify a single nucleotide in an adsorbed DNA strand.9
In all of these applications, it is essential to have a robust, non-interfering DNA attachment chemistry for the SPRI measurements on gold thin films. The microarray surface chemistry controls the accessibility and reactivity of the attached oligonucleotides for both hybridization adsorption and surface enzymatic processing. Moreover, the surface chemistry must control the specific and nonspecific adsorption of proteins and enzymes onto the array elements during the biosensing process. A variety of attachment chemistries on gold surfaces have been explored for the creation of “robust” DNA microarrays for SPRI; a common attachment strategy is the direct adsorption of a thiol-modified oligonucleotide onto the gold surface.10,11 While this method is important for electrochemical detection methods that require the DNA to be close to the metal-electrolyte interface, SPRI measurements can sense hybridization adsorption within 200 nm of the gold surface. Thus, attachment schemes that tether surface-bound “probe” oligonucleotides farther away from the surface can be used to obtain better hybridization adsorption performance. DNA microarrays on gold surfaces have also been created by attaching biotin-modified ssDNA to biotin-terminated alkanethiols via noncovalent biotin-streptavidin interactions.12,13 Surface attachment chemistries that use a protein such as streptavidin are potentially subject to additional nonspecific adsorption of proteins from solution via protein-protein interactions. Most “robust” DNA surface attachment chemistries create a covalent bond with the surface by reacting either an amine-modified ssDNA (at either the 5′ or 3′ end) to an amine-reactive surface monolayer to form an amide bond, or a thiol-modified ssDNA to a thiol-reactive surface monolayer to form a sulfur-carbon or sulfur-sulfur bond. For the amine-reactive surface, a carboxylic acid terminated alkanethiol is typically used to form an amide bond to the amine-modified ssDNA via a carbodiimide coupling reaction.14,15 Thiol-modified oligonucleotides have been attached to alkanethiol-modified gold surfaces via coupling reactions that form either a disulfide or a maleimide bond.16,17 For all of these attachment chemistries, it is essential that the surface coverage, bioavailability, and resistance to nonspecific adsorption of both DNA and proteins be thoroughly characterized.
In this paper, we characterize and implement a new methodology for ssDNA microarray fabrication that uses the chemical attachment of amine-modified oligonucleotides onto an electrostatically adsorbed monolayer of the anionic polypeptide poly-L-glutamic acid (pGlu). SPRI measurements demonstrate that these robust ssDNA microarrays exhibit very high surface hybridization efficiency, have very little nonspecific adsorption, provide additional biomolecule accessibility and can be used in complex, multi-step biosensing assays. The pGlu attachment chemistry process is depicted schematically in Figure 1. We have used pGlu monolayers previously in conjunction with monolayers of the cationic polypeptide poly-L-lysine (pLys) to form ultrathin hydrophilic films at gold surfaces by the process of layer-by-layer (LbL) electrostatic adsorption.18 As shown in the Figure, pGlu that is electrostatically adsorbed onto an amine-terminated alkanethiol monolayer is used to attach amine-modified DNA onto the gold film via a carbodiimide coupling reaction that simultaneously forms amide bonds between the pGlu and the amine-terminated DNA as well as the pGlu and the amine-terminated alkanethiol monolayer. This surface attachment chemistry differs from previous amine-carboxylic acid attachment chemistries that utilize an amide bond formation reaction with self assembled monolayers or silane polymer films in several ways: (i) the use of electrostatic adsorption for pGlu deposition controls the amount and spacing of pGlu carboyxlic acid groups on the surface, (ii) the amide bond formation reaction attaches both the amine-terminated ssDNA onto the pGlu and the pGlu onto the amine-terminated monolayer, and (iii) the use of pGlu provides additional flexibility for the surface-attached ssDNA, which makes it easier to hybridize and form dsDNA on the surface. A combination of polarization modulation Fourier transform infrared (PM-FTIR) spectroscopy and SPR angle shift measurements are used to characterize the formation of ssDNA monolayers on gold thin films. We then fabricate DNA microarrays and employ SPRI to both quantitatively measure the hybridization adsorption of DNA onto the microarray elements and quantitatively monitor the adsorption of single-stranded binding protein (SSB) onto fully and partially hybridized DNA microarrays. From these measurements, we calculate a Langmuir adsorption coefficient (KAds) of 5.5 (±0.4) × 109 M-1.
Figure 1.

Three-step reaction scheme for attaching amine-terminated ssDNA onto gold surfaces. (a) A self-assembled monolayer of amino-undecanethiol (MUAM) is immobilized onto the gold substrate. (b) A monolayer of poly-L-glutamic acid (pGlu) is electrostatically adsorbed onto the MUAM monolayer. (c) Amine-terminated ssDNA is covalently attached to the pGlu monolayer by a carbodiimide-catalyzed amide bond formation reaction using EDC and NHSS. At the same time, the pGlu monolayer is also covalently attached to the MUAM monolayer by the carbodiimide coupling reaction.
II. Experimental Considerations
Materials
The chemicals 11-amino-1-undecanethiol hydrochloride (MUAM; Dojindo), poly-L-glutamic acid sodium salt (MW = 50,000-100,000) (pGlu; Sigma), 1-ethyl-3-(3-dimethylaminopropyl) carbodiimide hydrochloride (EDC; Pierce), N-hydroxysulfosuccinimide (NHSS; Pierce) and single-stranded DNA binding protein (MW=75,372) (SSB; Epicentre Biotechnologies) were used as received. A PBS buffer (100 mM Na2HPO4, 0.3M NaCl, 5 mM MgCl2, 1 mM EDTA, adjusted to pH 7.4) was used for all DNA and SSB binding measurements. Four ssDNA sequences were purchased from Integrated DNA Technologies and used as received; the sequences are denoted A, Ac, B and Bc:
A=5′-NH2-(CH2) 12-CGAAATCCAGACACATAAGCACGAACCGAA-3′;
Ac=5′- TTCGGTTCGTGCTTATGTGTCTGGATTTCG-3′,
B=5′- NH2-(CH2) 12- (T)30-3′,
Bc=5′-(A) 30-3′.
Two types of gold thin films were used in the experiments: (i) for SPR, 45 nm gold films with a 1 nm Cr underlayer were vapor-deposited onto SF10 glass slides (18 mm × 18 mm, Schott Glass Technologies) using a Denton DV-502A evaporator, and (ii) for PM-FTIR, gold-coated silica slides (100nm Au with a 5 nm Cr underlayer) were obtained from Evaporated Metal Films. All gold films were rinsed with ethanol and water prior to use.
DNA Attachment Chemistry
ssDNA was attached onto the gold films in a three-step process: (i) formation of a self-assembled MUAM monolayer by immersion of the slide in a 1 mM ethanolic MUAM solution for at least 24 h, (ii) pGlu monolayer formation by immersion in 2 mg/mL pGlu solution in PBS buffer for 1 h; (iii) exposure of the surface to an optimized 250 μM amine-modified ssDNA solution in a PBS buffer that contained 75 mM EDC and 15 mM NHSS for 4 h. Each step was followed by a rinsing step and drying in a nitrogen stream. The first rinsing step used ethanol followed by water. The second and third rinsing steps used PBS buffer.
DNA Microarray Fabrication
ssDNA microarrays were fabricated using a metal mask to vapor deposit 12 gold film spots (1.0 mm diameter) onto SF10 glass slides. Amine-terminated ssDNA (sequences A and B in different percentage ratios) was attached to the gold array spots with the DNA surface attachment chemistry described above; 0.5 μL of a 250 μM amine-terminated ssDNA solution was used for each spot. Control spots were created by exposure of the gold surface to only MUAM and then pGlu. The microarray was rinsed with water and dried by nitrogen gas prior to use. For the hybridization adsorption experiments, 100 μL of a 1μM complementary ssDNA solution (sequences Ac or Bc) was introduced into the in situ SPRI cell and allowed to react for 15 min. For the SSB binding experiments, 100 μL of a 10 nM SSB solution was introduced into the in situ SPRI cell and allowed to react for 15 min.
PM-FTIR Measurements
PM-FTIR spectra were obtained using a Mattson RS-1 spectrometer with real-time interferogram sampling electronics and an optical layout described previously.19 Spectra in the mid-IR region (1000-2000 cm-1) were collected by co-adding 1000 scans at 4 cm-1 resolution. The PM-FTIR differential reflectance (%ΔR) values were converted to absorbance units as described elsewhere.19
Scanning Angle SPR Measurements
A scanning angle SPR apparatus (percent reflectivity (%R) vs. incident angle (θ)) was constructed using the following components: a 632.8 nm HeNe laser (JDS Uniphase, 7.5 mW), a polarizer, a mechanical chopper (Stanford Research System, SR540, 1000 Hz), a stepper motor-controlled θ-2θ rotating angle stage with 0.0025 degrees resolution, a photodiode detector (EG&G) and a lock-in amplifier (EG&G, 7220 DSP). The instrument was controlled by computer using a LabVIEW program (National Instruments). The samples were placed on the rotating stage in an in situ cell consisting of a 60° SF10 prism and a 100 μL flow cell described elsewhere.20 The p-polarized reflectivity data was converted to %R by setting the value of the reflectivity at the critical angle equal to 85%, and is plotted as %R vs. θ.
SPR Imaging Measurements
SPRI measurements of differential reflectivity images (Δ%R) at 830 nm were obtained using an SPRimager instrument (GWC Technologies) as described elsewhere.21
III. Results and Discussion
A. PM-FTIR and SPR Angle Shift Characterization Measurements
A combination of PM-FTIR spectroscopy and SPR angle shift measurements were used to characterize the attachment chemistry for immobilizing ssDNA onto chemically modified gold thin films as shown in Figure 1. The DNA attachment chemistry is composed of three steps: (i) formation of an amine-terminated alkanethiol self-assembled monolayer of MUAM on the gold thin film, (ii) the electrostatic adsorption of a monolayer of pGlu onto the positively charged MUAM monolayer, and (iii) the creation of a DNA monolayer by the simultaneous covalent attachment via an EDC/NHSS carbodiimide coupling reaction of the pGlu carboxylic acid moieties with the MUAM monolayer and the amine-terminated ssDNA oligonucleotides from solution. The use of a pGlu monolayer provides additional freedom for the amide bond formation reaction, and increases the ssDNA availability for hybridization and protein binding.
PM-FTIR measurements
The PM-FTIR spectra of the ssDNA monolayer attachment chemistry are shown in Figure 2. The mid-IR region of the PM-FTIR spectrum of the MUAM alkanethiol monolayer is shown in the Figure as trace (a). This spectrum is featureless except for a small CH2 bending/rocking band at 1461 cm-1. After exposing the MUAM monolayer to a pGlu solution, the spectrum labeled (b) in Figure 2 is obtained. This PM-FTIR spectrum shows several new bands due to the electrostatic adsorption of pGlu onto the surface: the characteristic amide I and amide II bands of the polypeptide backbone at 1660 and 1542 cm-1 respectively, and bands at 1720 and 1400 cm-1 (very weak) which are assigned respectively to the protonated carboxylic acid groups R-COOH and the carboxylate groups R-COO- of the pGlu monolayer. The presence of a protonated carboxylic acid band in the spectrum suggests that not all of the carboxylic acids in the pGlu can interact with the R-NH3+ groups of the MUAM monolayer. For comparison, the PM-FTIR spectrum of an electrostatic multilayer film formed by the alternating deposition of pGlu and poly-L-lysine (pLys) shows a very strong carboxylate band at 1400 cm-1.22 The electrostatic nature of the pGlu adsorption onto the MUAM monolayer was verified by loss of the amide I and amide II bands from the surface PM-FTIR spectrum when the slides were rinsed with either a low pH solution (2M HCl, pH = 2) or high pH solution (2M NaOH, pH = 11). At these pH values the formation of either R-COOH or R-NH2 leads to the disruption of the NH3+/COO- electrostatic interactions and desorption of the pGlu monolayer.
Figure 2.
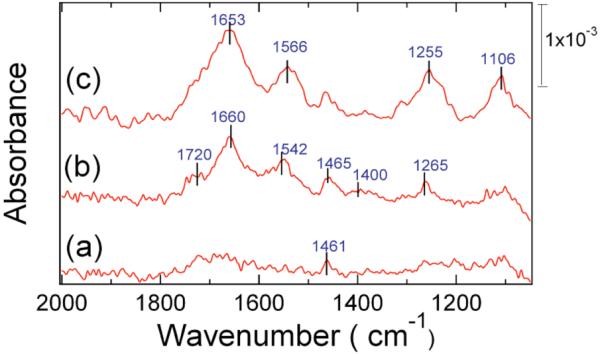
PM-FTIR spectra of the three-step ssDNA surface attachment chemistry. (a) Self-assembled MUAM monolayer. (b) Addition of an electrostatically adsorbed pGlu monolayer. (c) Addition of covalently attached ssDNA to the pGlu monolayer. FTIR band assignments are listed in Table I.
Oligonucleotides were chemically attached to the pGlu monolayer by exposing the surface to a solution of amine-terminated ssDNA that contained the coupling reagents EDC and NHSS. The EDC and NHSS simultaneously catalyze two amide bond formation reactions with the pGlu carboxylic acid side chains: the attachment of amine-terminated ssDNA to the pGlu monolayer, and the attachment of pGlu monolayer to the MUAM monolayer. The PM-FTIR spectrum of the monolayer after these reactions is shown in Figure 2 as curve (c). The R-COOH band at 1720 cm-1 has disappeared, and two new bands at 1255 and 1106 cm-1 have appeared and are assigned to phosphate group vibrations from the ssDNA that has been attached onto the surface. The intensity of these bands is comparable to those observed from ssDNA monolayers attached to gold surfaces with other reaction schemes.16,23 From a phosphate band absorbance of 5 × 10⁻⁴ A.U. at 1106 cm-1, we can estimate a ssDNA surface density of 4 (± 2) × 1012 molecules/cm2.24
SPR angle shift measurements
To complement the PM-FTIR monolayer characterization experiments, a set of sequential SPR angle shift measurements were used to evaluate film thickness during the surface attachment chemistry. Figure 3 shows a set of four SPR Reflectivity curves obtained in PBS buffer. The first curve (dashed line) was obtained from the bare gold surface, and the second curve (solid line) was obtained after the formation of a MUAM monolayer on the gold thin film. A shift of 0.26 degrees of the SPR angle was observed (as listed in Table 2). Utilizing a four phase Fresnel calculation program 25-27 (SF10/gold/MUAM/buffer) employing the refractive indices listed in Table 2, we calculated a MUAM monolayer thickness of 1.8 nm. This value is in agreement with other SPR C11 alkanethiol monolayer thickness measurements.23 The third curve in Figure 3 (dash-dotted line) was obtained after the electrostatic adsorption of a pGlu monolayer. An additional SPR angle shift of 0.43 degrees was observed, and a pGlu monolayer thickness of 1.7 nm was obtained from a five phase Fresnel calculation (SF10/gold/MUAM/pGlu/buffer). This thickness is similar to that calculated from other SPR measurements of electrostatically adsorbed pGlu monolayers.25,28 The fourth curve (dotted line) in Figure 3 was obtained after the amide attachment reaction of the ssDNA to the surface. An additional shift of 0.19 degrees was observed. A six phase Fresnel calculation (SF10/gold/MUAM/pGlu/ssDNA/buffer) was used to determine a ssDNA monolayer thickness of 1.1 nm. This value is similar to that obtained previously from SPR measurements on ssDNA monolayers attached onto pLys-modified gold thin films.23 From this series of SPR angle shift measurements, we can confirm that: (i) the reaction scheme in Figure 1 reliably leads to the formation of a 1.1 nm ssDNA monolayer, and (ii) this ssDNA monolayer is spaced from the gold surface by an ultrathin (1.7 nm) pGlu monolayer for increased bioavailability.
Figure 3.
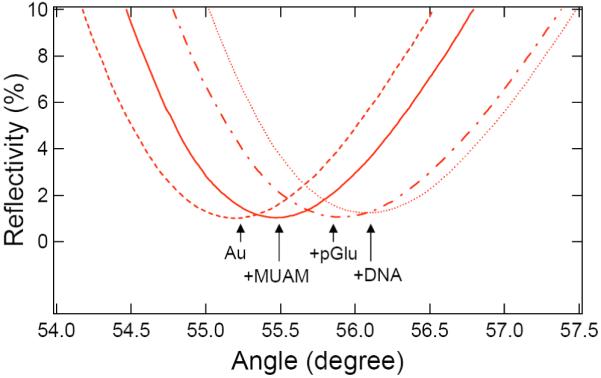
In situ scanning SPR curves (reflectivity vs. incident angle) of the three-step DNA attachment chemistry onto a 45 nm gold thin film. The four SPR curves are obtained from bare gold (dashed line), after the formation of a self-assembled MUAM monolayer (solid line), after the electrostatic adsorption of a pGlu monolayer (dash-dotted line), and after the attachment of amine-terminated ssDNA (dotted line). See Table II for the SPR angle shifts and film thicknesses.
Table II.
SPR Angle Shifts and Calculated Film Thicknesses
B. SPRI Measurements of Hybridization Adsorption
Having characterized the pGlu ssDNA attachment chemistry, a set of SPRI measurements were performed to determine the fidelity of DNA hybridization adsorption onto these ssDNA monolayers. Quantitative SPRI measurements of DNA hybridization adsorption were performed on a six element DNA microarray; the six ssDNA elements were created by spotting solutions containing mixtures of two amine-terminated 30mer oligonucleotides A and B (sequences for A and B are listed in the Experimental section) with an A:B percentage of 100:0, 80:20, 60:40, 40:60, 20:80 and 0:100. Sequence A and B were checked using mfold RNA/DNA folding calculations (developed by M. Zuker)29 to avoid any hairpin formation. It is reasonable to assume that the two amine-terminated ssDNA sequences have equivalent surface reactivity, so that the A:B percentage of the surface bound ssDNA should be the same as in solution. Figure 4a shows the arrangement of the ssDNA array elements used in the SPRI experiments, and figures 4b and 4c show the SPR images obtained after exposing the array to a 1 μM solution of either the 30mer complement of A (denoted Ac) or the 30mer complement of B (denoted Bc) respectively. The sequences for Ac and Bc are listed in the Experimental section. Previous measurements have shown that the surface coverage of adsorbed complementary ssDNA is directly proportional to the SPR reflectivity increase (Δ%R) when Δ%R is less than 10%.30 In addition, the Langmuir adsorption coefficient for DNA hybridization adsorption has a previously measured value of 1.8 × 10⁷ M-1,30 so that at a bulk target ssDNA concentration of 1 μM, there should be a full monolayer of dsDNA on the surface. Quantitative results of Δ%R as a function of %A and %B obtained from those two images are plotted, as shown in Figure 5. There are three important points that can be ascertained from the data in this Figure:
Figure 4.

SPRI measurements of DNA hybridization adsorption onto an ssDNA microarray containing mixtures of two 30mer sequences (A and B). (a) the arrangement of the six ssDNA microarray elements for the SPRI experiments. Each element contained the sequences A and B in a different percentage ratio denoted as %A: %B. (b) SPR difference image obtained after the hybridization adsorption of the ssDNA complement Ac onto the microarray from a 1μM solution. (c) SPR difference image obtained after the hybridization adsorption of the ssDNA complement Bc onto the microarray from a 1μM solution.
Figure 5.
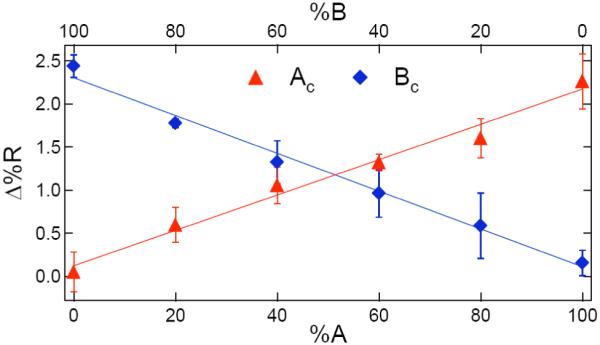
Quantitative plot of SPR reflectivity difference (Δ%R) vs. A:B percentage (%A or %B) for the DNA hybridization adsorption measurements. The Δ%R values are obtained from the SPRI difference images in Figure 4: triangles are from the Ac adsorption experiment (Figure 4b), and diamonds are from the Bc adsorption experiment (Figure 4c). The error bars represent the standard deviations obtained from three separate experiments.
First, the SPRI reflectivity changes for both the 100% A monolayer exposed to Ac and the 100% B monolayer exposed to Bc was Δ%R = 2.4(± 0.3)%. Using SPRI measurements of Δ%R obtained in previous DNA hybridization adsorption experiments, we can estimate a total adsorbed complementary ssDNA surface density of roughly 4 × 10¹² molecules/cm2.31 This estimate of surface density is the same value that we obtained from the PM-FTIR measurements for the surface density of the ssDNA attached to the pGlu monolayer. These results suggest that the surface hybridization efficiency of this surface is very high, approaching 100%. As mentioned above, a high surface hybridization efficiency is reasonable given that these hybridization adsorption measurements were performed at a complementary ssDNA concentration of 1.0 μM, which corresponds to a full monolayer given a Langmuir adsorption coefficient of 1.8 × 10⁷ M-1.5
A second point is that the SPRI signal for both the 100% A monolayer exposed to Bc and the 100% B monolayer exposed to Ac is Δ%R = 0.0 (± 0.3) %. This demonstrates that there is no nonspecific adsorption of non-complementary oligonucleotides onto the ssDNA monolayer; only binding to the complementary sequence is observed. This sequence specificity of DNA adsorption is the primary evidence that the adsorption process includes DNA hybridization.
Thirdly, the two lines in Figure 5 from 0% A to 100%A and 0%B to 100%B are straight and intersect at approximately 50%. This demonstrates that (i) the amine attachment chemistry has the same reaction efficiency for the two sequences, and (ii) the amount of hybridization adsorption is the same for the two sequences. Moreover, since the amount of hybridization is linear with the fraction of the surface that is ssDNA, there are no crowding or electrostatic effects (which would lead to nonlinear Frumkin-like terms in the adsorption isotherm) that would limit the amount of DNA adsorption onto these monolayers. The absence of electrostatic limitations on DNA hybridization adsorption also implies a very high DNA surface hybridization efficiency on the surface; a more precise demonstration of this will be seen in the subsequent SSB binding measurements.
In these SPRI experiments, the smallest amount of dsDNA formed from hybridization adsorption that can be detected on the surface is a relative surface coverage (θ) of 5%. This corresponds to a limit of detection for target DNA concentration in solution (CLOD) of 2.5 nM as determined from the following equation, CLOD = θ/KAds = 0.05/(1.8 × 107). This CLOD is similar to the value determined in a previous paper using maleimide-attached ssDNA monolayers.30 All of these findings indicate that the pGlu attachment chemistry affords ample space and flexibility for the DNA strands on the surface to interact with molecules in solution, and not interact with each other.
C. SPR Imaging Measurements of SSB Adsorption onto DNA Microarrays
Having confirmed that the pGlu ssDNA attachment chemistry can be used to create ssDNA monolayers that are well-behaved with respect to the hybridization adsorption of DNA, the next question is: can these surfaces be used to study protein-DNA interactions? To answer this question, a series of SPRI experiments were performed to study the adsorption of SSB to the mixed sequence DNA monolayers. SSB is a 75 kDa tetrameric protein that binds to ssDNA sequences, but not dsDNA.32
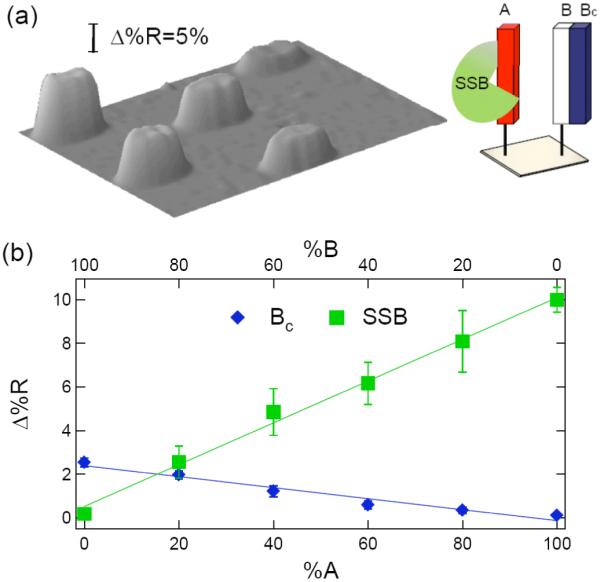
To demonstrate the preferential affinity of SSB to ssDNA and not dsDNA, SPRI measurements were performed onto the DNA microarrays that we created in Section B. The microarrays were sequentially exposed to complementary ssDNA and then SSB. Figure 6a is the SPR image of an array that was first exposed to the complement Ac, and then to a 10 nM solution SSB. Figure 6b plots the quantitative results obtained from the SPRI measurements. Figures 7a and 7b are the similar SPR image and data for an array that was first exposed to the complement Bc, and then SSB. The SPRI signal due to SSB adsorption is approximately five times larger (Δ%R ≈ 10%) than the SPR signal observed from complementary DNA hybridization adsorption (Δ%R ≈ 2%). This large signal is primarily due to the larger molecular weight (∼75 kDa) of the SSB as comparing to Ac or Bc (∼10 kDa).
Figure 6.
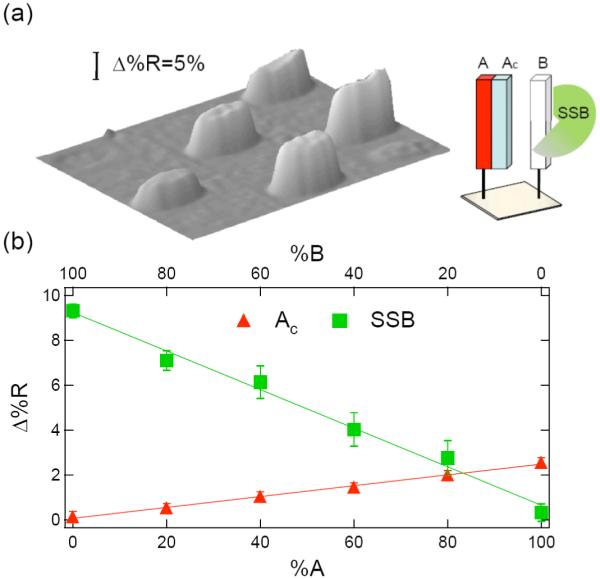
SPRI measurements of single-stranded binding protein (SSB) adsorption onto a partially hybridized ssDNA microarray containing mixtures of dsDNA (A-Ac) and ssDNA (B). The %A:%B ratios are the same as in Figure 4a. The microarray is first exposed to a 1 μM solution of the complement Ac, and then to a 10 nM solution of SSB. (a) SPR difference image of the microarray after SSB adsorption. (b) Quantitative plot of Δ%R vs. A:B percentage for the initial hybridization adsorption of Ac (triangles), and the subsequent adsorption of SSB (squares).
Figure 7.
SPRI measurements of single-stranded binding protein (SSB) adsorption onto a partially hybridized ssDNA microarray containing mixtures of dsDNA (B-Bc) and ssDNA (A). The %A:%B ratios are the same as in Figure 4a. The microarray is first exposed to a 1 μM solution of the complement Bc, and then to a 10 nM solution of SSB. (a) SPR difference image of the microarray after SSB adsorption. (b) Quantitative plot of Δ%R vs. A:B percentage for the initial hybridization adsorption of Bc (diamonds), and the subsequent adsorption of SSB (squares).
As the percentage of ssDNA on the surface is reduced due to hybridization adsorption, the SPR signal due to SSB adsorption also decreases. From the linear plots in Figures 6b and 7b, it is clear that the SSB binds specifically with ssDNA (and not dsDNA). This observation is in agreement with the finding from other SSB studies.33 In addition, the SPRI measurements show that SSB binding is completely blocked by full dsDNA monolayers of either A-Ac or B-Bc. The inability of SSB to bind to the dsDNA monolayers demonstrates that the surface hybridization efficiency of complementary DNA in solution to the ssDNA monolayers created by the pGlu attachment chemistry is essentially 100%.
D. SPR Imaging Measurements of Langmuir Isotherm of SSB Binding to ssDNA
As a final measurement of SSB binding to the ssDNA monolayers, the adsorption of SSB was quantified using a series of equilibrium SPRI measurements at different SSB concentrations to obtain the adsorption isotherm. The Δ%R obtained for adsorption to a 100% sequence A monolayer at various SSB concentrations is plotted in Figure 8. This data can be fit with a Langmuir isotherm34 (the solid line in the figure) to obtain a Langmuir adsorption coefficient, KAds of 5.5 (±0.4) × 109 M-1, which is similar to the value of 1.7 × 10¹⁰ M-1 measured by Kozlov et al.35 This large value of KAds confirms that in the mixed monolayer SSB binding experiments shown in Figures 6 and 7, all of the available ssDNA binding sites were occupied since the SSB solution concentration was 10 nM.
Figure 8.
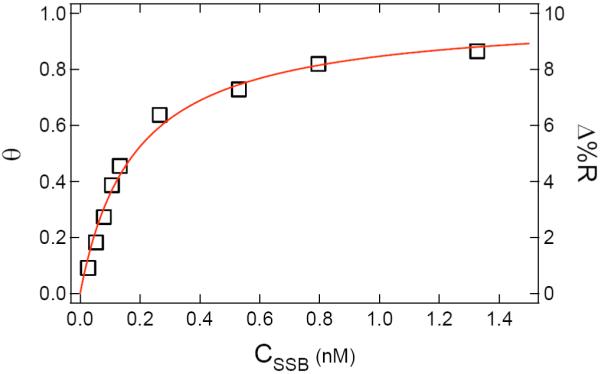
SPRI differential reflectivity measurements (Δ%R) of SSB binding to a ssDNA monolayer (sequence A) as a function of SSB concentration (CSSB). Δ%R values (squares) for concentrations ranging from 0.02 nM to 1.5 nM were measured after achieving equilibrium. The Δ%R data was fit to a Langmuir adsorption isotherm (solid line) of relative surface coverage (θ) vs. CSSB. It was assumed that Δ%R was proportional to θ. A Langmuir adsorption coefficient (KAds) of 5.5 (±0.4) × 109 M-1 was obtained from the fit.
IV. Conclusions
The combination of PM-FTIR spectroscopy, SPR angle shift measurements and SPR imaging measurements provides a powerful method for quantitating the chemical structure and bioavailability of ssDNA monolayers. Using these spectroscopic methods, we have demonstrated that the novel pGlu DNA surface attachment chemistry described and characterized in this paper leads to the fabrication of robust ssDNA microarrays that have very high surface hybridization efficiency, very little nonspecific adsorption, and can be used in complex, multi-step biosensing assays. One condition that these monolayers cannot survive is very high temperatures due to the cleavage of the MUAM gold-thiol bond. This problem can be alleviated by using this pGlu attachment chemistry on silicate or carbon modified gold surfaces.14,15 As observed in the SPRI measurements of SSB binding to the microarrays, these surfaces can also be used to quantitatively study the adsorption of proteins onto ssDNA and dsDNA monolayers. Future efforts will be directed towards the demonstration of surface enzyme reactions on these monolayers. This pGlu attachment chemistry may also be used to attach other amine-containing biomolecules (e.g., proteins, peptides) to gold films for biosensing applications.
Table I.
PM-FTIR Assignments for the MUAM-PGlu Monolayer
Acknowledgments
This research was supported by the National Institute of Health (2RO1 GM059622-04 and 1R21 RR018475-01A2), the National Science Foundation (CHE-0551935), and the DARPA Micro/Nano Fluidics Fundamentals Focus MF3 Center at UCI. RMC has a financial interest in GWC technologies.
References
- (1).Kimmel A, Oliver B. Methods in Enzymology: DNA Microarrays Part A: Array Platforms and Wet-Bench Protocols. Vol. 410. Academic Press; New York: 2006. [Google Scholar]
- (2).Schena M, Shalon D, Davis RW, Brown PO. Science. 1995;270:467–470. doi: 10.1126/science.270.5235.467. [DOI] [PubMed] [Google Scholar]
- (3).Fan JB, Chen XQ, Halushka MK, Berno A, Huang XH, Ryder T, Lipshutz RJ, Lockhart DJ, Chakravarti A. Genome Res. 2000;10:853–860. doi: 10.1101/gr.10.6.853. [DOI] [PMC free article] [PubMed] [Google Scholar]
- (4).Wark AW, Lee HJ, Corn RM. Angew. Chem. Int. Ed. 2008;47:644–652. doi: 10.1002/anie.200702450. [DOI] [PMC free article] [PubMed] [Google Scholar]
- (5).Nelson BP, Grimsrud TE, Liles MR, Goodman RM, Corn RM. Anal. Chem. 2001;73:1–7. doi: 10.1021/ac0010431. [DOI] [PubMed] [Google Scholar]
- (6).Smith EA, Corn RM. Appl. Spectrosc. 2003;57:320A–332A. doi: 10.1366/000370203322554446. [DOI] [PubMed] [Google Scholar]
- (7).Smith EA, Erickson MG, Ulijasz AT, Weisblum B, Corn RM. Langmuir. 2003;19:1486–1492. [Google Scholar]
- (8).Lee HJ, Wark AW, Corn RM. Langmuir. 2006;22:5241–5250. doi: 10.1021/la060223o. [DOI] [PMC free article] [PubMed] [Google Scholar]
- (9).Goodrich TT, Lee HJ, Corn RM. J. Am. Chem. Soc. 2004;126:4086–4087. doi: 10.1021/ja039823p. [DOI] [PubMed] [Google Scholar]
- (10).Herne TM, Tarlov MJ. J. Am. Chem. Soc. 1997;119:8916–8920. [Google Scholar]
- (11).Peterlinz KA, Georgiadis RM, Herne TM, Tarlov MJ. J. Am. Chem. Soc. 1997;119:3401–3402. [Google Scholar]
- (12).Zizlsperger M, Knoll W. Prog. Colloid Polym. Sci. 1998;109:244–253. [Google Scholar]
- (13).Shumaker-Parry JS, Zareie MH, Aebersold R, Campbell CT. Anal. Chem. 2004;76:918–929. doi: 10.1021/ac034964v. [DOI] [PubMed] [Google Scholar]
- (14).Phillips KS, Han JH, Martinez M, Wang ZZ, Carter D, Cheng Q. Anal. Chem. 2006;78:596–603. doi: 10.1021/ac051644y. [DOI] [PubMed] [Google Scholar]
- (15).Strother T, Knickerbocker T, Russell JN, Butler JE, Smith LM, Hamers RJ. Langmuir. 2002;18:968–971. [Google Scholar]
- (16).Smith E, Wanat MJ, Cheng Y, Barreira SVP, Frutos AG, Corn RM. Langmuir. 2001;17:2502–2507. [Google Scholar]
- (17).Brockman JM, Frutos AG, Corn RM. J. Am. Chem. Soc. 1999;121:8044–8051. [Google Scholar]
- (18).Frutos AG, Weibel SC, Corn RM. Anal. Chem. 1999;71:3935–3940. [Google Scholar]
- (19).Frey BL, Corn RM, Weibel SC. Handbook of Vibrational Spectroscopy. Vol. 2. John Wiley & Sons; Chichester: 2001. [Google Scholar]
- (20).Goodrich TT, Wark AW, Corn RM, Lee HJ. Methods in Molecular Biology. Vol. 328. Humana Press; New York: 2006. [DOI] [PubMed] [Google Scholar]
- (21).Bell SA, McLean ME, Oh SK, Tichy SE, Zhang W, Corn RM, Crooks RM, Simanek EE. Bioconjugate Chem. 2003;14:488–493. doi: 10.1021/bc020075n. [DOI] [PubMed] [Google Scholar]
- (22).Cheng YF, Corn RM. J. Phys. Chem. B. 1999;103:8726–8731. [Google Scholar]
- (23).Jordan CE, Frutos AG, Thiel AJ, Corn RM. Anal. Chem. 1997;69:4939–4947. doi: 10.1021/ac961012z. [DOI] [PubMed] [Google Scholar]
- (24).Lee HJ, Li Y, Wark AW, Corn RM. Anal. Chem. 2005;77:5096–5100. doi: 10.1021/ac050815w. [DOI] [PubMed] [Google Scholar]
- (25).Frey BL, Jordan CE, Kornguth S, Corn RM. Anal. Chem. 1995;67:4452–4457. [Google Scholar]
- (26).Hansen WN. J. Opt. Soc. Am. 1968;58:380–388. [Google Scholar]
- (27).Jordan CE, Frey BL, Kornguth S, Corn RM. Langmuir. 1994;10:3642–3648. [Google Scholar]
- (28).Frutos AG, Weibel SC, Corn RM. Anal. Chem. 1999;71:3935–3940. [Google Scholar]
- (29).Zuker M. Nucleic Acids Res. 2003;31:3406–3415. doi: 10.1093/nar/gkg595. [DOI] [PMC free article] [PubMed] [Google Scholar]
- (30).Nelson BP, Grimsrud TE, Liles MR, Goodman RM, Corn RM. Anal. Chem. 2001;73:1–7. doi: 10.1021/ac0010431. [DOI] [PubMed] [Google Scholar]
- (31).Li Y, Lee HJ, Corn RM. Nucleic Acids Res. 2006;34:6416–6424. doi: 10.1093/nar/gkl738. [DOI] [PMC free article] [PubMed] [Google Scholar]
- (32).Meyer RR, Laine PS. Microbiol. Rev. 1990;54:342–380. doi: 10.1128/mr.54.4.342-380.1990. [DOI] [PMC free article] [PubMed] [Google Scholar]
- (33).Revzin A. The Biology of Nonspecific DNA-protein Interaction. CRC Press; Boca Raton: 1990. [Google Scholar]
- (34).Adamson AW, Gast AP. Physical Chemistry of Surfaces. 6th Edition Wiley-Interscience; New York: 1997. [Google Scholar]
- (35).Kozlov AG, Lohman TM. Biochemistry. 2002;41:6032–6044. doi: 10.1021/bi020122z. [DOI] [PubMed] [Google Scholar]
- (36).Georgiadis RM, Peterlinz KP, Peterson AW. J. Am. Chem. Soc. 2000;122:3166–3173. [Google Scholar]