

Abstract
Group A Streptococcus is characterized by the ability to cause a diverse number of human infections including pharyngitis, necrotizing fasciitis, toxic shock syndrome, and acute rheumatic fever, yet the regulation of streptococcal genes involved in disease processes and survival in the host is not completely understood. Genome scale analysis has revealed a complex regulatory network including 13 two-component regulatory systems and more than 100 additional putative regulators, the majority of which remain uncharacterized. Among these is the streptococcal regulator of virulence, Srv, the first Group A Streptococcus member of the Crp/Fnr family of transcriptional regulators. Previous work demonstrated that the loss of srv resulted in a significant decrease in Group A Streptococcus virulence. To begin to define the gene products influenced by Srv, we combined microarray and two-dimensional gel electrophoresis analysis. Loss of srv results in a chromosome wide reduction of gene transcription and changes in the production of the extracellular virulence factors Sic (streptococcal inhibitor of complement) and SpeB (cysteine proteinase). Sic levels are reduced in the srv mutant, whereas the extracellular concentration and activity of SpeB is increased. These data link Srv to the increasingly complex GAS regulatory network.
Keywords: group A Streptococcus; virulence gene regulation; streptococcal regulator of virulence, Srv; Streptococcus pyogenes
Introduction
Group A Streptococcus (GAS) is perhaps best recognized as a leading cause of pediatric pharyngitis when, in fact, the organism may cause a greater number of human diseases than any other bacterial pathogen (Ferretti et al., 2001). In addition to pharyngitis, these infections can range from those associated with the skin (impetigo, erysipelas), to severe infections such as necrotizing fasciitis and streptococcal toxic shock syndrome. This diverse epidemiology speaks to the ability of GAS to colonize numerous physiologically distinct host tissue sites. Both population genetic and genomic studies have attempted to identify specific genetic markers that would define segments of the GAS population as those responsible for mild infections of the skin vs. those frequently involved in invasive episodes (Bessen et al., 1989, 1996, 1999, 2000; Ferretti et al., 2001; Beres et al., 2002; Smoot et al., 2002; Nakagawa et al., 2003; Banks et al., 2004; McGregor et al., 2004). However, no simplistic association with a given clinical syndrome has been made, and genomic studies have failed to identify specific virulence factors that explain certain GAS strain/disease associations (Ferretti et al., 2001; Beres et al., 2002; Smoot et al., 2002; Nakagawa et al., 2003; Banks et al., 2004; McGregor et al., 2004). Genome sequencing has revealed an intricate gene regulatory network including 13 putative two-component systems and up to 100 other regulatory proteins (Graham et al., 2002). This observation leads to the hypothesis that strain-to-strain differences in gene regulation may be responsible for the frequency with which certain strains or serotypes are associated with disease. Of course, before such a hypothesis can be addressed, a systematic study of the regulatory elements of GAS must be undertaken.
Recently, we identified the first Crp/Fnr-like regulator of GAS named the streptococcal regulator of virulence (Srv) based upon work that indicated Srv was required for GAS virulence in a mouse model of infection (Reid et al., 2004). srv (spy1857) was originally identified in a sequence analysis of completed GAS genomes (Reid et al., 2001a, b). The gene is most similar to prfA, the primary regulator of virulence in Listeria monocytogenes (Reid et al., 2004). An analysis of 37 genetically diverse GAS strains indicated that srv encoded only two protein variants differing by a single amino acid, a result that suggests strong selective pressure to maintain Srv function (Reid et al., 2001a, b). Crp/Fnr-like regulators are site-specific DNA-binding proteins characterized by an N-terminal allosteric domain and a C-terminal helix-turn-helix domain required for interaction with DNA. Sequence analysis indicates srv encodes an N-terminal region consisting of short β-sheets separated by conserved glycine residues (β-roll structures), and a C-terminal helix-turn-helix domain (Reid et al., 2004).
Numerous bacterial regulators have been identified through studies designed to determine the underlying cause of a specific phenotype. For instance, prfA was identified through the study of a 450 bp deletion in a nonhemolytic strain of L. monocytogenes (Leimeister-Wachter et al., 1990). This deletion was located 1.6 kb upstream of the listeriolysin gene and found to interrupt a coding region (prfA) required for listeriolysin expression (Leimeister-Wachter et al., 1990). Similarly, mga, a virulence regulator of GAS, was identified through the study of strains which failed to produce M protein (Spanier et al., 1984; Caparon & Scott, 1987; Robbins et al., 1987; Simpson & Cleary, 1987). However, srv was identified through genome scanning. Allelic replacement of srv resulted in an attenuated mutant strain in an intraperitoneal model of GAS infection, but it was unclear which Srv-dependent genes were responsible for the significant reduction in virulence (Reid et al., 2004). To address this issue, we conducted a microarray analysis comparing global gene transcript levels in a serotype M1 strain (MGAS5005) and an isogenic mutant derivative lacking srv (MGAS5005Δsrv). In cultures harvested during the exponential phase of growth (A600 nm = 0.4), 308 genes were downregulated in the srv mutant strain whereas four genes were upregulated. Among the downregulated genes were several which encode proven/putative extracellular proteins. To analyze the role of Srv in the regulation of GAS extracellular proteins, a two-dimensional gel electrophoresis study was completed. Taken together, the analyses suggest that Srv is a regulator of GAS gene transcription and impacts the GAS extracellular protein profile, results which may account for the reduction in virulence of the srv mutant strain.
Materials and methods
Bacterial strains and growth conditions
Serotype M1 strain MGAS5005 and the MGAS5005Δsrv derivative have been described (Reid et al., 2004). Of particular note, population genetic analysis and epidemiological studies have indicated that serotype M1T1 strains are among the most common causes of invasive GAS infections worldwide. MGAS5005 was isolated from a case of invasive GAS disease and has been extensively characterized in numerous investigations of GAS pathogenesis (Musser & Krause, 1998; Reid et al., 2001a, b).
For RNA isolation, GAS was cultured in Todd–Hewitt broth supplemented with yeast extract (THY) (Difco Laboratories, Detroit, MI) overnight at 37 °C, 5% CO2. A 100-μL aliquot of the starter culture was added to each of three 50-mL aliquots of THY medium, incubated at 37 °C, 5% CO2, and harvested at three time points (A600 nm = 0.2, 0.4, 0.6) throughout the growth cycle. Cells were harvested by centrifugation and frozen at −80 °C prior to RNA isolation.
For protein isolation, MGAS5005 and MGAS5005Δsrv were grown with 40 mL THY broth for c. 18 h at 37 °C, 5% CO2. The cultures were centrifuged for 15 min at 13 679 g at 4 °C to pellet the bacteria. The culture supernatant fluids were transferred to a sterile centrifuge tube and ice-cold trichloroacetic acid and acetone were added to final concentrations of 10% and 5% (v/v), respectively. The samples were mixed and incubated for 1 h at −20 °C prior to centrifugation for 20 min at 1500 g and 4 °C. The pellets were washed twice with ice-cold ethanol and resuspended with solubilization solution containing 8 M urea, 2 μ thiourea, 4% CHAPS, and 75 μM dithiothreitol (DTT). Proteins were quantitated with a PlusOne 2-D Quant kit (Amersham Biosciences, Piscataway, NJ), as described by the manufacturer.
Microarray analysis
The microarray consisted of 2215 PCR products ranging from 100 to 500 bp amplified from MGAS5005 ORFs based on strain SF370 (Ferretti et al., 2001), and unique M18 (MGAS8232) and M3 (MGAS315) ORFs (Beres et al., 2002; Smoot et al., 2002). PCR products derived from each GAS ORF were printed onto glass slides (CMT-GAPS, Corning) using a VersaArray Chipwriter Pro (Bio-Rad Laboratories, Hercules, CA) in ≥quadruplicate. First-strand cDNA synthesis (incorporation of biotin and fluorescein probes) and tyramide signal amplification (TSA™) was performed using Micromax™ TSA™ Labeling and Detection Kit (Perkin Elmer Life Sciences, Boston, MA). Hybridization was conducted overnight in a 45 °C water bath. Lifterslips (Erie Scientific, Portsmouth, NH) were removed by immersion in a solution of 0.5 × sodium sodium citrate (SSC) and 0.1% sodium dodecyl sulfate (SDS) at 45 °C, washed once in the same solution, followed by additional washes in 0.06% × SSC/0.01% SDS, and 0.06 × SSC followed by amplification of label using TSA™ detection. Slides were scanned with a ScanArray 5000 instrument (Perkin Elmer Life Sciences) and fluorochromes were normalized to equal fluorescence intensity using serial dilutions of genomic DNA standards by adjusting laser power and/or photomultiplier gain. Spot location and statistics were calculated and exported from QuantArray (Perkin Elmer Life Sciences), then imported into GeneSpring version 6 (Silicon Genetics, Redwood City, CA). Mean values from replicates were calculated and all genes identified as differentially expressed passed a custom filter based on spot intensity, signal to noise ratio, and area (Voyich et al., 2003). The experiments were performed in triplicate with each slide containing four to 12 spots per gene (n≥12 spots).
TaqMan real-time reverse transcriptase-PCR
Total RNA used in the microarray analysis was also used for verification of the array by real-time reverse transcriptase-PCR. TaqMan assays were performed with an ABI 7700 instrument (Applied Biosystems, Forest City, CA) and the TaqMan One-Step RT-PCR master mix reagents kit (Applied Biosystems) as previously described (Reid et al., 2001a, b, 2004). The amplification profile used was as follows: 1 cycle at 48 °C for 30 min, 1 cycle at 95 °C for 10 min, and 40 cycles at 95 °C for 15 s and 60 °C for 1 min. The critical threshold cycle (Ct) is defined as the cycle at which fluorescence becomes detectable above background and is inversely proportional to the logarithm of the initial concentration of template. A standard curve was plotted for each reaction with Ct values obtained from amplification of known quantities of genomic DNA isolated from strain MGAS5005. The standard curves were used to transform Ct values of the experimental samples into the relative number of DNA molecules. The quantity of cDNA for each experimental gene was normalized to the quantity of the constitutively transcribed control gene (gyrA) in each sample. The fold change in transcript levels was determined by taking the ratio of the level of cDNA in MGAS5005Δsrv to the level of cDNA in MGAS5005.
Two-dimensional electrophoresis
Isoelectric focusing was done with an IPGphor isoelectric focusing system using immobiline dry strips (11 cm) with a linear pH range of 3–10, as described by the manufacturer (Amersham Biosciences). IPG strips were hydrated with 90 μg of protein in 200 μL of sample buffer for 12 h at 20 °C. Isoelectric focusing was done with 500 V for 500 Vh, 1000 V for 1000 Vh, and 8000 V for 24 000 Vh at 20 °C. The strips were incubated in SDS equilibration buffer (50 mM Tris-Cl [pH 8.8], 6μ urea, 30% (v/v) glycerol, 2% SDS, and Bromophenol blue) for 10 min. SDS-polyacrylamide gel electrophoresis (SDS-PAGE) separation was done with a Criterion Dodeca electrophoresis apparatus (Bio-Rad Laboratories) and 12.5% Criterion precast acrylamide resolving gels (Bio-Rad Laboratories). The running buffer consisted of 0.25μ Tris, 1.92 μ glycine, and 1% (w/v) SDS and electrophoresis was done for c. 2 h at 100 V. Proteins were stained with Sypro Ruby (Bio-Rad Laboratories), and digital images were acquired with a Typhoon imager (Amersham Biosciences). Analysis of the gels, including protein spot detection and quantitation, was done with Pdquest software (Bio-Rad Laboratories). Protein spots were quantitated by summing the values of pixels of each protein spot. Gels were normalized based on the sum of all protein spots detected in each sample. The experiment was repeated on three separate occasions.
Protein identification
Proteins of interest were excised from the SDS-PAGE gels, digested with trypsin, and identified, as previously described (Chaussee et al., 2004). Briefly, tryptic peptides were separated with a C18 reverse-phase column (13 × 25 μm; LC Packings, Sunnyvale, CA) using a capillary liquid chromatography system (Waters, Milford, MA) and eluted directly into a Micromass electrospray ionization quadrupole/orthogonal time-of-flight mass (Q-ToF Micro) hybrid spectrometer (Waters) with a 3–40% gradient of ACN-0.1% formic acid over 40 min and a flow rate of c. 20 nL min−1. Spectra were obtained in positive ion mode, deconvoluted, and analyzed with MassLynx 4.0 software (Micromass). Protein Lynx Global Server v. 2.1 (Waters) was used to search the NCBI nonredundant genomic databases. Proteins were identified by matching mass spectrometry (MS)/MS spectra from at least two tryptic peptides or by de novo peptide sequence determination when only one MS/MS match was identified.
Casein agar plate assay
The proteolytic activity of SpeB was determined as described by Hynes & Tagg (1985). Briefly, MGAS5005 and MGAS5005Δsrv were stab inoculated into Todd–Hewitt agar plates containing 10% skim milk (Difco Laboratories), and incubated anaerobically at 37 °C for c. 18 h in an anaerobic GasPak (Becton Dickinson) (Hynes & Tagg, 1985). A zone of translucence around the stab site indicated the presence of caseinolytic activity.
Western immunoblot analysis of SpeB in culture supernatant fluids
MGAS5005 and MGAS5005Δsrv were grown in 40 mL of THY broth at 37 °C with 5% CO2. Culture supernatant proteins were precipitated and prepared as described above for 2-DE. A 20-μg aliquot of protein was separated with SDS-PAGE and the proteins transferred to nitrocellulose membranes (Millipore Corp., Bedford, MA) with Towbin's buffer. Rabbit antisera to SpeB was used at a 1 : 2000 dilution. The antisera was raised against the zymogen form of SpeB and reacts with both the active and zymogen forms. Antibody–antigen complexes were detected with Super-Signal West Pico chemiluminescent substrate (Pierce, Rockford, IL) and images acquired with a Typhoon imager (Amersham Biosciences).
Results
Inactivation of srv alters the GAS transcription profile
As a first step in defining the spectrum of genes that may be influenced by Srv, we conducted a microarray analysis of GAS gene transcript levels in MGAS5005 and MGAS5005Δsrv. In previous work, we demonstrated that the maximal level of srv gene transcript was detected at two distinct times, early- and late-exponential phase (A600 nm = 0.1 and A600 nm = 0.6, respectively) (Reid et al., 2004). Therefore, we chose to harvest GAS at A600 nm = 0.2, 0.4, and 0.6, time points, which coincide with among the highest (A600 nm = 0.6) and lowest (A600 nm = 0.2 & 0.4) measured levels of srv transcript (the quantities of RNA that could be isolated from a culture harvested at A600 nm = 0.1 were insufficient to permit microarray analysis). To control for variation in individual RNA isolations, total RNA was isolated from triplicate cultures at each time point. Hybridizations were done in duplicate for each of the triplicate RNA samples at each time point. Spot signal intensities minus local background fluorescence were normalized to the global signal intensity per label before data analysis. Transcript expression ratios (or fold change) were calculated for the srv mutant strain relative to MGAS5005. The procedures used to conduct this study have been published previously in other reports of GAS microarray analysis (Smoot et al., 2001, 2002; Graham et al., 2002).
A recent report indicates that less than a 2-fold change in relative transcript abundance can be biologically significant (Hughes et al., 2000). In addition, a previous GAS micro-array analysis utilizing a 1.5-fold threshold revealed that growth temperature influenced the expression of genes involved in iron homeostasis (Smoot et al., 2001). Given that our study was designed to assess the regulatory potential of Srv, we elected to use a 1.5-fold threshold (Table S1). Chromosome wide, only 24 genes were differentially transcribed at A600 nm = 0.2 (18 downregulated, 6 upregulated). However, a dramatic change in the GAS transcriptome was observed at A600 nm = 0.4 with 18% of genes (308/1678) downregulated in the srv mutant; 54 of those genes were downregulated ≥2-fold. Furthermore, only four genes were upregulated in the mutant strain at A600 nm = 0.4 (Table 1). A similar trend was observed at A600 nm = 0.6: 13% of GAS genes were downregulated in the srv mutant (224/1678), 43 genes were downregulated ≥2-fold, and only a single ORF was upregulated.
Table 1.
Genes upregulated ≥1.5-fold in MGAS5005Δsrv
| SPy No. and time point when upregulation was observed (M1 or M18* genome) | Gene | Putative/proven function |
|---|---|---|
| SPy0067 (A600nm = 0.4) | rplR | 50S ribosomal protein L18 |
| SPy0130 (A600nm = 0.2) | NA | Hypothetical |
| SPy0166 (A600nm = 0.4) | NA | Hypothetical |
| SPy0724 (A600nm = 0.2) | rplS | 50S ribosomal protein L19 |
| SPy1150 (A600nm = 0.4) | nox | NADH oxidase |
| SPy1371 (A600nm = 0.2, 0.4) | gapN | Glyceraldehyde-3-phosphate dehydrogenase |
| SPy1531 (A600nm = 0.6) | dpr | Peroxide resistance protein |
| SPy1687 (A600nm = 0.2) | NA | Hypothetical |
| SPy1882 (A600nm = 0.2) | lppC | Putative acid phosphatase |
| SPy2114 (A600nm = 0.2) | NA | Hypothetical |
| SPyM18-0164 | NA | Hypothetical MGAS8232 protein |
| SPyM18-0261 | gapA | MGAS8232 Glyceraldehyde-3-phosphate dehydrogenase |
The array was supplemented with DNA from MGAS8232 (serotype M18) and MGAS315 (serotype M3) representing ORFs believed to be unique in each strain.
To gain further understanding of the nature of the changes that were taking place in MGAS5005Δsrv, genes which were downregulated in the mutant strain were classified according to the COG (clusters of orthologous groups) database (Table 2). This system predicts function based upon phylogenetic relationships and assigns the genes to broad categories of basic cellular processes (Tatusov et al., 2000). According to this analysis, the categories with the greatest percentage of genes downregulated were translation; posttranslational modification, protein turnover, and chaperones; energy production and conversion; amino acid transport and metabolism; lipid transport and metabolism; and secondary metabolites biosynthesis, transport and catabolism (Table 2). In addition, 18 putative or proven virulence factors (Table 3) were found to be downregulated at various time points in MGAS5005Δsrv.
Table 2.
Number of genes downregulated ≥1.5-fold in the srv mutant strain compared to wild-type MGAS5005
| Code | Description* (no. of genes in each category) | Downregulated at A600nm = 0.2 (%†) | Downregulated at A600 nm = 0.4 (%†) | Downregulated at A600 nm = 0.6 (%†) |
|---|---|---|---|---|
| J | Translation (152) | 40 (26.3) | 34 (22.4) | |
| K | Transcription (133) | 1 (0.8) | 13 (9.8) | 6 (4.5) |
| L | Replication, recombination and repair (128) | 16 (12.5) | 13 (10.2) | |
| D | Cell cycle control, mitosis and meiosis (32) | 1 (3.1) | 2 (6.3) | 1 (3.1) |
| O | Posttranslational modification, protein turnover, chaperones (56) | 15 (26.8) | 8 (14.3) | |
| M | Cell wall/membrane biogenesis (76) | 1 (1.3) | 8 (10.5) | 9 (11.8) |
| N | Cell motility (22) | 1 (4.5) | 3 (13.6) | |
| P | Inorganic ion transport and metabolism (78) | 10 (12.8) | 8 (10.3) | |
| T | Signal transduction mechanisms (70) | 6 (8.6) | 3 (4.3) | |
| C | Energy production and conversion (62) | 12 (19.4) | 7 (11.3) | |
| G | Carbohydrate transport and metabolism (140) | 12 (8.6) | 14 (10.0) | |
| E | Amino acid transport and metabolism (117) | 5 (4.3) | 27 (23.1) | 22 (18.8) |
| F | Nucleotide transport and metabolism (65) | 9 (13.8) | 8 (12.3) | |
| H | Coenzyme transport and metabolism (45) | 4 (8.9) | 4 (8.9) | |
| I | Lipid transport and metabolism (50) | 4 (8.0) | 9 (18.0) | 4 (8.0) |
| Q | Secondary metabolites biosynthesis, transport and catabolism (18) | 1 (5.6) | 7 (38.9) | 5 (27.8) |
| R | General function prediction only (185) | 21 (11.4) | 16 (8.6) |
Function predicted by the orthologous relationships (COGs) determined for the SF370 serotype M1 GAS genome. Genes that lack a COG assignment or are of unknown function are not included.
Number of genes downregulated ≥1.5-fold in the srv mutant strain compared to wild-type MGAS5005. Percent determined as number of downregulated genes vs. total number of genes for each category.
Table 3.
Virulence factor genes downregulated ≥1.5-fold in MGAS5005Δsrv
| SPy No. (M1 genome)* | Fold change (MGAS5005Δsrv : MGAS5005) | A600nm | Gene | Putative/proven function |
|---|---|---|---|---|
| SPy0167 | 0.50 | 0.6 | slo | Streptolysin O |
| SPy0212 | 0.61 | 0.4 | speG | Pyrogenic exotoxin G |
| SPy0216 | 0.66 | 0.4 | NA | RofA-related regulatory protein |
| SPy0334 | 0.60 | 0.6 | covR/csrR | Control of virulence regulator |
| SPy0337 | 0.51 | 0.4 | covS/csrS | Sensory transduction kinase |
| SPy0416 | 0.45 | 0.6 | prtS | Putative cell envelope proteinase |
| SPy0470 | 0.51/0.61 | 0.4/0.6 | NA | Myosin–cross-reactive antigen |
| SPy0714 | 0.63 | 0.4 | adcA | Putative adhesion protein |
| SPy1054 | 0.60 | 0.4 | scl2 | Collagen-like protein |
| SPy1159 | 0.54/0.62 | 0.4/0.6 | hylIII | Putative h aemolysin III |
| SPy1273 | 0.60 | 0.4 | cfa | cAMP factor |
| SPy1357 | 0.64 | 0.4 | grab | Protein GRAB |
| SPy1436 | 0.60 | 0.6 | mf3 | Mitogenic factor 3 |
| SPy1896 | 0.57 | 0.4 | ropA | RopA protein |
| SPy1979 | 0.57 | 0.4 | ska | Streptokinase |
| SPy2007 | 0.57 | 0.4 | lmb | Laminin adhesion |
| SPy2010 | 0.52 | 0.4 | scpA | Streptococcal C5A peptidase |
| SPy2016 | 0.49 | 0.6 | sic | Streptococcal inhibitor of complement |
| SPy2019 | 0.62/0.53 | 0.4/0.6 | mga | M protein transacting positive regulator |
| SPy2200 | 0.66/0.42 | 0.4/0.6 | hasA | Hyaluronate synthetase |
SPy numbers assigned based upon annotation of GAS strain SF370 (Ferretti et al. (2001)).
Verification of DNA microarray
Real-time reverse transcriptase-PCR analysis of five genes was used to confirm the microarray data. Total RNA was isolated from MGAS5005 and MGAS5005Δsrv at A600 nm = 0.4 and 0.6 to correspond with the time points generating the greatest differences in gene transcript observed in the array analysis. Two genes were analyzed at A600 nm = 0.4, and three separate genes were analyzed at A600 nm = 0.6. At A600 nm = 0.4, the ratio of transcript levels (MGAS5005Δsrv : MGAS5005) for SPy0338 was 0.504, and for SPy0714 was 0.611. The fold change in transcript for these two genes in the microarray analysis was 0.61 and 0.63, respectively. At A600 nm = 0.6, the ratio of transcript levels (MGAS5005Δsrv : MGAS5005) for SPy0044, SPy1869, and SPy2019 were 0.598, 0.578, and 0.344, respectively. In the microarray analysis, the fold change for these genes measured 0.64 (SPy0044), 0.70 (SPy1869), and 0.53 (SPy2019). Strong positive correlations between results obtained with the two techniques were observed (r = 0.88) (Fig. 1).
Fig. 1.

Correlation of DNA microarray and real-time reverse transcriptase-PCR analysis. The fold changes in transcript of MGAS5005Δsrv relative to MGAS5005 obtained by microarray and real-time reverse transcriptase-PCR were log-transformed and plotted against each other to measure the correlation. The transcription of five genes was compared. Two genes were analyzed from RNA isolated at A600 nm = 0.4, while three separate genes were analyzed from RNA isolated at A600 nm = 0.6.
Inactivation of srv alters the profile of GAS proteins released to the supernatant
To test the hypothesis that inactivation of srv may result in changes in the number of products secreted by GAS, a Signal P analysis (http://www.cbs.dtu.dk/services/SignalP/) was used to identify genes, which encode a putative Gram-positive signal secretion sequence. Genes encoding 51 proven or putative secreted proteins of GAS were differentially regulated in MGAS5005Δsrv according to the microarray. This observation led us to compare the exoprotein profiles of MGAS5005 and MGAS5005Δsrv. Supernatant proteins were isolated from stationary phase cultures of MGAS5005 and MGAS5005Δsrv. Stationary phase cultures were used because previous analyses of GAS culture supernatant fluids indicated that many soluble exoproteins are detected only in the stationary phase of growth (Chaussee et al., 2001). The proteins were separated by SDS-PAGE (data not shown) and two-dimensional gel electrophoresis (2-DE). Slices of representative gels are shown in Fig. 2. The production of the serum inhibitor of complement (Sic) and the streptococcal cysteine proteinase (SpeB) consistently differed between MGAS5005Δsrv and MGAS5005. Sic was less abundant among proteins isolated from MGAS5005Δsrv than among those isolated from MGAS5005 (Fig. 2). These data are consistent with our microarray analysis, which indicated a fold change in transcript of 0.49 for sic (SPy2016) in the mutant strain compared to the wild type. Sic is encoded primarily by M1 serotypes, inhibits human complement activation in vitro, and contributes to virulence in murine models of disease (Akesson et al., 1996; Stockbauer et al., 1998; Hoe et al., 2000, 2001, 2002; Lukomski et al., 2000). In addition, SpeB was more abundant in samples prepared from MGAS5005Δsrv cultures (Fig. 2). This result was unexpected in that there was no variation in the transcription of speB detected by either microarray or real-time reverse transcriptase-PCR (data not shown). The importance of SpeB in GAS pathogenesis was evidenced by the attenuation of the speB isogenic mutant (Lukomski et al., 1997). SpeB has been shown to degrade host matrix proteins (Kapur et al., 1993), and cleave antibacterial peptide LL-37 (Schmidtchen et al., 2002), and IgG antibody (Collin et al., 2002). Taken together, the data indicate that srv inactivation also is associated with changes in the abundance of virulence-associated exoproteins.
Fig. 2.

Two-dimensional gel electrophoresis separation of culture supernatant proteins from MGAS5005 (a, c) and the isogenic mutant lacking srv, MGAS5005Δsrv (b, d). Circled proteins are Sic (a, b) and the zymogen form of SpeB (c, d). There is a marked reduction in the amount of Sic present in the supernatant of MGAS5005Δsrv (b) and an increase in the amount of SpeB present (d) compared to the parental strain (c).
MGAS5005Δsrv has greater SpeB caseinolytic activity
The observed increase in the production of SpeB in MGAS5005Δsrv led us to investigate whether there was a correlated increase in SpeB activity. SpeB proteolytic activity was measured by stab inoculating the strain to be tested into Todd–Hewitt agar plates containing 10% skim milk (casein agar plate assay) (Hynes & Tagg, 1985; Chaussee et al., 1999). Greater caseinolytic activity, indicated by an increased zone of translucence surrounding the stab site, was observed in MGAS5005Δsrv compared to the parental strain (Fig. 3). Thus, the increase in SpeB production in MGAS5005Δsrv is accompanied by an increase in SpeB activity.
Fig. 3.
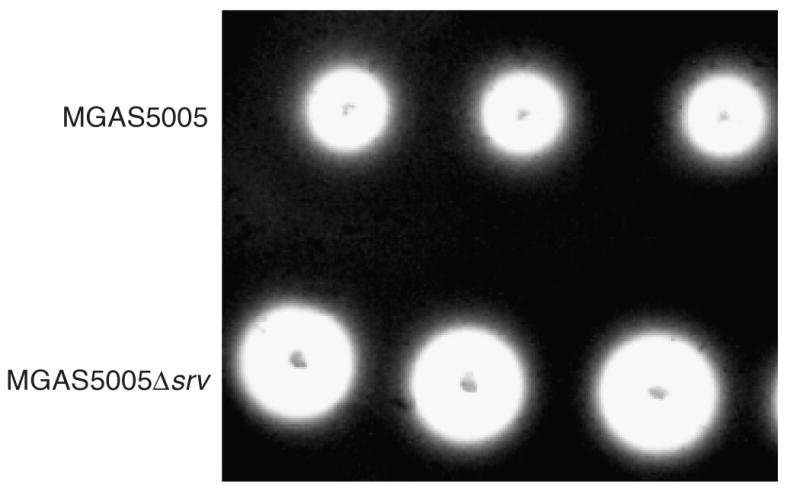
Casein agar assay for SpeB proteolytic activity. MGAS5005 (a) and MGAS5005Δsrv (b) were stab inoculated into agar plates containing skim milk and incubated for 18 h anaerobically. Proteinase activity is manifest as a zone of translucence surrounding the stab sites. There is a marked increase in the amount of SpeB proteolysis exhibited by MGAS5005Δsrv compared to MGAS5005.
Western immunoblot analysis indicates that SpeB is produced earlier in MGAS5005Δsrv than in the parental strain
The increase in caseinolytic activity is likely due to the increased concentration of SpeB present, but could indicate that SpeB is produced earlier in the MGAS5005Δsrv background. To test this hypothesis, we conducted a western immunoblot analysis of GAS supernatants collected after 2 and 8 h of growth. After 2 h, SpeB was detected in supernatants isolated from the mutant strain, but not in supernatants obtained from the growth of MGAS5005 (Fig. 4). After 8 h, there is an increased level of SpeB present in the supernatant from MGAS5005Δsrv compared to the wild-type strain (Fig. 4). This result suggests that Srv contributes to the temporal production of SpeB.
Fig. 4.
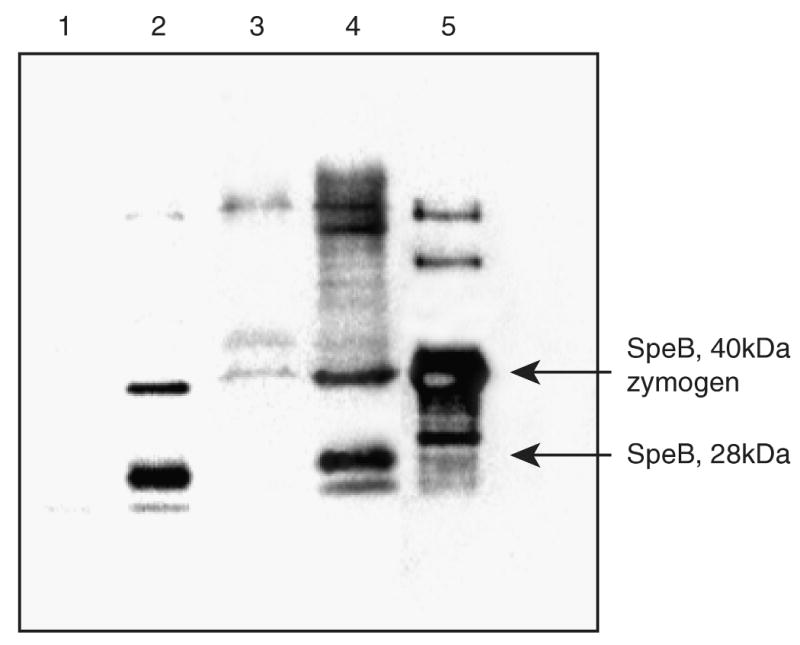
Immunoblot analysis of culture supernatant fluids isolated from MGAS5005 and MGAS5005Δsrv during the exponential phase of growth. Antisera to SpeB was used to analyze 20 μg of protein isolated from MGAS5005 (lanes 1, 3) and MGAS5005Δsrv (lanes 2, 4) after 2 (lanes 1, 2) and 8 h (lanes 3, 4) of growth. 1.5 μg of purified SpeB was used as a control (lane 5).
Discussion
Our analysis indicates that the absence of Srv results in a broad reduction in GAS gene transcript levels, with as much as 18% of genes downregulated in the mutant strain during the exponential phase of growth. Such large differences in expression in response to the inactivation of a single regulator are not unprecedented. Graham et al. (2002) reported that inactivation of covR (csrR) resulted in the differential expression of 15% of GAS genes (n = 271). In fact, 21 putative/proven transcriptional regulators were downregulated in MGAS5005Δsrv during the exponential phase of growth, including mga and covRS (csrRS). The multiple gene regulator Mga has been associated with an array of GAS disease processes such as colonization, invasion, and evasion of the host immune response (Simpson & Cleary, 1987; Lukomski et al., 2000; Smoot et al., 2001; Collin et al., 2002). Similarly, CovRS/CsrRS (control of virulence, capsule synthesis regulator) negatively regulates several factors that contribute to GAS pathogenesis such as SpeB, streptolysin S, and hyaluronic acid capsule production. Inactivation of covRS leads to a hypervirulent phenotype in murine models of GAS disease and resistance to complement-mediated killing by human polymorphonuclear leukocytes (Levin & Wessels, 1998; Heath et al., 1999; Engleberg et al., 2001; Graham et al., 2002; Engleberg et al., 2004). Why is there a reduction of virulence in the srv mutant strain (Reid et al., 2004) when the level of covRS/csrRS transcripts is low? This is likely due to the combination genes that are downregulated in the srv mutant, including mga, effectively eliminating the hypervirulent phenotype associated with covRS/csrRS mutants (Engleberg et al., 2001). Thus, while it is likely that a subset of the downregulated genes are Srv dependent, the overall reduction in transcript is a reflection of the reticulate regulatory network that exists in GAS (Graham et al., 2002; Kreikemeyer et al., 2003).
Our previous study of srv revealed that expression of the gene fluctuated with the highest levels of transcript identified at A600 nm = 0.1 and A600 nm = 0.6 (Reid et al., 2004). However, we observed the greatest difference in gene transcription at A600 nm = 0.4, a time when srv expression is at its lowest levels. There are several possible explanations for this observation:
A functional level of Srv is produced early in growth and then maintained in vivo. Levels of transcription increase in response to decreasing levels of Srv, suggesting that srv may be self-regulated and/or a sensory element may exist. Examination of the published SF370 (serotype M1), MGAS315 (M3), and MGAS8232 (M18) genome sequences does not reveal the presence of an adjacent ORF with homology to existing sensor kinases.
Srv is produced but remains inactive until interaction with an as yet unidentified cofactor. This cofactor may induce an oligomeric state required for function, or more subtle allosteric changes. These changes may allow Srv to interact with its own promoter.
Srv is regulated at the level of translation or undergoes posttranscriptional modification. Changes in srv transcription are in response to growth-phase, and do not reflect active levels of Srv. We are currently exploring the relationship between srv transcription and the levels of Srv present in vitro with plans to expand the work into an in vivo model of GAS infection. We are also seeking to determine whether a cofactor exists for Srv.
While the differentially expressed genes were diverse in their putative function, a subset of the genes could be grouped into several general categories:
putative or proven virulence factors (Table 3);
genes involved in the metabolism, transport, and/or catabolism of nutrients (Table 2);
genes involved in translation and posttranslational control (Table 2);
genes encoding proven or putative secreted proteins of GAS.
In our previous work, we demonstrated that virulence in MGAS5005Δsrv was significantly reduced in mice in an intraperitoneal model of infection (Reid et al., 2004), a result which agrees with the decrease in virulence factor transcript levels in MGAS5005Δsrv.
A signal P analysis of the genes which were downregulated in the absence of srv revealed as many as 51 putative/proven extracellular products may be affected. To test this hypothesis, we conducted a 2D gel analysis of GAS culture supernatant proteins. In each of three replicate experiments, we see a decrease in the production of Sic (Fig. 2), an increase in the production of SpeB (Fig. 2), and an overall increase in the number of extracellular glycolytic enzymes present (data not shown). Despite the absence of an apparent Gram-positive signal secretion sequence, glycolytic enzymes have been previously identified in GAS culture supernatants (Lei et al., 2000; Chaussee et al., 2001), as well as in other organisms (Gozalbo et al., 1998; Modun & Williams, 1999), although an exact mechanism for their release is unknown. In support of this observation, our microarray analysis identified a gene encoding a putative NADP-dependent glyceraldehyde-3-phosphate dehydrogenase as one of the few upregulated genes (SPy1371, 1.79-fold at A600 nm = 0.4).
One observation which is more difficult to reconcile is the early and increased secretion of SpeB. A concomitant increase in caseinolytic activity was also observed, but this is likely due to the increased concentration of SpeB and not to an increase in the proteolytic activity of the SpeB molecule itself. However, several factors known to positively influence SpeB transcription and maturation are down-regulated in the mutant including mga, the dpp operon, ropA, htrA, and luxS (the degree to which CovRS/CsrRS regulates SpeB is still under debate; Federle et al., 1999; Heath et al., 1999). How do we account for these seemingly disparate results? Evidence indicates that SpeB is produced late in the stationary phase of growth, a time when available nutrients are exhausted (Chaussee et al., 2001). SpeB is responsible for the cleavage of adhesins and/or invasins from the GAS cell surface and the stimulation of inflammatory molecules that may aid in the dissemination of the organism. Our data suggest that allelic replacement of srv results in decreased transcription of a large number of genes involved in the transport and metabolism of amino acids and inorganic ions. We hypothesize that GAS interprets this downregulation as entry into a nutrient-poor environment. In fact, sufficient nutrients are available, and growth of the mutant strain is comparable to wild type (Reid et al., 2004), but redundant sensory and metabolic systems are unable to alter the initial sensory pathway that is directly or indirectly influenced by Srv. Instead, SpeB production is upregulated. Either the activity or the excess presence of SpeB is perceived by the cell, and regulators and accessory molecules related to SpeB production are downregulated in an attempt to reduce SpeB levels. The result in vivo is the loss of GAS surface adhesins and/or invasins and limited or unsuccessful colonization. If this hypothesis is correct, and the loss of SpeB temporal control is responsible for the decrease in virulence of the srv mutant, the addition of SpeB to log phase cultures should result in decreased GAS virulence in an in vitro model of infection. Although an interesting hypothesis, it should be noted that given the number of GAS regulators and virulence factors apparently downregulated in MGAS5005Δsrv, the reduction in virulence is probably attributable to a combination of effects.
In summary, our research suggests that Srv functions as a GAS regulatory unit and is required for production and/or secretion of Sic and SpeB. Our studies were performed using organisms that were cultured in rich medium under optimal growth conditions. Given that we do not yet know the input signals which govern Srv function, analysis of organisms grown under different conditions may yield different results. Furthermore, our studies were limited to the use of a serotype M1 organism. It should not be assumed that the regulatory network controlled by Srv will respond equivalently in other serotypes or strains of GAS. It is reasonable to hypothesize that strain-to-strain variation in gene regulation may account for some of the differences in virulence associated with certain strains. What is clear is that GAS possesses a large number of regulators whose function overlaps or is superimposed in some cases (Kreikemeyer et al., 2003). The systematic study of these systems in vitro and in vivo will yield new insight into how GAS responds to its environment and how it achieves colonization and transmission.
Supplementary Material
The following supplementary article is available for this article online:
GAS genes differentially expressed in the absence of srv compared to wild-type (MGAS5005) at three points during growth
This material is available as part of the online article from: http://www.blackwell-synergy.com/doi/abs/10.1111/j.1574-695X.2006.00150.x (This link will take you to the article abstract).
Please note: Blackwell Publishing are not responsible for the content or functionality of any supplementary materials supplied by the authors. Any queries (other than missing material) should be directed to the corresponding author for the article.
Acknowledgments
The project was supported by grant number 0465487U from the Mid-Atlantic Affiliate Research Committee of the American Heart Association (SDR), Wake Forest University Health Sciences institutional funds (SDR), and by Public Health Service Grant RO1401507 from the National Institutes of Health to M.C.
We thank R.C. Holder for technical assistance and D. Wozniak for critical review of the manuscript.
References
- Akesson P, Sjoholm AG, Bjorck L. Protein SIC, a novel extracellular protein of Streptococcus pyogenes interfering with complement function. J Biol Chem. 1996;271:1081–1088. doi: 10.1074/jbc.271.2.1081. [DOI] [PubMed] [Google Scholar]
- Banks DJ, Porcella SF, Barbian KD, Beres SB, Philips LE, Voyich JM, DeLeo FR, Martin JM, Somerville GA, Musser JM. Progress toward characterization of the group A Streptococcus metagenome: complete genome sequence of a macrolide-resistant serotype M6 strain. J Infect Dis. 2004;190:727–738. doi: 10.1086/422697. [DOI] [PubMed] [Google Scholar]
- Beres SB, Sylva GL, Barbian KD, et al. Genome sequence of a serotype M3 strain of group A Streptococcus: phage-encoded toxins, the high-virulence phenotype, and clone emergence. Proc Natl Acad Sci USA. 2002;99:10078–10083. doi: 10.1073/pnas.152298499. [DOI] [PMC free article] [PubMed] [Google Scholar]
- Bessen D, Jones KF, Fischetti VA. Evidence for two distinct classes of streptococcal M protein and their relationship to rheumatic fever. J Exp Med. 1989;169:269–283. doi: 10.1084/jem.169.1.269. [DOI] [PMC free article] [PubMed] [Google Scholar]
- Bessen DE, Sotir CM, Readdy TL, Hollingshead SK. Genetic correlates of throat and skin isolates of group A streptococci. J Infect Dis. 1996;173:896–900. doi: 10.1093/infdis/173.4.896. [DOI] [PubMed] [Google Scholar]
- Bessen DE, Izzo MW, Fiorentino TR, Caringal RM, Hollingshead SK, Beall B. Genetic linkage of exotoxin alleles and emm gene markers for tissue tropism in group A streptococci. J Infect Dis. 1999;179:627–636. doi: 10.1086/314631. [DOI] [PubMed] [Google Scholar]
- Bessen DE, Carapetis JR, Beall B, Katz R, Hibble M, Currie BJ, Collingridge T, Izzo MW, Scaramuzzino DA, Sriprakash KS. Contrasting molecular epidemiology of group A streptococci causing tropical and nontropical infections of the skin and throat. J Infect Dis. 2000;182:1109–1116. doi: 10.1086/315842. [DOI] [PubMed] [Google Scholar]
- Caparon MG, Scott JR. Identification of a gene that regulates expression of M protein, the major virulence determinant of group A streptococci. Proc Natl Acad Sci USA. 1987;84:8677–8681. doi: 10.1073/pnas.84.23.8677. [DOI] [PMC free article] [PubMed] [Google Scholar]
- Chaussee MA, Callegari EA, Chaussee MS. Rgg regulates growth phase-dependent expression of proteins associated with secondary metabolism and stress in Streptococcus pyogenes. J Bacteriol. 2004;186:7091–7099. doi: 10.1128/JB.186.21.7091-7099.2004. [DOI] [PMC free article] [PubMed] [Google Scholar]
- Chaussee MS, Ajdic D, Ferretti JJ. The rgg gene of Streptococcus pyogenes NZ131 positively influences extracellular SPE B production. Infect Immun. 1999;67:1715–1722. doi: 10.1128/iai.67.4.1715-1722.1999. [DOI] [PMC free article] [PubMed] [Google Scholar]
- Chaussee MS, Watson RO, Smoot JC, Musser JM. Identification of Rgg-regulated exoproteins of Streptococcus pyogenes. Infect Immun. 2001;69:822–831. doi: 10.1128/IAI.69.2.822-831.2001. [DOI] [PMC free article] [PubMed] [Google Scholar]
- Collin M, Svensson MD, Sjoholm AG, Jensenius JC, Sjobring U, Olsen A. EndoS and SpeB from Streptococcus pyogenes inhibit immunoglobulin-mediated opsonophagocytosis. Infect Immun. 2002;70:6646–6651. doi: 10.1128/IAI.70.12.6646-6651.2002. [DOI] [PMC free article] [PubMed] [Google Scholar]
- Engleberg NC, Heath A, Miller A, Rivera C, DiRita VJ. Spontaneous mutations in the CsrRS two-component regulatory system of Streptococcus pyogenes result in enhanced virulence in a murine model of skin and soft tissue infection. J Infect Dis. 2001;183:1043–1054. doi: 10.1086/319291. [DOI] [PubMed] [Google Scholar]
- Engleberg NC, Heath A, Vardaman K, DiRita VJ. Contribution of CsrR-regulated virulence factors to the progress and outcome of murine skin infections by Streptococcus pyogenes. Infect Immun. 2004;72:623–628. doi: 10.1128/IAI.72.2.623-628.2004. [DOI] [PMC free article] [PubMed] [Google Scholar]
- Federle MJ, McIver KS, Scott JR. A response regulator that represses transcription of several virulence operons in the group A Streptococcus. J Bacteriol. 1999;181:3649–3657. doi: 10.1128/jb.181.12.3649-3657.1999. [DOI] [PMC free article] [PubMed] [Google Scholar]
- Ferretti JJ, McShan WM, Ajdic D, et al. Complete genome sequence of an M1 strain of Streptococcus pyogenes. Proc Natl Acad Sci USA. 2001;98:4658–4663. doi: 10.1073/pnas.071559398. [DOI] [PMC free article] [PubMed] [Google Scholar]
- Gozalbo D, Gil-Navarro I, Azorin I, Renau-Piqueras J, Martinez JP, Gil ML. The cell wall-associated glyceraldehyde-3-phosphate dehydrogenase of Candida albicans is also a fibronectin and laminin binding protein. Infect Immun. 1998;66:2052–2059. doi: 10.1128/iai.66.5.2052-2059.1998. [DOI] [PMC free article] [PubMed] [Google Scholar]
- Graham MR, Smoot LM, Migliaccio CA, Virtaneva K, Sturdevant DE, Porcella SF, Federle MJ, Adams GJ, Scott JR, Musser JM. Virulence control in group A Streptococcus by a two-component gene regulatory system: global expression profiling and in vivo infection modeling. Proc Natl Acad Sci USA. 2002;99:13855–13860. doi: 10.1073/pnas.202353699. [DOI] [PMC free article] [PubMed] [Google Scholar]
- Heath A, DiRita VJ, Barg NL, Engleberg NC. A two-component regulatory system, CsrR-CsrS, represses expression of three Streptococcus pyogenes virulence factors, hyaluronic acid capsule, streptolysin S, and pyrogenic exotoxin B. Infect Immun. 1999;67:5298–5305. doi: 10.1128/iai.67.10.5298-5305.1999. [DOI] [PMC free article] [PubMed] [Google Scholar]
- Hoe NP, Kordari P, Cole R, et al. Human immune response to streptococcal inhibitor of complement, a serotype M1 group A Streptococcus extracellular protein involved in epidemics. J Infect Dis. 2000;182:1425–1436. doi: 10.1086/315882. [DOI] [PubMed] [Google Scholar]
- Hoe NP, Vuopio-Varkila J, Vaara M, Grigsby D, De Lorenzo D, Fu YX, Dou SJ, Pan X, Nakashima K, Musser JM. Distribution of streptococcal inhibitor of complement variants in pharyngitis and invasive isolates in an epidemic of serotype M1 group A Streptococcus infection. J Infect Dis. 2001;183:633–639. doi: 10.1086/318543. [DOI] [PubMed] [Google Scholar]
- Hoe NP, Ireland RM, DeLeo FR, et al. Insight into the molecular basis of pathogen abundance: group A Streptococcus inhibitor of complement inhibits bacterial adherence and internalization into human cells. Proc Natl Acad Sci USA. 2002;99:7646–7651. doi: 10.1073/pnas.112039899. [DOI] [PMC free article] [PubMed] [Google Scholar]
- Hughes TR, Marton MJ, Jones AR. Functional discovery via a compendium of expression profiles. Cell. 2000;102:109–126. doi: 10.1016/s0092-8674(00)00015-5. [DOI] [PubMed] [Google Scholar]
- Hynes WL, Tagg JR. A simple plate assay for the detection of group A Streptococcus proteinase. J Microbiol Methods. 1985;4:25–31. [Google Scholar]
- Kapur V, Topouzis S, Majesky MW, Li LL, Hamrick MR, Hamill RJ, Patti JM, Musser JM. A conserved Streptococcus pyogenes extracellular cysteine protease cleaves human fibronectin and degrades vitronectin. Microb Pathog. 1993;15:327–346. doi: 10.1006/mpat.1993.1083. [DOI] [PubMed] [Google Scholar]
- Kreikemeyer B, McIver KS, Podbielski A. Virulence factor regulation and regulatory networks in Streptococcus pyogenes and their impact on pathogen–host interactions. Trends Microbiol. 2003;11:224–232. doi: 10.1016/s0966-842x(03)00098-2. [DOI] [PubMed] [Google Scholar]
- Lei B, Mackie S, Lukomski S, Musser JM. Identification and immunogenicity of group A Streptococcus culture supernatant proteins. Infect Immun. 2000;68:6807–6818. doi: 10.1128/iai.68.12.6807-6818.2000. [DOI] [PMC free article] [PubMed] [Google Scholar]
- Leimeister-Wachter M, Haffner C, Domann E, Goebel W, Chakraborty T. Identification of a gene that positively regulates expression of listeriolysin, the major virulence factor of Listeria monocytogenes. Proc Natl Acad Sci USA. 1990;87:8336–8340. doi: 10.1073/pnas.87.21.8336. [DOI] [PMC free article] [PubMed] [Google Scholar]
- Levin JC, Wessels MR. Identification of csrR/csrS, a genetic locus that regulates hyaluronic acid capsule synthesis in group A Streptococcus. Mol Microbiol. 1998;30:209–219. doi: 10.1046/j.1365-2958.1998.01057.x. [DOI] [PubMed] [Google Scholar]
- Lukomski S, Sreevatsan S, Amberg C, Reichardt W, Woischnik M, Podbielski A, Musser JM. Inactivation of Streptococcus pyogenes extracellular cysteine protease significantly decreases mouse lethality of serotype M3 and M49 strains. J Clin Invest. 1997;99:2574–2580. doi: 10.1172/JCI119445. [DOI] [PMC free article] [PubMed] [Google Scholar]
- Lukomski S, Hoe NP, Abdi I, Rurangirwa J, Kordari P, Liu M, Dou SJ, Adams GG, Musser JM. Nonpolar inactivation of the hypervariable streptococcal inhibitor of complement gene (sic) in serotype M1 Streptococcus pyogenes significantly decreases mouse mucosal colonization. Infect Immun. 2000;68:535–542. doi: 10.1128/iai.68.2.535-542.2000. [DOI] [PMC free article] [PubMed] [Google Scholar]
- McGregor KF, Spratt BG, Kalia A, Bennett A, Bilek N, Beall B, Bessen DE. Multilocus sequence typing of Streptococcus pyogenes representing most known emm types and distinctions among subpopulation genetic structures. J Bacteriol. 2004;186:4285–4294. doi: 10.1128/JB.186.13.4285-4294.2004. [DOI] [PMC free article] [PubMed] [Google Scholar]
- Modun B, Williams P. The staphylococcal transferrin-binding protein is a cell wall glyceraldehyde-3-phosphate dehydrogenase. Infect Immun. 1999;67:1086–1092. doi: 10.1128/iai.67.3.1086-1092.1999. [DOI] [PMC free article] [PubMed] [Google Scholar]
- Musser JM, Krause RM. The Revival of Group A Streptococcal Diseases, with a Commentary on Staphylococcal Toxic Shock Syndrome. In: Krause RM, editor. Emerging Infections. Academic Press; New York: 1998. pp. 185–218. [Google Scholar]
- Nakagawa I, Kurokawa K, Yamashita A, et al. Genome sequence of an M3 strain of Streptococcus pyogenes reveals a large-scale genomic rearrangement in invasive strains and new insights into phage evolution. Genome Res. 2003;13:1042–1055. doi: 10.1101/gr.1096703. [DOI] [PMC free article] [PubMed] [Google Scholar]
- Reid SD, Green NM, Buss JK, Lei B, Musser JM. Multilocus analysis of extracellular putative virulence proteins made by group A Streptococcus: population genetics, human serologic response, and gene transcription. Proc Natl Acad Sci USA. 2001a;98:7552–7557. doi: 10.1073/pnas.121188598. [DOI] [PMC free article] [PubMed] [Google Scholar]
- Reid SD, Hoe NP, Smoot LM, Musser JM. Group A Streptococcus: allelic variation, population genetics, and host–pathogen interactions. J Clin Invest. 2001b;107:393–399. doi: 10.1172/JCI11972. [DOI] [PMC free article] [PubMed] [Google Scholar]
- Reid S, Montgomery A, Musser J. Identification of srv, a PrfA-like regulator of group A Streptococcus that influences virulence. Infect Immun. 2004;72:1799–1803. doi: 10.1128/IAI.72.3.1799-1803.2004. [DOI] [PMC free article] [PubMed] [Google Scholar]
- Robbins JC, Spanier JG, Jones SJ, Simpson WJ, Cleary PP. Streptococcus pyogenes type 12 M protein gene regulation by upstream sequences. J Bacteriol. 1987;169:5633–5640. doi: 10.1128/jb.169.12.5633-5640.1987. [DOI] [PMC free article] [PubMed] [Google Scholar]
- Schmidtchen A, Frick IM, Andersson E, Tapper H, Bjorck L. Proteinases of common pathogenic bacteria degrade and inactivate the antibacterial peptide LL-37. Mol Microbiol. 2002;46:157–168. doi: 10.1046/j.1365-2958.2002.03146.x. [DOI] [PubMed] [Google Scholar]
- Simpson WJ, Cleary PP. Expression of m type 12 protein by a group A Streptococcus exhibits phaselike variation: evidence for coregulation of colony opacity determinants and M protein. Infect Immun. 1987;55:2448–2455. doi: 10.1128/iai.55.10.2448-2455.1987. [DOI] [PMC free article] [PubMed] [Google Scholar]
- Smoot JC, Barbian KD, Van Gompel JJ, et al. Genome sequence and comparative microarray analysis of serotype M18 group A Streptococcus strains associated with acute rheumatic fever outbreaks. Proc Natl Acad Sci USA. 2002;99:4668–4673. doi: 10.1073/pnas.062526099. [DOI] [PMC free article] [PubMed] [Google Scholar]
- Smoot LM, Smoot JC, Graham MR, Somerville GA, Sturdevant DE, Migliaccio CA, Sylva GL, Musser JM. Global differential gene expression in response to growth temperature alteration in group A Streptococcus. Proc Natl Acad Sci USA. 2001;98:10416–10421. doi: 10.1073/pnas.191267598. [DOI] [PMC free article] [PubMed] [Google Scholar]
- Spanier JG, Jones SJ, Cleary P. Small DNA deletions creating avirulence in Streptococcus pyogenes. Science. 1984;225:935–938. doi: 10.1126/science.6089334. [DOI] [PubMed] [Google Scholar]
- Stockbauer KE, Grigsby D, Pan X, Fu YX, Mejia LM, Cravioto A, Musser JM. Hypervariability generated by natural selection in an extracellular complement-inhibiting protein of serotype M1 strains of group A Streptococcus. Proc Natl Acad Sci USA. 1998;95:3128–3133. doi: 10.1073/pnas.95.6.3128. [DOI] [PMC free article] [PubMed] [Google Scholar]
- Tatusov RL, Galperin MY, Natale DA, Koonin EV. The COG database: a tool for genome-scale analysis of protein functions and evolution. Nucleic Acids Res. 2000;28:33–36. doi: 10.1093/nar/28.1.33. [DOI] [PMC free article] [PubMed] [Google Scholar]
- Voyich JM, Sturdevant DE, Braughton KR, Kobayashi SD, Lei B, Virtaneva K, Dorward DW, Musser JM, DeLeo FR. Genome-wide protective response used by group A Streptococcus to evade destruction by human polymorphonuclear leukocytes. Proc Natl Acad Sci USA. 2003;100:1996–2001. doi: 10.1073/pnas.0337370100. [DOI] [PMC free article] [PubMed] [Google Scholar]
Associated Data
This section collects any data citations, data availability statements, or supplementary materials included in this article.
Supplementary Materials
The following supplementary article is available for this article online:
GAS genes differentially expressed in the absence of srv compared to wild-type (MGAS5005) at three points during growth
This material is available as part of the online article from: http://www.blackwell-synergy.com/doi/abs/10.1111/j.1574-695X.2006.00150.x (This link will take you to the article abstract).
Please note: Blackwell Publishing are not responsible for the content or functionality of any supplementary materials supplied by the authors. Any queries (other than missing material) should be directed to the corresponding author for the article.