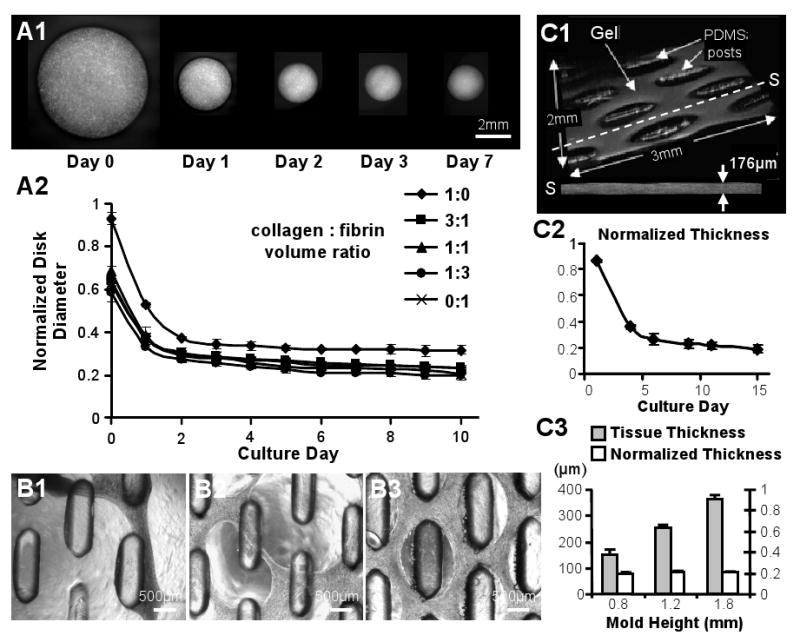
Figure 3. Skeletal myoblast-mediated gel compaction.

(A1) Serial images of gel disks with C2C12 myoblasts. (A2) Time course of compaction for free-floating C2C12 gel disks made with different ratios of collagen and fibrin. Disk diameter is normalized to that before gelation. (B1-3) Primary rSKM tissue networks made of (B1) “pure” collagen gel after 3 days of differentiation, (B2) 1:1 collagen:fibrin composite gel after 10 days of differentiation, and (B3) “pure” fibrin gel after 17 days of differentiation. Note that only rSKM/fibrin gel networks remained intact during long-term culture. (C1) Example of the volume OCT images used for non-invasive monitoring of tissue thickness. The dashed line indicates the position of a cross-sectional slice (S) with an average thickness of 176μm. (C2) Thickness of the rSKM/fibrin tissue networks as a function of culture time, normalized by the height of the PDMS mold. (C3) Final thicknesses of the 15 day old networks made using PDMS molds with different heights (and other dimensions the same). Note the linear dependence of the final tissue thickness on the mold height with a slope (average normalized thickness) of ∼0.2. Small error bars in C2 and C3 indicate highly reproducible tissue network geometry.
