Abstract
Before the 1970s, today's older Americans were exposed to high levels of lead in the environment. The authors previously reported that lifetime cumulative lead dose was associated with lower cognitive test performance in older adults. Experiments suggest that environmental stress may intensify the detrimental influence of lead. No large, population-based studies of this question have been done. The authors evaluated whether cross-sectional associations of tibia lead with cognitive function were modified by neighborhood psychosocial hazards in the Baltimore Memory Study (2001–2005), a longitudinal cohort study of determinants of cognitive decline. Tibia lead was measured via 109Cd-induced K-shell X-ray fluorescence. Neighborhood psychosocial hazards were measured independently of study subjects. Complete data were available among 1,001 demographically diverse adults aged 50–70 years, randomly selected from 65 contiguous neighborhoods in Baltimore City. Hierarchical mixed-effects regression models showed that neighborhood psychosocial hazards exacerbated the adverse associations of tibia lead in 3 of 7 cognitive domains after adjustment for age, sex, race/ethnicity, education, testing technician, and time of day (language, P = 0.039; processing speed, P = 0.067; executive functioning, P = 0.025). The joint occurrence of environmental stress and lead exposure across the life span may partially explain persistent racial/ethnic and socioeconomic disparities in cognitive function in late life.
Keywords: aging, cognition, cohort studies, lead, residence characteristics, socioeconomic factors, urban population
Lead is a ubiquitous neurotoxicant found in measurable levels in all individuals (1–3). It was extensively used as a gasoline additive and in paint, solder, food cans, water pipes, and other commercial products until being eliminated from new use after worries about smog led to the addition of catalytic converters to automobiles, and through successful public health efforts in the 1970s. Prior to its elimination, peak levels of blood lead were probably achieved in the 1960s and later documented in national samples starting in the 1970s (1, 4) to have resulted in average blood lead levels exceeding 15–20 μg/dL in Americans. The current cohort of older adults has been exposed to lead across the life span, but probably at highest levels during critical developmental periods in childhood and early adulthood. As this cohort ages, the consequences of this legacy of lead exposure for brain health are not known.
A growing body of evidence suggests that environmental lead exposure adversely affects cognitive function in adults (5–8), although most studies to date have been small or restricted to select occupationally exposed groups (9). In the first large-scale, population-based study of sociodemographically diverse subjects, we reported that cumulative lead dose was associated with worse test performance across a range of cognitive domains (10). Population aging will require improved prevention and treatment of the dementing illnesses in coming decades. It is especially important to investigate the role that lifetime cumulative lead exposure will play in the epidemiology of dementia. However, the role of lead is likely to be complex, requiring careful attention to how biologic, social, and environmental factors interact. A key challenge is to identify potentially modifiable cofactors that increase the vulnerability of the aging brain to lead's harmful effects.
Recent studies of both rodents (11–13) and humans (14) suggest that “environmental stress” may exacerbate the deleterious influence of lead on the brain. However, most studies have been done in experimental models of stress. Although investigation of this question in community-dwelling humans is more challenging, social scientists have developed several approaches to assessing the presence of psychosocial hazards in the community (15, 16). However, these approaches have not been applied to whether lead interacts with environmental stress in adults.
We investigated whether a measure of neighborhood psychosocial hazards modified associations of lifetime cumulative lead dose and cognitive function in a population-based, random sample of urban-dwelling adults with diverse sociodemographic characteristics. We tested the hypothesis that the adverse association of cumulative lead dose with cognitive function was intensified in those living in neighborhoods with more psychosocial hazards. If lead and psychosocial hazards interact, this suggests that environmental stress may increase susceptibility to the neurotoxicity of lead, or that lead increases the harmful effects of stress on the brain. A better understanding of how lead and stress interact may help to explain persistent disparities by race/ethnicity and socioeconomic status in cognitive function in late life, as well as to elucidate mechanisms for age-related cognitive dysfunction and decline (17).
MATERIALS AND METHODS
Study population and design
The Baltimore Memory Study is a longitudinal cohort study of urban-dwelling persons aged 50–70 years designed to examine the determinants of cognitive decline across multiple levels (genes to neighborhoods). Details of the study design have been previously described (18–20). Households with telephone numbers in 65 contiguous neighborhoods of Baltimore, Maryland, were randomly selected; 18,826 were contacted to assess eligibility and interest in the study. Neighborhoods were selected to offer variation by race/ethnicity and socioeconomic status. Persons living in Baltimore at least 5 years and 50–70 years of age were eligible. Among 2,351 randomly chosen residents meeting these criteria, 1,140 (48.5%) were subsequently enrolled in the study and completed a first study visit. A total of 1,033 (90.6%) subjects completed a second visit 14 months later; tibia lead concentration was measured then. All subjects provided written, informed consent and were paid $50. The study was approved by the Committee for Human Research at the Johns Hopkins Bloomberg School of Public Health.
Individual-level data collection
Data collection has been previously described (18–20). All subjects completed baseline testing in this order: cognitive testing, blood pressure, height, weight, urine collection, structured interview, and venipuncture. The 90-minute cognitive battery included 20 standardized tests. It was designed to assess a broad range of domains, to provide multiple measures of each, and to minimize differential bias by race/ethnicity or socioeconomic status (18–20). The structured interview obtained self-reported information on race/ethnicity, age, sex, and educational attainment. Educational attainment was measured using an ordinal 9-level index combining years of school attended with credentials, degrees, and certificates earned.
Measurement of bone lead dose
Lead in the tibia has a characteristic residence time (“half-life”) measured in decades; its concentration (as micrograms of lead per gram of bone mineral) can be measured by using 109Cd K-shell X-ray fluorescence (21–23). Because of the long clearance half-time (up to 30 years) of lead from tibia, levels measured at visit 2 can be assumed to be valid estimates of levels at visit 1. Prior to the analysis, the 3 most extreme values of estimated tibia lead were dropped from the analysis after being judged to be so extreme as to be unlikely to have come from the same underlying population distribution (values of 148 and −32 μg/g). Although values of this magnitude are not unreasonable among occupationally exposed persons, our concern was that these cases were dramatic departures from the distribution; use of these values would be impossible to trust. After examination of partial residual plots, we trimmed another less extreme set of outlying estimates (n = 11) to the first and 99th percentiles of the distribution (−7 and 52 μg/g, respectively) to avoid having these observations drive the results.
Measuring psychosocial hazards in neighborhoods
Neighborhood boundaries based on community definitions of existing neighborhoods were created by the Baltimore City Department of Planning. Data on neighborhood characteristics came from the 2000 US Census, the Baltimore City Departments of Police, Housing, and Public Works, and telephone books (15), and all were measured at the place level. In order to reduce dependent measurement error, no information from study subjects was used. Block-level census data were recombined into preestablished neighborhood boundaries by the US Census Bureau via special tabulation. Violent crimes from 1999 to 2001, off-site liquor licenses in 2001, and 9-1-1 emergency telephone calls in 2001 were individually mapped and aggregated at the neighborhood level by use of a geographic information system. Participants were linked to their neighborhood of residence by their home address at baseline.
We measured the presence of psychosocial hazards, which we define as stable and visible features of neighborhood environments that give rise to a heightened state of vigilance, alarm, or threat in residents (15, 24–26). The 12-item neighborhood psychosocial hazards (NPH) scale was constructed by using theory and factor analysis (15, 25). For modeling, the NPH scale was divided into tertiles.
Statistical analysis
The primary goal of the analysis was to assess whether the association between tibia lead and cognitive function was modified by levels of neighborhood psychosocial hazards. The analysis included only participants who had both tibia lead measurements and an NPH scale score matched to their address, as well as complete data on all covariates (N = 1,001). Statistical analyses were conducted by using SAS software (SAS Institute, Inc., Cary, North Carolina).
The 20 cognitive test results were first standardized to a common metric and then collapsed into 7 cognitive domain scores before analysis to minimize multiple comparisons and to improve measurement properties (10). The domains included language (Boston naming test, letter fluency, and category fluency); processing speed (simple reaction time); eye-hand coordination (Purdue pegboard dominant hand, nondominant hand, and both hands, as well as trail-making test A); executive functioning (Purdue pegboard assembly minus both hands, Stroop C form minus A form, and trail-making test B minus A); verbal memory and learning (Rey auditory verbal learning test immediate recall, delayed recall, and recognition); visual memory (Rey complex figure delayed recall and symbol digit); and visuoconstruction (Rey complex figure copy). All 7 domain scores were standardized for direction so that a negative regression coefficient indicated worse performance. One outcome measure (processing speed) was trimmed at the first percentile of −3.4, because of a strong negative skew of −3.0 and kurtosis of 13.6 and because model residuals suggested a poor fit to these extreme values.
We used a multilevel hierarchical regression model to account for misestimates of the standard errors (27). Variables were included in the model if they were independently associated with the outcomes or if they substantively changed the influence of the NPH scale on the relations of tibia lead with cognitive scores. The model included the main effects of tibia lead (μg/dL), age (years, centered), sex (female), race/ethnicity (white vs. nonwhite), educational attainment (9-level ordinal index), testing technician (3 indicator variables), testing in the evening (yes vs. no), and the main effect of the NPH scale parameterized using 2 indicator variables (coded 1 for yes, 0 for no) for the middle versus the lowest (used as reference) and for the highest versus the lowest tertile. To evaluate effect modification, we included 2 cross-level interaction terms by multiplying tibia lead by the 2 NPH scale tertile indicators. Continuous cross-products (e.g., NPH × tibia lead) were not used because they produced highly influential outliers. Formal hypothesis testing was done by examining improvement in model fit between nested models: one with all covariates including interaction terms; the other, a restricted model in which the interaction terms were fixed at 0. The difference between the −2 log-likelihood of these models is evaluated as χ2 (at 2 df) to test the improvement in model fit attributable to the overall interaction between tibia lead and the NPH scale.
We examined model residuals for the fixed and random portions of the model and conducted extensive influence diagnostics. Because of the small proportion of extreme values in several of the cognitive domain scores, a number of high influence observations were identified that distorted the regression slope relative to the bulk of the data. By use of a combination of influence diagnostics and added-variable plots, final models were estimated after deletion of these influential data points (from 1 to 4 depending on the outcome). We chose to present final models without these influential points, because the 2 analyses—with and without influential observations—resulted in the same number of cognitive domains with evidence of significant interactions between tibia lead and the NPH scale. However, our confidence in the analysis without influential data points was substantially higher than in the complete case analysis. In 1 cognitive domain (verbal memory and learning), evidence of a significant interaction between tibia lead and the NPH scale was found to be an artifact of 2 extreme values. In another domain (processing speed), evidence of a lead × NPH interaction was observed in added-variable plots; however, the slopes were biased toward the null by several extreme values for processing speed that had large standardized residuals of >−4 and large estimated leverage.
RESULTS
Description of study subjects
The 1,001 study subjects were 66% female and 45% nonwhite race/ethnicity, and they had a mean age of 59.4 (standard deviation, 5.7) years. Tibia lead levels were moderate to high with a mean of 18.8 (standard deviation, 11.6) μg/g (Table 1). Tibia lead levels were significantly higher in those living in neighborhoods in the highest tertiles of the NPH scale compared with those living in the least hazardous neighborhoods (P < 0.001). Although the NPH scale score was significantly associated with the percent nonwhite race/ethnicity, the least hazardous neighborhoods had 20% nonwhite residents, while the most hazardous neighborhoods had 18% white residents. All 7 cognitive domain scores varied significantly across levels of the NPH scale in the expected direction (residents of more hazardous neighborhoods performed worse in all domains).
Table 1.
Characteristics of Baltimore Memory Study Participants at Baseline, 2001–2003
| Variable | Total Sample (N = 1,001) | Neighborhood Psychosocial Hazards Scale |
P Valuea | ||
| Lowest Tertile (n = 280) | Middle Tertile (n = 387) | Highest Tertile (n = 334) | |||
| Individual-level variables | |||||
| Mean age, years (SD) | 59.4 (6.0) | 59.3 (5.7) | 59.4 (6.0) | 59.7 (6.1) | <0.001 |
| Women, no. (%) | 662 (65.9) | 191 (68.2) | 244 (63.1) | 226 (67.6) | 0.283 |
| Non-white race/ethnicity, no. (%) | 451 (44.9) | 57 (20.3) | 177 (45.7) | 216 (64.7) | <0.001 |
| Mean educational attainment, 9-level index (SD) | 4.9 (2.2) | 6.2 (1.9) | 4.8 (2.1) | 4.1 (2.0) | <0.001 |
| Mean tibia lead level, μg/g (SD) | 18.8 (11.1) | 16.3 (11.0) | 19.3 (10.7) | 20.3 (11.4) | <0.001 |
| Mean cognitive domain scores (SD)b | |||||
| Language | 0.01 (0.82) | 0.36 (0.70) | 0.02 (0.79) | −0.29 (0.85) | <0.001 |
| Processing speed | 0.06 (0.84) | 0.25 (0.66) | 0.07 (0.84) | −0.11 (0.95) | <0.001 |
| Eye-hand coordination | 0.02 (0.76) | 0.27 (0.61) | 0.03 (0.74) | −0.21 (0.83) | <0.001 |
| Executive functioning | 0.03 (0.71) | 0.30 (0.63) | 0.03 (0.74) | −0.18 (0.70) | <0.001 |
| Verbal learning and memory | 0.02 (0.89) | 0.24 (0.73) | 0.02 (0.87) | −0.15 (0.99) | <0.001 |
| Visual memory | 0.03 (0.85) | 0.23 (0.78) | 0.07 (0.86) | −0.19 (0.84) | <0.001 |
| Visuoconstruction | 0.04 (0.98) | 0.32 (0.85) | 0.10 (0.94) | −0.28 (1.05) | <0.001 |
Abbreviation: SD, standard deviation.
P values indicate whether the variable means or distributions differ across tertiles of the neighborhood psychosocial hazards scale; t tests were used for continuous variables and χ2 tests for categorical variables.
Cognitive domain scores depart from expected values (mean = 0, SD, 1) because z-transformation was performed by using data from all 1,140 study subjects at visit 1.
Effect modification of tibia lead by neighborhood psychosocial hazards
We used hierarchical regression models to evaluate effect modification by the NPH scale on relations between tibia lead and cognitive domain scores (Table 2). The regression parameters for the cross-products can be interpreted as the increase (for a positive coefficient) or the decrease of the association of a 1-μg/g change in tibia lead as the level of neighborhood psychosocial hazards increases from the first to the second or from the first to the third tertile, respectively. In 2 of 7 domains, evidence was found for significant effect modification (P < 0.05). The association of tibia lead was more severe for language and executive functioning among those living in neighborhoods with middle or high tertiles of the NPH scale (refer to the χ2 tests in the bottom row of Table 2). There was evidence of a borderline association in the same direction for processing speed (P = 0.067). In all 7 outcomes, the estimated slopes for the interaction of tibia lead and the highest tertile of the NPH scale were negative, suggesting that living in a neighborhood with a high NPH scale score was consistently associated with a trend toward more adverse lead association. Five of 7 estimated slopes for the middle tertile-lead interaction were negative.
Table 2.
Associations of Tibia Lead, Neighborhood Psychosocial Hazards Scale, and Their Interaction in 7 Domains of Cognitive Function in the Baltimore Memory Study, 2001–2005
| Variable | Languagea (n = 998)b |
Processing Speeda (n = 999)b |
Eye-Hand Coordinationa (n = 997)b |
Executive Functioninga (n = 996)b |
Verbal Learning and Memorya (n = 997)b |
Visual Memorya (n = 997)b |
Visuoconstructiona (n = 1,000)b |
|||||||
| β | 95% Confidence Interval | β | 95% Confidence Interval | β | 95% Confidence Interval | β | 95% Confidence Interval | β | 95% Confidence Interval | β | 95% Confidence Interval | β | 95% Confidence Interval | |
| Intercept | −0.457*** | −0.653, −0.261 | −0.142 | −0.389, 0.106 | −0.166 | −0.363, 0.03 | −0.123 | −0.308, 0.06 | −0.789*** | −1.028, −0.55 | −0.217* | −0.463, 0.03 | −0.437** | −0.697, −0.18 |
| Tibia lead main effect, μg/dL | 0.004 | −0.002, 0.011 | 0.007 | −0.001, 0.015 | 0.002 | −0.004, 0.01 | 0.004 | −0.003, 0.01 | 0.001 | −0.006, 0.01 | 0.001 | −0.007, 0.01 | 0.000 | −0.009, 0.01 |
| NPH main effect | ||||||||||||||
| Middle tertile vs. low | 0.002 | −0.178, 0.181 | 0.141 | −0.084, 0.366 | 0.016 | −0.163, 0.20 | −0.038 | −0.205, 0.13 | 0.164 | −0.055, 0.38 | 0.016 | −0.210, 0.24 | 0.149 | −0.089, 0.39 |
| High tertile vs.low | 0.105 | −0.086, 0.296 | 0.038 | −0.200, 0.276 | −0.047 | −0.237, 0.14 | 0.058 | −0.118, 0.23 | 0.118 | −0.115, 0.35 | 0.061 | −0.180, 0.30 | 0.014 | −0.238, 0.27 |
| Tibia lead × NPH interaction | ||||||||||||||
| Middle tertile × tibia | 0.001 | −0.008, 0.009 | −0.012* | −0.022, −0.001 | −0.004 | −0.012, 0.005 | −0.002 | −0.010, 0.006 | −0.007 | −0.017, 0.004 | 0.001 | −0.010, 0.011 | −0.003 | −0.014, 0.008 |
| High tertile × tibia | −0.009* | −0.017, −0.0001 | −0.011* | −0.022, −0.0001 | −0.006 | −0.015, 0.002 | −0.010** | −0.018, −0.002 | −0.006 | −0.016, 0.005 | −0.007 | −0.018, 0.004 | −0.006 | −0.017, 0.005 |
| χ2 test for interactionc | 6.5 (P = 0.039) | 5.4 (P = 0.067) | 2.0 (P = 0.368) | 7.4 (P = 0.025) | 1.8 (P = 0.407) | 2.9 (P = 0.235) | 1.0 (P = 0.607) | |||||||
Abbreviation: NPH, neighborhood psychosocial hazards.
* P < 0.1; **P < 0.05; ***P < 0.001.
All models include the following additional covariates: age (years, centered), sex (female), race/ethnicity (white vs. nonwhite), educational attainment (9-level ordinal index), testing technician (4 technicians), and testing in the evening (yes vs. no).
Sample sizes for each model depart from the total number of 1,001 because of the exclusion of cases found to have an extreme influence on results. Refer to Materials and Methods.
χ2 values are based on log-likelihood ratio differences from nested models with and without 2 tibia lead × NPH interaction terms; −2 log-likelihood estimates for both models are derived from maximum likelihood estimation from hierarchical mixed-effects models. P values (in parentheses) are based on the difference in model degrees of freedom (2 in this case).
Figures 1–7 display the hierarchical regression results for evaluation of effect modification for each cognitive domain. The figures are constructed from plots of partial residuals from a model with all covariates except the tibia lead × NPH cross-products, and they show the slopes of tibia lead in each tertile of the NPH scale. The lead slope was positive (although not significant for any outcome as shown in Table 2) for all cognitive domains among residents of the lowest tertile NPH scale neighborhoods (dashed line). Residents of neighborhoods in the highest NPH scale tertile showed worse lead associations for all 7 outcomes (solid line). For all but 3 outcomes (language, visual learning and memory, and spatial ability), the slope of tibia lead with cognition was steeper for the highest tertile of the NPH scale compared with the middle tertile (dotted line).
Figure 1.
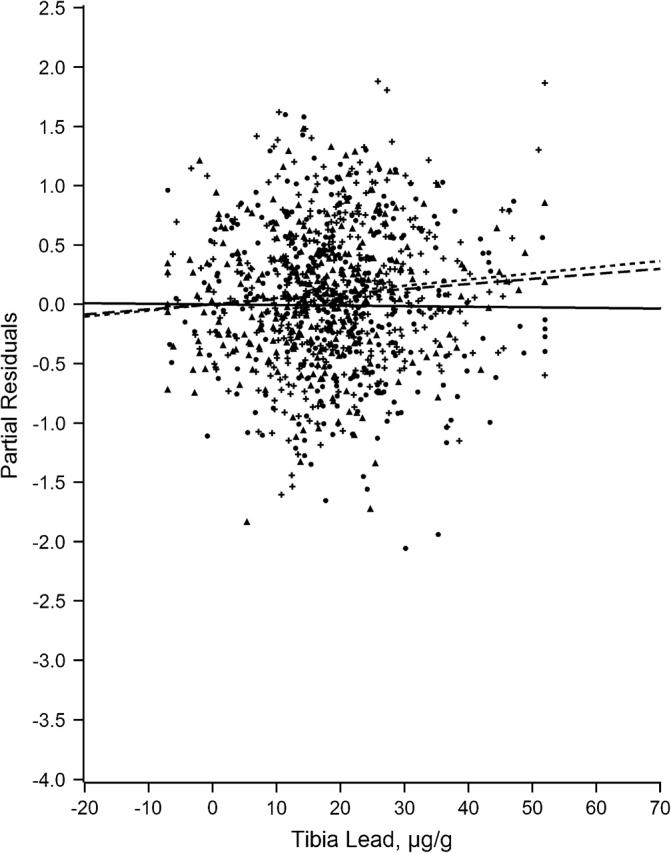
Partial residual plot of language by tibia lead by tertiles of neighborhood psychosocial hazards scale, Baltimore Memory Study, 2001–2005. High tertile = solid line, solid dots; middle tertile = dotted line, plus; low tertile = dashed line, triangle.
Figure 2.
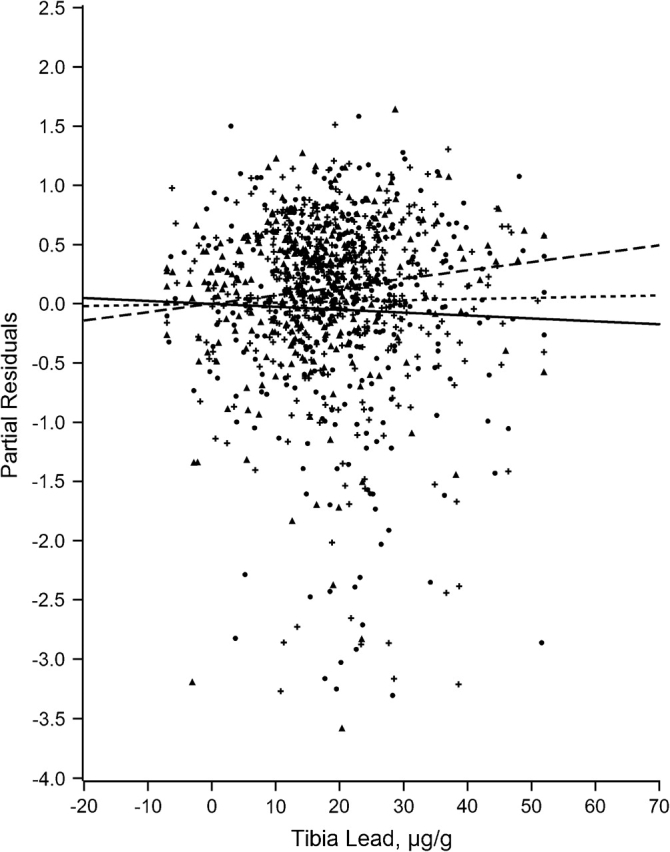
Partial residual plot of processing speed by tibia lead by tertiles of neighborhood psychosocial hazards scale, Baltimore Memory Study, 2001–2005. High tertile = solid line, solid dots; middle tertile = dotted line, plus; low tertile = dashed line, triangle.
Figure 3.
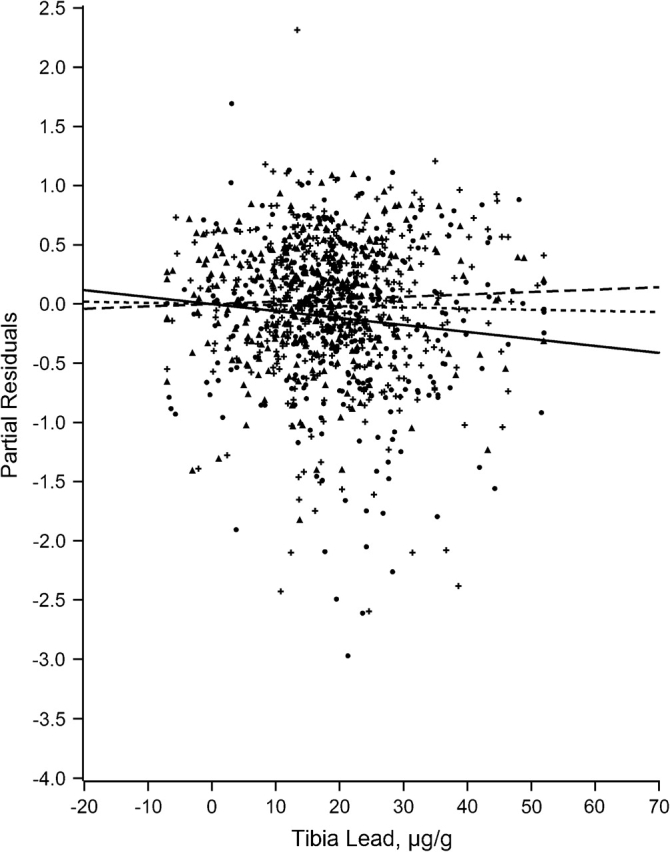
Partial residual plot of eye-hand coordination by tibia lead by tertiles of neighborhood psychosocial hazards scale, Baltimore Memory Study, 2001–2005. High tertile = solid line, solid dots; middle tertile = dotted line, plus; low tertile = dashed line, triangle.
Figure 4.
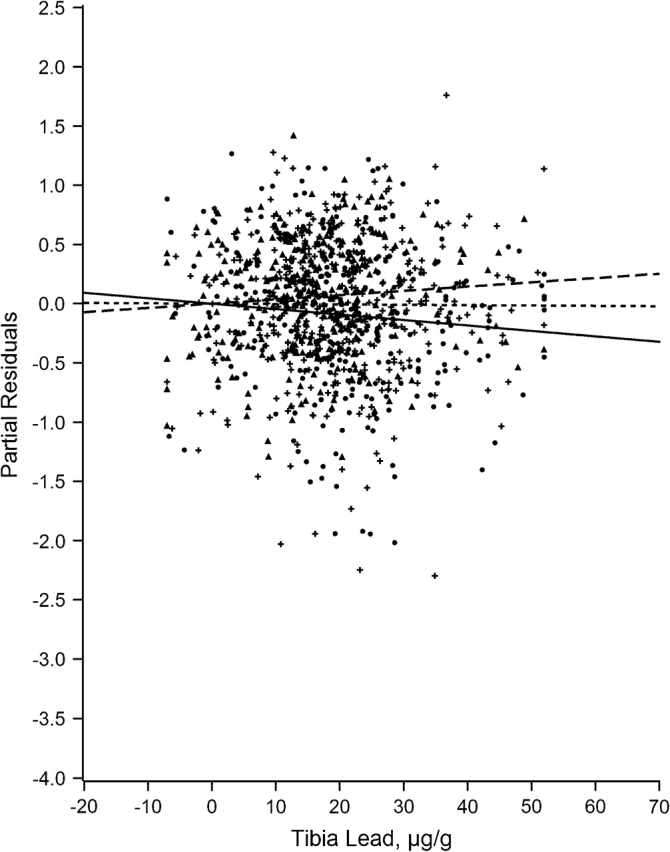
Partial residual plot of executive ability by tibia lead by tertiles of neighborhood psychosocial hazards scale, Baltimore Memory Study, 2001–2005. High tertile = solid line, solid dots; middle tertile = dotted line, plus; low tertile = dashed line, triangle.
Figure 5.
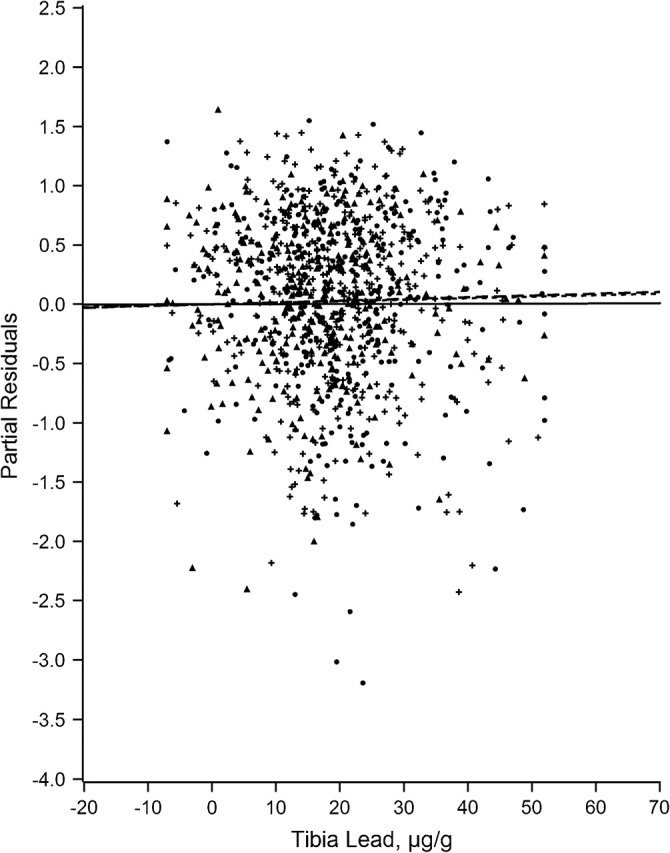
Partial residual plot of verbal memory and learning by tibia lead by tertiles of neighborhood psychosocial hazards scale, Baltimore Memory Study, 2001–2005. High tertile = solid line, solid dots; middle tertile = dotted line, plus; low tertile = dashed line, triangle.
Figure 6.
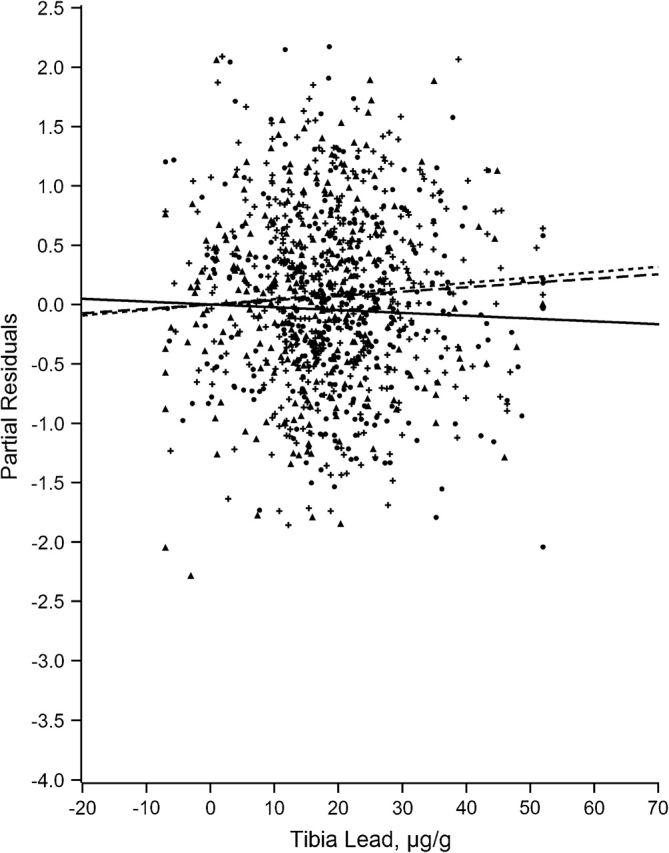
Partial residual plot of visual memory and learning by tibia lead by tertiles of neighborhood psychosocial hazards scale, Baltimore Memory Study, 2001–2005. High tertile = solid line, solid dots; middle tertile = dotted line, plus; low tertile = dashed line, triangle.
Figure 7.
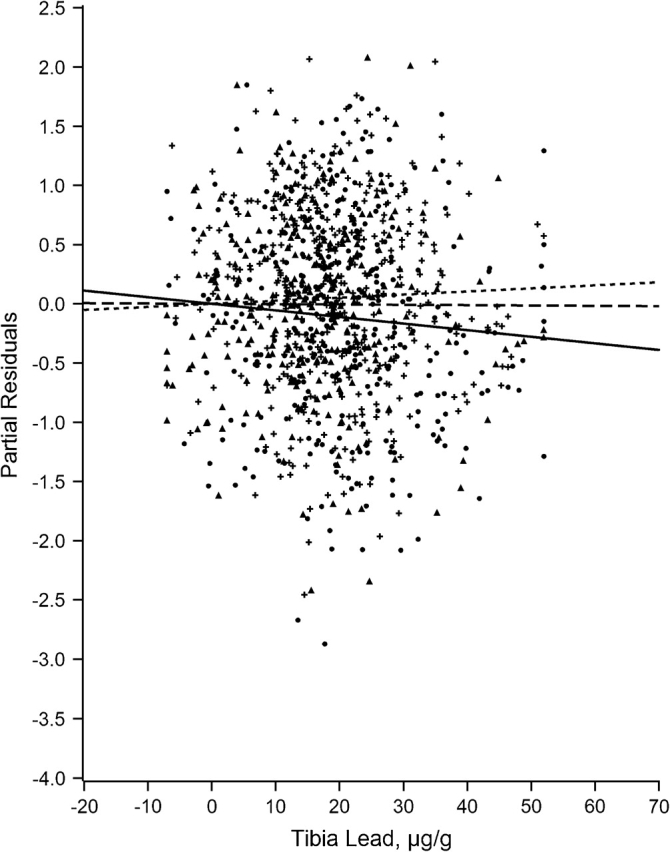
Partial residual plot of spatial ability by tibia lead by tertiles of neighborhood psychosocial hazards scale, Baltimore Memory Study, 2001–2005. High tertile = solid line, solid dots; middle tertile = dotted line, plus; low tertile = dashed line, triangle.
DISCUSSION
This is the first population-based study to evaluate whether the association of lifetime cumulative lead dose with cognitive function is modified by neighborhood psychosocial hazards. In a recent review of the epidemiologic literature, Shih et al. (9) concluded that there was sufficient evidence to conclude that cumulative lead dose adversely affects adult cognitive function. Here, we provide new evidence that, among older residents of neighborhoods with higher levels of psychosocial hazards, tibia lead was associated with a stronger adverse impact in 2 of 7 domains (P < 0.05), with additional evidence of a borderline association in a third domain (P = 0.067). This finding is consistent with previous animal studies that have found stronger effects of lead on learning and cognition after exposure to standardized psychosocial stressors (12). To our knowledge, this is the first evidence of interaction between neurotoxicants and features of the social environment on cognitive function in adult humans.
These results suggest that the association between cumulative lead dose and cognition may be more complex than previously thought. Studies of the main effects of lead may have underestimated its impact on socially disadvantaged groups living in adverse environments. Although disentangling the “independent” effects of socioeconomic status, race/ethnicity, and cumulative lead dose can be exceedingly difficult (28), it is possible that the simultaneous occurrence of high lead body burden and long-term exposure to stressful environments accounts for some fraction of the well-documented disparities in cognitive function across race/ethnic and socioeconomic groups in late life (29). This possibility is further strengthened by our findings showing that African Americans were more likely to live in psychosocially hazardous neighborhoods and had higher cumulative lead doses (Table 1). Interestingly, the inclusion of race/ethnicity did not result in substantial reduction in the magnitude of the lead × NPH interactions.
We believe that these findings are biologically plausible. First, animal studies have shown that stress can increase the hormonal mobilization of lead from bone to blood (30) and that lead exposure can alter responsiveness to environmental stress (11, 12). Exposure to psychosocial hazards in the laboratory increases cortisol production, the primary hormonal mediator of the hypothalamic-pituitary-adrenal axis. Cortisol itself is associated with impaired memory and executive ability in older adults (31–33). Further, both lead and cortisol are thought to alter common pathways in the mesocorticolimbic system, including calcium- and glutamate-mediated processes (11, 13, 34). Both cortisol and lead appear to be associated with similar domains of cognitive function (especially memory and executive functioning). Glucocorticoid receptors are known to be present in relevant brain structures that govern these areas. We found a pattern of associations that fits the existing biologic understanding; associations were found for language and executive functioning, but not with memory and learning.
The idea that stress may exacerbate the influence of neurotoxicants was proposed by Selye et al. (35) more than 4 decades ago. Despite these early studies, insufficient attention has been given to how neurotoxicant effects vary by contextual factors (36). Several previous studies in children indicate that the adverse effects of lead on cognition vary by individual socioeconomic status (17, 36–42). This raises the question of whether individual socioeconomic status may be a marker for exposure to conditions in the social environment. This would point to different mechanisms. Although individual income or education may be difficult to modify through intervention or policy, many of the components of the NPH scale represent neighborhood features that may be amenable to modification (i.e., crime, public safety, housing conditions).
Strengths of the current study include the availability of an extensive neuropsychological test battery and study subjects who were randomly selected from an urban population of adults aged 50–70 years, with both African Americans and whites and with diversity by socioeconomic status. We studied established neighborhoods rather than administrative proxies (census tracts or zip codes). We made use of a well-validated biomarker of lifetime cumulative lead dose, an approach not previously available in population studies. Finally, multilevel regression models were used to account for the nesting of persons within neighborhoods.
We previously reported that tibia lead was associated with worse cognitive function (10), higher blood pressure, and hypertension risk (43) in this population of older adults. In the former report, blood lead was not associated with cognitive function; this supports our a priori hypothesis that lifetime cumulative lead dose, as estimated by tibia lead levels, is a better predictor of cognitive function in later life than a measure of recent lead dose such as blood lead levels. In both papers, we reported sharp attenuation of tibia lead associations after adjustment for race/ethnicity. As discussed in Martin et al. (43), this attenuation could be due to the presence of unmeasured effect modifiers linked to race/ethnicity. The current findings support this thinking; because African Americans are more likely to live in neighborhoods with higher levels of psychosocial hazards, the main effects of lead and race/ethnicity cannot be estimated separately without introducing bias. In the present analysis, adjustment for race/ethnicity did not attenuate the association with tibia lead, presumably because we had accounted for the presence of a source of previously unmeasured effect modification (43). This suggests that researchers must consider the possibility of heterogeneity of neurotoxicant effects across racial/ethnic groups exposed to different kinds of social environments (36). Although we also measured lead in blood and in the patella (trabecular bone), we focused only on tibia lead in this report for several reasons. A paper on predictors of tibia bone lead and patella bone lead has been completed (44). First, we had previously documented strong and consistent adverse main effects of tibia lead with cognitive function (10). Our previous work has shown that, as expected, the main effects of blood and patella lead were considerably weaker than those of tibia lead. Second, our a priori hypotheses were about lifetime cumulative lead dose and interaction with neighborhood psychosocial hazards. Lifetime cumulative lead dose is best estimated by tibia lead. Third, trabecular bone lead is thought to estimate bioavailable lead stores, about which we did not have a priori hypotheses.
Are neighborhood psychosocial hazards stressful? Despite considerable speculation about associations between neighborhood conditions and hypothalamic-pituitary-adrenal axis dysregulation, there is only 1 report that supports this view (45). Our study did not directly examine the associations between neighborhood psychosocial hazards and a panel of stress biomarkers, although analyses with 1 biomarker (salivary cortisol) are currently ongoing. Therefore, our explanation of the findings in terms of an environmental stress hypothesis remains a matter of speculation. However, evidence of associations between environmental factors and stress disorders can be found in studies of exposure to community violence (46–50), terrorism (51–54), and disasters (55–58).
One implication of this research is the possibility that the social costs of past environmental lead exposure may be underestimated for those persons living in neighborhoods high in psychosocial hazards. If living in conditions of deprivation exacerbates the deleterious consequences of neurotoxicants such as lead, previous studies may have failed to identify a potential latent epidemic of cognitive impairment among inner-city residents. Moreover, despite gains in lowering lead exposure, the long-term legacy of past exposure may be a hidden threat for several decades to come.
In conclusion, these results suggest that the adverse association of tibia lead with cognitive function is exacerbated by environmental stress in some but not all domains of cognition. Although we make no causal claims, these results are among the first to show evidence of an association that is consistent with experimental studies in animals. The picture that emerges is biologically plausible. Theoretically, we believe that residence in neighborhoods that are characterized by greater psychosocial hazards may act as a risk regulator that modifies the toxicity of this ubiquitous neurotoxicant (59). If supported by further studies, the simultaneous occurrence of high cumulative lead dose and psychosocial vulnerability may be a future key to understanding the substantial disparities that exist in cognitive functioning with age across strata of social advantage.
Acknowledgments
Author affiliations: Department of Epidemiology, Johns Hopkins Bloomberg School of Public Health, Baltimore, Maryland (Thomas A. Glass, Matthew McAtee, Brian S. Schwartz); Department of Biostatistics, Johns Hopkins Bloomberg School of Public Health, Baltimore, Maryland (Karen Bandeen-Roche); Department of Environmental Health Sciences, Johns Hopkins Bloomberg School of Public Health, Baltimore, Maryland (Karen Bolla, Brian S. Schwartz); Department of Medicine, Johns Hopkins Medical Institutions, Baltimore, Maryland (Brian S. Schwartz); Department of Neurology, Johns Hopkins Medical Institutions, Baltimore, Maryland (Karen Bolla); and Department of Community and Preventive Medicine, Mount Sinai School of Medicine, New York, New York (Andrew C. Todd).
This work was supported by the National Institutes of Health (grant AG 19604).
Conflict of interest: none declared.
Glossary
Abbreviation
- NPH
neighborhood psychosocial hazards
References
- 1.Pirkle JL, Kaufmann RB, Brody DJ, et al. Exposure of the U.S. population to lead, 1991–1994. Environ Health Perspect. 1998;106(11):745–750. doi: 10.1289/ehp.98106745. [DOI] [PMC free article] [PubMed] [Google Scholar]
- 2.Pirkle JL, Brody DJ, Gunter EW, et al. The decline in blood lead levels in the United States. The National Health and Nutrition Examination Surveys (NHANES) JAMA. 1994;272(4):284–291. [PubMed] [Google Scholar]
- 3.Brody DJ, Pirkle JL, Kramer RA, et al. Blood lead levels in the US population. Phase 1 of the Third National Health and Nutrition Examination Survey (NHANES III, 1988 to 1991) JAMA. 1994;272(4):277–283. doi: 10.1001/jama.272.4.277. [DOI] [PubMed] [Google Scholar]
- 4.Annest JL, Pirkle JL, Makuc D, et al. Chronological trend in blood lead levels between 1976 and 1980. N Engl J Med. 1983;308(23):1373–1377. doi: 10.1056/NEJM198306093082301. [DOI] [PubMed] [Google Scholar]
- 5.Wright RO, Tsaih SW, Schwartz J, et al. Lead exposure biomarkers and mini-mental status exam scores in older men. Epidemiology. 2003;14(6):713–718. doi: 10.1097/01.EDE.0000081988.85964.db. [DOI] [PubMed] [Google Scholar]
- 6.Payton M, Riggs KM, Spiro A, III, et al. Relations of bone and blood lead to cognitive function: the VA Normative Aging Study. Neurotoxicol Teratol. 1998;20(1):19–27. doi: 10.1016/s0892-0362(97)00075-5. [DOI] [PubMed] [Google Scholar]
- 7.Stokes L, Letz R, Gerr F, et al. Neurotoxicity in young adults 20 years after childhood exposure to lead: the Bunker Hill experience. Occup Environ Med. 1998;55(8):507–516. doi: 10.1136/oem.55.8.507. [DOI] [PMC free article] [PubMed] [Google Scholar]
- 8.Weisskopf MG, Wright RO, Schwartz J, et al. Cumulative lead exposure and prospective change in cognition among elderly men: the VA Normative Aging Study. Am J Epidemiol. 2004;160(12):1184–1193. doi: 10.1093/aje/kwh333. [DOI] [PubMed] [Google Scholar]
- 9.Shih RA, Hu H, Weisskopf MG, et al. Cumulative lead dose and cognitive function in adults: a review of studies that measured both blood lead and bone lead. Environ Health Perspect. 2007;115(3):483–492. doi: 10.1289/ehp.9786. [DOI] [PMC free article] [PubMed] [Google Scholar]
- 10.Shih RA, Glass TA, Bandeen-Roche K, et al. Environmental lead exposure and cognitive function in community-dwelling older adults. Neurology. 2006;67(9):1556–1562. doi: 10.1212/01.wnl.0000239836.26142.c5. [DOI] [PubMed] [Google Scholar]
- 11.Virgolini MB, Bauter MR, Weston DD, et al. Permanent alterations in stress responsivity in female offspring subjected to combined maternal lead exposure and/or stress. Neurotoxicology. 2006;27(1):11–21. doi: 10.1016/j.neuro.2005.05.012. [DOI] [PubMed] [Google Scholar]
- 12.Virgolini MB, Chen K, Weston DD, et al. Interactions of chronic lead exposure and intermittent stress: consequences for brain catecholamine systems and associated behaviors and HPA axis function. Toxicol Sci. 2005;87(2):469–482. doi: 10.1093/toxsci/kfi269. [DOI] [PubMed] [Google Scholar]
- 13.Cory-Slechta DA, Virgolini MB, Thiruchelvam M, et al. Maternal stress modulates the effects of developmental lead exposure. Environ Health Perspect. 2004;112(6):717–730. doi: 10.1289/ehp.6481. [DOI] [PMC free article] [PubMed] [Google Scholar]
- 14.Gump BB, Stewart P, Reihman J, et al. Prenatal and early childhood blood lead levels and cardiovascular functioning in 9(1/2) year old children. Neurotoxicol Teratol. 2005;27(4):655–665. doi: 10.1016/j.ntt.2005.04.002. [DOI] [PubMed] [Google Scholar]
- 15.Glass TA, Rasmussen MD, Schwartz BS. Neighborhoods and obesity in older adults: the Baltimore Memory Study. Am J Prev Med. 2006;31(6):455–463. doi: 10.1016/j.amepre.2006.07.028. [DOI] [PMC free article] [PubMed] [Google Scholar]
- 16.Ross CE, Mirowsky J, Pribesh S. Powerlessness and the amplification of threat: neighborhood disadvantage, disorder, and mistrust. Am Sociol Rev. 2001;66(4):568–591. [Google Scholar]
- 17.Weiss B, Bellinger DC. Social ecology of children's vulnerability to environmental pollutants. Environ Health Perspect. 2006;114(10):1479–1485. doi: 10.1289/ehp.9101. [DOI] [PMC free article] [PubMed] [Google Scholar]
- 18.Schafer JH, Glass TA, Bolla KI, et al. Homocysteine and cognitive function in a population-based study of older adults. J Am Geriatr Soc. 2005;53(3):381–388. doi: 10.1111/j.1532-5415.2005.53153.x. [DOI] [PubMed] [Google Scholar]
- 19.Schwartz BS, Glass TA, Bolla KI, et al. Disparities in cognitive functioning by race/ethnicity in the Baltimore Memory Study. Environ Health Perspect. 2004;112(3):314–320. doi: 10.1289/ehp.6727. [DOI] [PMC free article] [PubMed] [Google Scholar]
- 20.Weil M, Bressler J, Parsons P, et al. Blood mercury levels and neurobehavioral function. JAMA. 2005;293(15):1875–1882. doi: 10.1001/jama.293.15.1875. [DOI] [PubMed] [Google Scholar]
- 21.Todd AC. L-shell x-ray fluorescence measurements of lead in bone: theoretical considerations. Phys Med Biol. 2002;47(3):491–505. doi: 10.1088/0031-9155/47/3/310. [DOI] [PubMed] [Google Scholar]
- 22.Todd AC. L-shell x-ray fluorescence measurements of lead in bone: system development. Phys Med Biol. 2002;47(3):507–522. doi: 10.1088/0031-9155/47/3/311. [DOI] [PubMed] [Google Scholar]
- 23.Todd AC, Parsons PJ, Carroll S, et al. Measurements of lead in human tibiae. A comparison between K-shell x-ray fluorescence and electrothermal atomic absorption spectrometry. Phys Med Biol. 2002;47(4):673–687. doi: 10.1088/0031-9155/47/4/309. [DOI] [PubMed] [Google Scholar]
- 24.Taylor SE, Repetti RL, Seeman T. Health psychology: what is an unhealthy environment and how does it get under the skin? Annu Rev Psychol. 1997;48:411–447. doi: 10.1146/annurev.psych.48.1.411. [DOI] [PubMed] [Google Scholar]
- 25.Augustin T, Glass TA, James BD, et al. Neighborhood psychosocial hazards and cardiovascular disease: the Baltimore Memory Study. Am J Public Health. 2008;98(9):1664–1670. doi: 10.2105/AJPH.2007.125138. [DOI] [PMC free article] [PubMed] [Google Scholar]
- 26.Ross CE, Mirowsky J. Neighborhood disadvantage, disorder, and health. J Health Soc Behav. 2001;42(3):258–276. [PubMed] [Google Scholar]
- 27.Raudenbush SW, Bryk AS. Hierarchical Linear Models: Applications and Data Analysis Methods. Thousand Oaks, CA: Sage Publications; 2002. [Google Scholar]
- 28.LaVeist TA. Disentangling race and socioeconomic status: a key to understanding health inequalities. J Urban Health. 2005;82(2 suppl. 3):iii26–iii34. doi: 10.1093/jurban/jti061. [DOI] [PMC free article] [PubMed] [Google Scholar]
- 29.Krieger N, Chen JT, Waterman PD, et al. Painting a truer picture of US socioeconomic and racial/ethnic health inequalities: the Public Health Disparities Geocoding Project. Am J Public Health. 2005;95(2):312–323. doi: 10.2105/AJPH.2003.032482. [DOI] [PMC free article] [PubMed] [Google Scholar]
- 30.Bushnell PJ, Shelton SE, Bowman RE. Elevation of blood lead concentration by confinement in the rhesus monkey. Bull Environ Contam Toxicol. 1979;22(6):819–826. doi: 10.1007/BF02027031. [DOI] [PubMed] [Google Scholar]
- 31.Lupien SJ, de Leon M, de Santi S, et al. Cortisol levels during human aging predict hippocampal atrophy and memory deficits. Nat Neurosci. 1998;1(1):69–73. doi: 10.1038/271. [DOI] [PubMed] [Google Scholar]
- 32.Lupien SJ, Fiocco A, Wan N, et al. Stress hormones and human memory function across the lifespan. Psychoneuroendocrinology. 2005;30(3):225–242. doi: 10.1016/j.psyneuen.2004.08.003. [DOI] [PubMed] [Google Scholar]
- 33.Lupien SJ, Lepage M. Stress, memory, and the hippocampus: can't live with it, can't live without it. Behav Brain Res. 2001;127(1-2):137–158. doi: 10.1016/s0166-4328(01)00361-8. [DOI] [PubMed] [Google Scholar]
- 34.Bowirrat A, Oscar-Berman M. Relationship between dopaminergic neurotransmission, alcoholism, and reward deficiency syndrome. Am J Med Genet B Neuropsychiatr Genet. 2005;132(1):29–37. doi: 10.1002/ajmg.b.30080. [DOI] [PubMed] [Google Scholar]
- 35.Selye H, Somogyi A, Végh P. Inflammation, topical stress and the concept of pluricausal diseases. Biochem Pharmacol. 1968;17(suppl):107–122. doi: 10.1016/0006-2952(68)90298-0. [DOI] [PubMed] [Google Scholar]
- 36.Bellinger DC. Effect modification in epidemiologic studies of low-level neurotoxicant exposures and health outcomes. Neurotoxicol Teratol. 2000;22(1):133–140. doi: 10.1016/s0892-0362(99)00053-7. [DOI] [PubMed] [Google Scholar]
- 37.Bellinger DC. Assessing environmental neurotoxicant exposures and child neurobehavior: confounded by confounding? Epidemiology. 2004;15(4):383–384. doi: 10.1097/01.ede.0000129525.15064.a4. [DOI] [PubMed] [Google Scholar]
- 38.Winneke G, Kraemer U. Neuropsychological effects of lead in children: interactions with social background variables. Neuropsychobiology. 1984;11(3):195–202. doi: 10.1159/000118077. [DOI] [PubMed] [Google Scholar]
- 39.Bellinger D, Leviton A, Waternaux C, et al. Low-level lead exposure, social class, and infant development. Neurotoxicol Teratol. 1988;10(6):497–503. doi: 10.1016/0892-0362(88)90084-0. [DOI] [PubMed] [Google Scholar]
- 40.McMichael AJ, Baghurst PA, Vimpani GV, et al. Sociodemographic factors modifying the effect of environmental lead on neuropsychological development in early childhood. Neurotoxicol Teratol. 1992;14(5):321–327. doi: 10.1016/0892-0362(92)90038-c. [DOI] [PubMed] [Google Scholar]
- 41.Tong S, McMichael AJ, Baghurst PA. Interactions between environmental lead exposure and sociodemographic factors on cognitive development. Arch Environ Health. 2000;55(5):330–335. doi: 10.1080/00039890009604025. [DOI] [PubMed] [Google Scholar]
- 42.Dietrich KN, Succop PA, Berger OG, et al. Lead exposure and the cognitive development of urban preschool children: the Cincinnati Lead Study cohort at age 4 years. Neurotoxicol Teratol. 1991;13(2):203–211. doi: 10.1016/0892-0362(91)90012-l. [DOI] [PubMed] [Google Scholar]
- 43.Martin D, Glass TA, Bandeen-Roche K, et al. Association of blood lead and tibia lead with blood pressure and hypertension in a community sample of older adults. Am J Epidemiol. 2006;163(5):467–478. doi: 10.1093/aje/kwj060. [DOI] [PubMed] [Google Scholar]
- 44.Theppeang K, Glass TA, Bandeen-Roche K, et al. Gender and race/ethnicity differences in lead dose biomarkers. Am J Public Health. 2008;98(7):1248–1255. doi: 10.2105/AJPH.2007.118505. [DOI] [PMC free article] [PubMed] [Google Scholar]
- 45.Enwonwu CO, Phillips RS, Savage KO. Inflammatory cytokine profile and circulating cortisol levels in malnourished children with necrotizing ulcerative gingivitis. Eur Cytokine Netw. 2005;16(3):240–248. [PubMed] [Google Scholar]
- 46.Bailey BN, Delaney-Black V, Hannigan JH, et al. Somatic complaints in children and community violence exposure. J Dev Behav Pediatr. 2005;26(5):341–348. doi: 10.1097/00004703-200510000-00001. [DOI] [PubMed] [Google Scholar]
- 47.Rosenthal BS. Exposure to community violence in adolescence: trauma symptoms. Adolescence. 2000;35(138):271–284. [PubMed] [Google Scholar]
- 48.Buka SL, Stichick TL, Birdthistle I, et al. Youth exposure to violence: prevalence, risks, and consequences. Am J Orthopsychiatry. 2001;71(3):298–310. doi: 10.1037/0002-9432.71.3.298. [DOI] [PubMed] [Google Scholar]
- 49.Ewart CK, Suchday S. Discovering how urban poverty and violence affect health: development and validation of a Neighborhood Stress Index. Health Psychol. 2002;21(3):254–262. doi: 10.1037//0278-6133.21.3.254. [DOI] [PubMed] [Google Scholar]
- 50.Fitzpatrick KM. Exposure to violence and presence of depression among low-income, African-American youth. J Consult Clin Psychol. 1993;61(3):528–531. doi: 10.1037//0022-006x.61.3.528. [DOI] [PubMed] [Google Scholar]
- 51.Gump BB, Reihman J, Stewart P, et al. Terrorism and cardiovascular responses to acute stress in children. Health Psychol. 2005;24(6):594–600. doi: 10.1037/0278-6133.24.6.594. [DOI] [PubMed] [Google Scholar]
- 52.Thabet AA, Abed Y, Vostanis P. Effect of trauma on the mental health of Palestinian children and mothers in the Gaza Strip. East Mediterr Health J. 2001;7(3):413–421. [PubMed] [Google Scholar]
- 53.Heim C, Bierl C, Nisenbaum R, et al. Regional prevalence of fatiguing illnesses in the United States before and after the terrorist attacks of September 11, 2001. Psychosom Med. 2004;66(5):672–678. doi: 10.1097/01.psy.0000138116.12495.a2. [DOI] [PubMed] [Google Scholar]
- 54.Kaplan Z, Matar MA, Kamin R, et al. Stress-related responses after 3 years of exposure to terror in Israel: are ideological-religious factors associated with resilience? J Clin Psychiatry. 2005;66(9):1146–1154. doi: 10.4088/jcp.v66n0910. [DOI] [PubMed] [Google Scholar]
- 55.Bromet E, Dew MA. Review of psychiatric epidemiologic research on disasters. Epidemiol Rev. 1995;17(1):113–119. doi: 10.1093/oxfordjournals.epirev.a036166. [DOI] [PubMed] [Google Scholar]
- 56.Godeau E, Vignes C, Navarro F, et al. Effects of a large-scale industrial disaster on rates of symptoms consistent with posttraumatic stress disorders among schoolchildren in Toulouse. Arch Pediatr Adolesc Med. 2005;159(6):579–584. doi: 10.1001/archpedi.159.6.579. [DOI] [PubMed] [Google Scholar]
- 57.Galea S, Vlahov D, Resnick H, et al. An investigation of the psychological effects of the September 11, 2001, attacks on New York City: developing and implementing research in the acute postdisaster period. CNS Spectr. 2002;7(8):585–587. doi: 10.1017/s1092852900018198. [DOI] [PubMed] [Google Scholar]
- 58.Leor J, Kloner RA. The Northridge earthquake as a trigger for acute myocardial infarction. Am J Cardiol. 1996;77(14):1230–1232. doi: 10.1016/s0002-9149(96)00169-5. [DOI] [PubMed] [Google Scholar]
- 59.Glass TA, McAtee MJ. Behavioral science at the crossroads in public health: extending horizons, envisioning the future. Soc Sci Med. 2006;62(7):1650–1671. doi: 10.1016/j.socscimed.2005.08.044. [DOI] [PubMed] [Google Scholar]


