

Abstract
Despite their enormous diversity and abundance, all currently known eukaryotic DNA transposons belong to only 15 superfamilies. Here, we report two new superfamilies of DNA transposons, named Sola and Zator. Sola transposons encode DDD-transposases (transposase, TPase) and are flanked by 4-bp target site duplications (TSD). Elements from the Sola superfamily are distributed in a variety of species including bacteria, protists, plants, and metazoans. They can be divided into three distinct groups of elements named Sola1, Sola2, and Sola3. The elements from each group have extremely low sequence identity to each other, different termini, and different target site preferences. However, all three groups belong to a single superfamily based on significant PSI-Blast identities between their TPases. The DDD TPase sequences encoded by Sola transposons are not similar to any known TPases. The second superfamily named Zator is characterized by 3-bp TSD. The Zator superfamily is relatively rare in eukaryotic species, and it evolved from a bacterial transposon encoding a TPase belonging to the “transposase 36” family (Pfam07592). These transposons are named TP36 elements (abbreviated from transposase 36).
Keywords: DNA transposon, Sola, Zator, TP36, transposase
Introduction
Mobile genetic elements, also known as transposable elements (TEs), are relatively short DNA segments that replicate and move from one genomic locus to another in a process known as transposition. There are two basic types of TEs: retrotransposons and DNA transposons. DNA transposons comprise three major classes: “cut-and-paste” DNA transposons, rolling-circle DNA transposons (Helitrons), and self-synthesizing DNA transposons (Polintons) (Kapitonov and Jurka 2008). Most of the identified eukaryotic DNA transposons belong to the class of cut-and-paste DNA transposons, currently represented by only 15 superfamilies (Kapitonov and Jurka 2008). Each superfamily is characterized by a superfamily-specific transposase (transposase, TPase) core, which is not similar to those from other superfamilies. The TPase encoded by cut-and-paste DNA transposons are also called DDE/DDD TPases, due to the universal occurrence of three conserved acidic catalytic residues: two aspartates (D) and one glutamate (E), or three aspartates (DDD). The catalytic residues are part of a retroviral integrase-like fold, where they are closely positioned (Dyda et al. 1994; Rice and Baker 2001; Hickman et al. 2005). Upon insertion, transposons usually produce target site duplications (TSD), with lengths that are relatively well conserved among superfamily members (Kapitonov and Jurka 2008). Transposons usually contain terminal inverted repeats (TIRs), which are recognized by the DNA-binding domains of TPases (Smit and Riggs 1996; Chandler and Mahillon 2002).
In this paper, we report two new DNA transposon superfamilies: Sola (from Latin: alone, single, unique) and Zator (named after the Duchy of Zator split from an older entity in Medieval Europe). Sola elements encode DDD-type TPases and are divided into three highly diverged groups named Sola1, Sola2, and Sola3. Autonomous Zator transposons encode TPases distantly similar to Tc1/Mariner/IS630 superfamily TPases, but phylogenetic analysis suggests that Zators can be considered as a distinct superfamily of eukaryotic transposons evolved from a bacterial TP36-like transposon rather than from one of IS630 bacterial transposons ancestral to Mariners.
Materials and Methods
New transposon sequences were identified by systematic screening of the Hydra magnipapillata genome as a part of the development of Repbase (Jurka et al. 2005) at the Genetic Information Research Institute. Assembled H. magnipapillata genome sequences were downloaded from the National Center for Biotechnology Information (NCBI) and screened for multicopy sequences using approaches similar to those described previously (Bao and Eddy 2002). The resulting sequences were screened for the presence of TIRs to identify potential DNA transposons. Potential similarity between newly identified TPases and known proteins were checked by local PSI-Blast (Altschul et al. 1997) with the protein database of the nonredundant GenBank proteins (NR) combined with all TPases stored in Repbase. Multiple protein sequence alignments were carried out using the T-Coffee method locally or on a web server (Notredame et al. 2000). Sequence alignments were edited and illustrated with BioEdit (Hall 1999). Logo representation of the TSD sequence was created by the WebLogo (Crooks et al. 2004) server at http://weblogo.berkeley.edu/logo.cgi/. The copy number of each transposon family was estimated based on the Blast result of the various genome sequences, using consensus sequences of individual transposon families as queries. The transposon sequences reported in his paper are deposited in Repbase.
The phylogenetic tree of TPases was constructed based on the protein alignment in the central DDD/DDE region, using Neighbor-Joining method and minimum evolution method (p-distance model, pairwise deletion, 1,000 bootstrap replicates) implemented in the MEGA4 software (Tamura et al. 2007). For the phylogenetic analysis of Zator, TP36, IS630, Tc1, Mariner, and Pogo groups, highly divergent TPase sequences were collected to cover the great intergroup and intragroup sequence variability, including 1) canonical sequences from each group, selected either from Repbase or other sources (Shao and Tu 2001); 2) randomly chosen sequences from NCBI, 30–60% identical to the canonical sequences; 3) for each group, an additional five sequences from other groups that were the best BlastP and PSI-Blast matches to it.
Results
Identification of the Major Groups of the Sola Superfamily
During the screening of the H. magnapapilata genome, we identified three new types of DNA transposons flanked by 4-bp TSD (supplementary fig. S1A, Supplementary Material online). These transposons contain TIRs and encode TPases that are significantly different from any other known TPases (PSI-Blast E-value > 0.01). Subsequently, more transposon sequences homologous to the original three types were found in other species and were collected in three groups named Sola1, Sola2, and Sola3 elements (tables 1–3; the three groups belong to the same superfamily, see below). The completeness of transposons was verified by the existence of TIRs and TSDs at both ends, followed by multiple sequence alignment to well-studied examples; incomplete sequences were not included in comparative analyses. In several cases, the transposons were inserted into other repetitive sequences and the preinsertion and postinsertion sequence could be determined in detail.
Table 1.
Sola1 Sequences in Diverse Genomes
| Species | Family Name | Representative Accession No. | Coordinates | Element Length (bp) | TIR Length (bp) | TPase Length (aa) | Approximate Copy Number Per Haploid Genome |
| Acyrthosiphon pisum | Sola1-1_AP | AC202225.3 | 9,499–4,777 | 4,723 | 36 | 581 | 1 |
| Sola1-2_AP | AC202215.4 | 6,161–10,972 | 4,812 | 32 | 697 | 1 | |
| Aedes aegypti | Sola1-1_AA | AAGE02012735.1 | 131,791–135,075 | 3,285 | 36 | 614 | 4 |
| Sola1-2_AA | AAGE02003977.1 | 18,829–21,741 | 2,912 | 31 | 694a | 4 | |
| Aplysia californica | Sola1-1_AC | AASC01129179.1 | 6,845–2,749 | 4,097 | 26 | 686 | 25 |
| Bacillus selenitireducens | Sola1-1_BSe | ABHZ01000025.1 | 181–3,248 (partial) | — | — | 1,022a | — |
| Beggiatoa sp. PS | Sola1-1_BPs | ABBZ01000008.1 | 9,958–12,045 | 2,088 | 35 | 634a | 1 |
| Sola1-2_BPs | ABBZ01001030.1 | 7–2,070 | 2,064 | 35 | 613a | 1 | |
| Bombyx mori | Sola1-1_BM | BAAB01062465.1 | 7,337–3,598 | 3,740 | 35 | 650a | 1 |
| Capitella capitata | Sola1-1_CC | AC158486.2 | 19,276–13,018 | 6,259 | 29 | 552a | 1 |
| Ciona intestinalis | Sola1-1_CI | AABS01000302.1 | 73,197–71,689 (partial) | — | — | — | — |
| Ciona savignyi | Sola1-1_CS | AACT01041147.1 | 43,246–39,967 | 3,315 | 45 | — | 3 |
| Culex pipiens | Sola1-1_CP | AAWU01020699.1 | 43,567–46,377 | 2,811 | 32 | 592a | 3 |
| Danio rerio | — | CAAK04054883.1 | 21,366–20,770 (partial) | — | — | — | — |
| Drosophila willistoni | Sola1-1_DW | AAQB01010763.1 | 12,216–93,18 | 2,899 | 30 | 512a | 2 |
| Hydra magnipapillata | Sola1-1_HM | ABRM01021920.1 | 1,917–5,396 | 3,479 | 51 | 637a | 100 |
| Sola1-2_HM | ABRM01008493.1 | 24,074–20,608 | 3,460 | 36 | 731 | 20 | |
| Sola1-3_HM | ABRM01029985.1 | 3,793–616 | 3,185 | 36 | 699 | 35 | |
| Sola1-4_HM | ABRM01040714.1 | 4,466–7,789 | 3,278 | 62 | 592 | 40 | |
| Sola1-5_HM | ABRM01031963.1 | 5,055–8,958 | 3,914 | 31 | 590a | 23 | |
| Ixodes scapularis | — | ABJB010584993.1 | 22–651 (partial) | — | — | — | — |
| Jakoba bahamiensis | — | EC687580.1 | 2–715 (partial) | — | — | — | — |
| — | EC685863.1 | 1–606 (partial) | — | — | — | — | |
| Monosiga brevicollis | Sola1-1_MB | ABFJ01001366.1 | 38,668–41025 | 2,358 | 40 | 652a | 1 |
| Sola1-2_MB | ABFJ01000130.1 | 45,539–44,112 (partial) | — | — | — | — | |
| Nasonia vitripennis | Sola1-1_NVi | AAZX01003733.1 | 12,224–11,457 (partial) | — | — | — | — |
| Nematostella vectensis | Sola1-1_NV | ABAV01012191.1 | 249–8,919 | 8,671 | 43 | — | 2 |
| Physcomitrella patens | Sola1-1_PP | ABEU01007013.1 | 29,546–45,209 | 15,665 | 29 | 958 | 17 |
| Phytophthora infestans | Sola1-1_PI | AATU01005989.1 | 53,781–50,846 | 2,936 | 34 | 791a | 8 |
| Phytophthora ramorum | Sola1-1_PR | AAQX01002811.1 | 6,803–4,030 | 2,769 | 50 | 733a | 4 |
| Phytophthora sojae | Sola1-1_PS | AAQY01000636.1 | 9,636–12,659 | 3,053 | 34 | 815a | 7 |
| Schmidtea mediterranea | — | NZ_AAWT01089611 | 21,764–22,111 (partial) | — | — | — | — |
| Strongylocentrotus purpuratus | Sola1-1_SP | AAGJ02023219.1 | 322–10,610 | 10,289 | 30 | 737 | 2 |
| Sola1-2_SP | AAGJ02131127.1 | 13,578–3,550 | 10,029 | 30 | 800a | 1 |
Protein sequences are predicted: missing the start codon, containing stop codons or small indels, or frame being shifted.
Table 2.
Sola2 Sequences in Diverse Genomes
| Species | Family Name | Representative Accession No. | Coordinates | Element Length | TIR Length (bp) | TPase Length (aa) | Approximate Copy Number Per Haploid Genome |
| Aedes aegypti | Sola2-1_AA | AAGE02017157.1 | 132,100–136,253 | 4,156 | 613a | 712 | 1,300 |
| Sola2-2_AA | AAGE02007824.1 | 159,590–154,594 | 5,000 | 913 | 719 | 200 | |
| Sola2-3_AA | AAGE02013973.1 | 36,685–32,278 | 4,092 | 706 | 738b | 60 | |
| Sola2-4_AA | AAGE02004478.1 | 104,193–108,427 | 4,125 | 687c | 734 | 14 | |
| Aplysia californica | Sola2-1_AC | AASC01164156.1 | 3,607–15,726 | 12,120 | 26 | 794b | 2 |
| Bombyx mori | — | AADK01017824.1 | 5,199–6,950 (partial) | — | — | — | — |
| Branchiostoma floridae | Sola2-1_BF | ABEP01022831.1 | 20,655–16,136 | 4,520 | 29 | 675b | 2 |
| Ciona savignyi | Sola2-1_CS | AACT01010650.1 | 1,562–6,091 | 4,530 | 576 | 855b | 2 |
| Danio rerio | — | BX908760.8 | 112,531–111,017 (partial) | — | — | — | — |
| Drosophila ananassae | Sola2-1_DA | AAPP01016035.1 | 70,196–67,312 | 2,885 | 30 | 571 | 4 |
| Drosophila willistoni | Sola2-1_DW | AAQB01007049.1 | 10,416–6,328d | 4,089 | 12 | 631b | 1 |
| Hydra magnipapillata | Sola2-1_HM | ABRM01013467.1 | 12,934–17,278 | 4,423 | 614 | 749 | 70 |
| Sola2-2_HM | ABRM01005111.1 | 27,859–22,574 | 5,293 | 933 | 781b | 50 | |
| Sola2-3_HM | ABRM01001367.1 | 32,901–29,730 | 3,224 | 17 | 541 | 30 | |
| Ixodes scapularis | Sola2-1_IS | ABJB010264818.1 | 13,043–7,980 | 5,064 | 712 | 643b | 4 |
| Sola2-2_IS | ABJB010053822.1 | 7,164–12,644 | 5,481 | 900 | 668 | 6 | |
| Naegleria gruberi | — | FE233608 | 1–821 (partial) | — | — | — | — |
| Nasonia vitripennis | Sola2-1_NVi | AAZX01023302.1 | 4,265–135 | 4,122 | 567 | 646b | 2 |
| Sola2-2_NVi | AAZX01023427.1 | 129–4,320 | 4,375 | 550 | 839 | 5 | |
| Nematostella vectensis | Sola2-1_NV | ABAV01019796.1 | 8,640–12,971 | 4,332 | 710 | — | 2 |
| Sola2-2_NV | ABAV01003912.1 | 124,996–122,966 (partial) | — | — | — | 4 | |
| Prymnesium parvum | — | DV099040 | 1–804 (partial) | — | — | — | — |
| Strongylocentrotus purpuratus | Sola2-1_SP | AAGJ02024987.1 | 7,023–2,225 | 4,799 | 11 | 681 | 3 |
| Sola2-2_SP | AAGJ02009651.1 | 6,995–2,381 | 4,615 | 11 | 739 | 1 | |
| Xenopus tropicalis | — | AC148457.2 | 24,378–23,655 (partial) | — | — | — | — |
Positions 11–54 is mismatch.
Protein sequences are predicted: missing the start codon, or containing stop codons or small indels, or frame being shifted.
Positions 12–38 is mismatch.
Contains an insertion of another transposon sequences (10,353–9,093).
Table 3.
Sola3 Sequences in Diverse Genomes
| Species | Family Name | Representative Accession No. | Coordinates | Element Length | TIR Length (bp) | TPase Length (aa) | Approximate Copy Number Per Haploid Genome |
| Aedes aegypti | Sola3-1_AA | AAGE02019464.1 | 918–6,944 | 6,027 | 666 | 1,030a | 1 |
| Branchiostoma floridae | Sola3-1_BF | ABEP01036107.1 | 12,713–3,802 | 8,912 | 1,124 | 1,125b | 1 |
| Sola3-2_BF | ABEP01046127.1 | 30,459–22,390 | 8,070 | 915 | 1,124b | 1 | |
| Sola3-3_BF | ABEP01035506.1 | 24,150–17,680 | 6,989c | 869 | 1,168 | 1 | |
| Caenorhabditis brenneri | Sola3-1_CB | Join ABEG01016303.1 | 5,537–1 | 6,050 | 800 | 1,174a | 3 |
| ABEG01018644.1 | 8,601–9,113 | ||||||
| Sola3-2_CB | ABEG01019204.1 | 45,615–38,768 | 6,848 | 990 | 1,326a | 2 | |
| Caenorhabditis remanei | Sola3-1_CR | AAGD02001381.1 | 31,790–26,729 | 5,062 | 824 | 982a | 2 |
| Glomus intraradices | Sola3-1_GI | AC156586 | 29,125–30,427 (partial) | — | — | — | — |
| Hydra magnipapillata | Sola3-1_HM | ABRM01000905.1 | 37,629–32,381 | 5,258 | 660 | 917 | 15 |
| Sola3-2_HM | ABRM01016154.1 | 3,908–9,855 | 5,948 | 878 | 832 | 47 | |
| Sola3-3_HM | ABRM01011843.1 | 19,260–13,214 | 6,048 | 643 | 935 | 100 | |
| Sola3-4_HM | ABRM01020192.1 | 2,706–7,963 | 5,270 | 669 | 980 | 15 | |
| Nematostella vectensis | Sola3-1_NV | Join ABAV01005678.1 | 7,254–8,715 | 5,079 | 770 | 863d | 3 |
| ABAV01005679.1 | 1–3,603 | ||||||
| Sola3-2_NV | Join ABAV01021624.1 | 7340–14318 | 7,618 | 1,011 | 1,166d | 1 | |
| ABAV01048567.1 | 5,800–6,421 | ||||||
| Sola3-3_NVe | ABAV01028097.1 | 57,661–53,079 | 4,599 | 665 | - | 8 | |
| Phytophthora sojae | Sola3-1_PS | AAQY01001585.1 | 19,300–13,540 | 5,773 | 47 | 1,238 | 3 |
| Sola3-2_PS | AAQY01000636.1 | join 40,639– 35,030, 32,781–31,120 | 7,271 | 18 | 904a | 1 | |
| Sola3-3_PS | AAQY01000635.1 | 41,400–35,358 | 6,043 | 33 | 1,215a | 1 |
Protein sequences are predicted: missing the start codon, or containing stop codons or small indels, or frame being shifted.
Predicted, containing four exons
The left TIR is incomplete, the element length and TIRs length are predicted.
Predicted based on XP_001625534, containing exons.
Sola3-3_NV is nonautonomous and is identical to previously identified unclassified repeat family, NVREP5, in Nematostella vectensis (Putnam et al. 2007).
Sola1 Elements
Sola1 elements belong to the most widespread group of the Sola superfamily (fig. 1A, table 1). Complete or partial Sola1 sequences were identified in two bacterial species, Beggiatoa sp. (PS data set) and Bacillus selenitireducens. In Beggiatoa sp. PS, two different full-length Sola1 elements have been identified, and one of them, Sola1-1_BPs, is identified in a 13.6-kb long sequence contig (ABBZ01000008). Sola1 transposons were also found in protist species belonging to two major groups: Excavata (Jakoba bahamiensis) and Chromalveolate (Phytophthora infestans, Phytophthora ramorum, and Phytophthora sojae). In choanoflagellate, the closest living relatives of the animals, Sola1 sequences were found in Monosiga brevicollis. Sola1 elements are also present in one plant species, moss (Physcomitrella patens). In metazoans, Sola1 elements are present in animals with radial symmetry: starlet sea anemone (Nematostella vectensis) and Hydra (H. magnipapillata). In bilaterally symmetrical animals, Sola1 sequences were found in diverse species including sea urchin (Strongylocentrotus purpuratus), tunicate (Ciona savignyi, Ciona intestinalis), flatworm (Schmidtea mediterranea), polychaete worm (Capitella capitata), sea slug (Aplysia californica), deer tick (Ixodes scapularis), mosquito (Aedes aegypti, Culex pipiens), pea aphid (Acyrthosiphon pisum), wasp (Nasonia vitripennis), silkworm (Bombyx mori), fly (Drosophila willistoni), and zebrafish (Danio rerio). Sola1 has not yet been found in bird nor mammalian genomes.
FIG. 1.—

The species distribution of Sola elements (A) and the phylogenetic tree of the Sola TPases (B). The red, blue, and green colors represent Sola1, Sola2, and Sola3 groups, respectively. For those species, harboring more than two different Sola groups, their species names are decorated with the corresponding colors of Sola groups. The phylogenetic relationship of species is based on published literature (Pennisi 2003), and the taxonomic classification of protists is obtained from Adl et al. (2005). The phylogenetic tree was based on the alignment in the core region (from six amino acids upstream of the first catalytic D to ∼30 amino acids downstream of the last catalytic D residue), and was reconstructed by Neighbor-Joining method (shown here) and minimum evolution method (not shown). Tree reconstructed by the minimum evolution method showed a similar topology. The bootstrap values of each Sola group, derived from Neighbor-Joining and minimum evolution analysis, respectively, are shown in color. The two clades in Sola1 and one potential clade in Sola2 are shaded out, and their bootstrap values are shown in parentheses. The species and transposon families are listed in tables 1–3.
So far, all identified Sola1 transposons harbor short (∼30–60 bp) TIRs (table 1). The termini of Sola1 elements are not well conserved; the first position at the 5′-end usually begins with G or C nucleotides, but A is also present. Most Sola1 elements are ∼2–5 kb in length, with notable exceptions such as Sola1-1_SP (10.2 kb) and Sola1-2_SP (10 kb) in sea urchin, and the Sola1-1_PP (15.6 kb) in moss (table 1). Notably, in addition to the TPase gene (PHYPADRAFT_66669), Sola1-1_PP elements also contain another predicted gene (PHYPADRAFT_159308), which encodes a 1,786-aa NLI interacting factor-like phosphatase. Because Sola1-1_PP is the only Sola1 element containing a second gene, it is likely that the PHYPADRAFT_159308 gene is not necessary for the transposition and probably was captured by the transposon.
Sola2 Elements
Like Sola1, Sola2 elements are also widespread (fig. 1A, table 2), but they appear not to be present in prokaryotic organisms and plants. In metazoans, Sola2 sequences were found in hydra (H. magnipapillata), starlet sea anemone (N. vectensis), sea hare (A. californica), tunicate (C. savignyi), sea urchin (S. purpuratus), mosquito (A. aegypti), deer tick (I. scapularis), fly (Drosophila ananassae, D. willistoni), silkworm (B. mori), wasp (N. vitripennis), lancelet (Branchiostoma floridae), zebrafish (D. rerio), and clawed frog (Xenopus tropicalis). In addition, Sola2-like sequences were found in the expressed sequence tag database of two protists: Naegleria gruberi and Prymnesium parvum (table 2).
The lengths of TIRs from Sola2 elements range from very long (∼500–900 bp) to relatively short (∼10–30 bp), even in elements from the same species (table 2). However, all Sola2 elements contain 5′-GRG and CYC-3′ termini.
Sola3 Elements
Sola3 sequences were found in a limited number of species so far (fig. 1A, table 3). It has been found in protist (P. sojae), fungi (Glomus intraradices), and a few metazoan animals: hydra (H. magnipapillata), starlet sea anemone (N. vectensis), nematodes (Caenorhabditis brenneri, Caenorhabditis remanei), mosquito (A. aegypti), and lancelet (B. floridae).
Except for the three Sola3 elements in P. sojae, all other complete Sola3 elements have long TIRs (∼400–1,100 bp), and the termini of the TIRs are mostly 5′-GAG and CTC-3′. By contrast, the TIRs of the three Sola3 elements in P. sojae are short (∼20–40 bp), and the termini are 5′-CAG and CTG-3′ instead.
Target Preferences of Different Sola Groups
The Sola3 elements integrate specifically in TTAA target sites (supplementary fig. S1A, Supplementary Material online). We examined 121 insertion loci of four different Sola3 families: 20 Sola3-2_HM, 48 Sola3-3_HM, 34 Sola3-2_NV, and 19 Sola3-2_CB. Among them, 114 (94%) Sola3 insertions are flanked by TTAA TSDs; the other seven 4-bp TSDs differ from TTAA by only one base substitution. This demonstrates that Sola3 elements are highly specific to the TTAA target site. We also investigated the target preference for some members of the Sola1 and Sola2 groups. We analyzed target sites of two Sola1 families: Sola1-1_HM and Sola1-1_AA, and two Sola2 families: Sola2-1_HM and Sola2-1_AA. The reason for selection of these four families is that they are represented by relatively large numbers of copies in the host genomes, including the nonautonomous elements derived from them. As shown in figure 2, although all transposons from the four families target AT-rich tetranucleotides, the target preferences are different between Sola1 and Sola2. The two Sola1 families show a preference for the AWWT tetranucleotide: 79% of Sola1-1_AA (112 of 141) and 82% of Sola1-1_HM (124 of 152) elements target AWWT sites. In contrast, Sola2-1_HM and Sola2-1_AA elements seem to have no obvious pattern of target selection.
FIG. 2.—

The target preference of Sola1-1_AA, Sola1-1_HM, Sola2-1_AA, and Sola2-1_HM families. Positions 4–7 on the Logo sequence represent the 4-bp TSDs. Numbers of sequences used are shown in parentheses below the family name.
All Sola TPases Are DDD-TPases
To characterize the TPases of the Sola superfamily, especially their catalytic motifs, we multiple aligned all available TPase sequences from all the three groups. Some of the TPase sequences are affected by stop codons, minor indels, or absence of a translation initiation codon (tables 1–3). Nevertheless, among a few conserved motifs in multiple alignment of various Sola1 TPases, three universally conserved aspartic acids, D(362), D(440), and D(484), form the catalytic triad (supplementary fig. S2, Supplementary Material online; the numbering of the amino acid residues refers to the Sola1-1_HM TPase). In the Sola2 and Sola3 groups, the TPases are less divergent than in the Sola1 group (supplementary figs. S3 and S4, Supplementary Material online), and their multiple alignments also show three conserved aspartic acid residues. For the Sola2 group, the catalytic residues are D(473), D(557), and D(598) (supplementary fig. S3, Supplementary Material online; amino acid positions correspond to the Sola2-1_AA TPase). For Sola3 group, its catalytic triad is formed of D(480), D(563), and D(604) (supplementary fig. S4, Supplementary Material online; aa positions refer to the Sola3-1_HM TPase). In summary, the triad signatures (the triad residues and the distances between them) of the Sola1, Sola2, and Sola3 groups are very similar and can be represented by D-x(78–163)–D-x(40–45)–D, D-x(75–95)–D-x(38–41)–D, D-x(80–91)–D-x(40–56)–D, respectively. Phylogenetic analyses show that Sola1 TPases comprise two distinct clades (fig. 1B). Although the first clade contains Sola1 TPases from bacteria, protist, plant, choanoflagellate, and metazoans, the second clade is composed of the metazoan Sola1 TPases only (fig. 1). In contrast to the Sola3 group, Sola2 also contains potential clades, and it appears to be comparable in age with Sola1 (fig. 1B).
In addition to the conserved DDD core region, each TPase group also contains a number of other highly conserved, group-specific amino acids (supplementary figs. S2–S4, Supplementary Material online), such as the V(185) C in Sola1, F(318) and P(323) in Sola2, and GW(814)A in Sola3. Besides, most Sola2 TPases contain a CCCC type zinc-finger motif (Laity et al. 2001), C(371)–C(378)–C(383)–C(386) (supplementary fig. S3, Supplementary Material online). Similarly, a C2H2 type zinc-finger motif, C(738)–C(743)–H(756)–H(762), is present in most Sola3 TPases, except for the Sola3-1_AA and the three Sola3 TPases in P. sojae (supplementary fig. S4, Supplementary Material online). The Sola1 TPases, however, do not contain any conserved zinc-finger motifs.
Features Common to Sola TPases from Different Groups
We analyzed sequences around the three universally conserved catalytic residues for additional conservation patterns. Sola2 and Sola3 TPases exhibit a considerable level of additional sequence conservation (fig. 3A), mostly around the first and the last universally conserved aspartate residues. In addition to the aspartate residues, there are five to six other positions in these two areas that are occupied by identical or similar amino acids in majority family members, such as H(445), Q(452), E(485), H(499), and G(593)K in figure 3A. When comparing the Sola2 and Sola1 TPases, a similar pattern of sequence homology also appears, but the sequence similarities cluster around the second and the third catalytic aspartate residues (fig. 3B). In a separate study, we compared Sola1 TPases and Sola3 TPases, but the sequence similarities are lower than in the previous two comparisons. Specifically, the number of additional conserved or semiconserved amino acid residues in the local areas is three or less (data not shown). In an extended survey, we compared the Sola DDD TPases with DDE TPases from known eukaryotic superfamilies, but the number of conserved or similar residues in each of the local areas was at most two (typically one or none).
FIG. 3.—
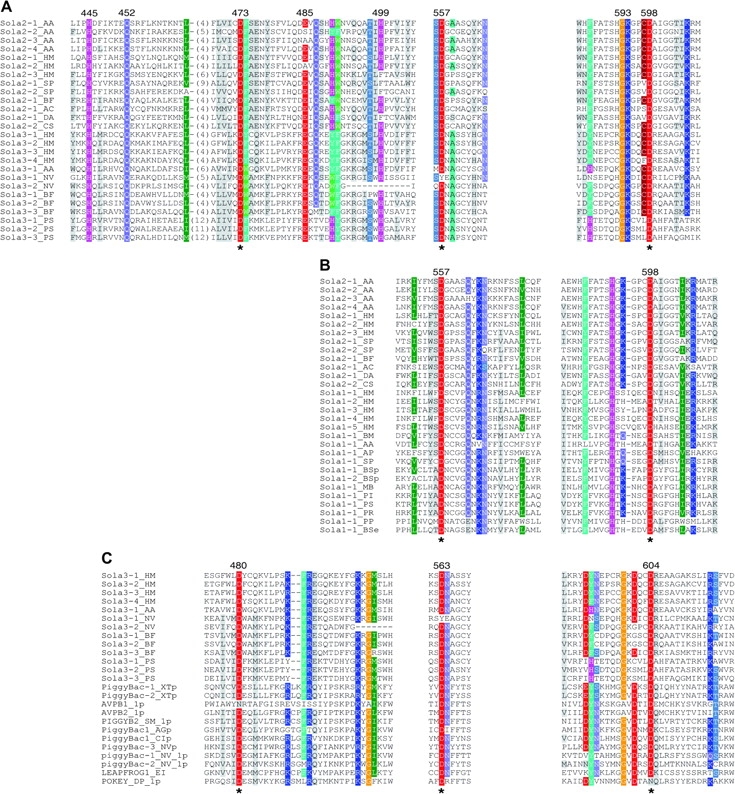
Similarities in the local catalytic areas between Sola2 and Sola3 (A), between Sola1 and Sola2 (B), and between Sola3 and PiggyBac TPases (C). The positions of the catalytic residues in the alignments are indicated with asterisks (*) below. Highly conserved or similar amino residues between groups or superfamilies are colored, less conserved residues are shaded gray. The names of individual Sola2, Sola3, and Sola1 TPases are listed in tables 1–3. The PiggyBac TPases and their names are derived from the Repbase. (A) The three catalytic blocks are shown on the left, middle, and right. The residue positions in the sequence of the Sola2-1_AA TPase are shown above. (B) The second and the third catalytic blocks are shown. The residue positions in the sequence of the Sola2-1_AA TPase are shown above. (C) Three catalytic blocks are shown. The residue positions in the sequence of the Sola3-1_HM TPase are shown above.
Characterization of Zator Transposons
Another new eukaryotic DNA transposon superfamily is named Zator. Zator elements were identified in protist (N. gruberi) and in several animals, including hydra, mollusk (A. californica), leech (Helobdella robusta), mosquito (A. aegypti, C. pipiens), lancelet (B. floridae), flatworm (S. mediterranea), sea urchin (S. purpuratus), and fly (D. willistoni) (table 4). Zator elements encode a single putative TPase (∼600–800 aa) and are flanked by short TIRs (25–34 bp) and 3-bp TSD (supplementary fig. S1B, Supplementary Material online). Notably, one 6.5-kb-long fragment in the S. purpuratus genome (AC180416.1: 77775–71242) contains a ∼2-kb Zator-like sequence in the middle, and 450-bp inverted repeats at either end. However, it is unclear whether these particular long inverted repeats represent TIRs of this Zator element. The termini of Zator elements are 5′-GG and CC-3′, and they are different from those of the 450-bp inverted repeats.
Table 4.
Zator Sequences in Diverse Genomes
| Species | Family Name | Representative Accession No. | Coordinates | Element Length | TIR Length (bp) | TPase Length (aa) | Approximate Copy Number Per Haploid Genome |
| Aplysia californica | Zator-1_AC | AASC01043930.1 | 607–2,320 | — | — | — | — |
| Aedes aegypti | Zator-1_AA | AAGE02018736.1 | 664–4,570 | 3,907 | 27 | 793a | 1 |
| Zator-2_AA | AAGE02003276.1 | 11,123–15,165 | 4,043 | 34 | 933a | 5 | |
| Branchiostoma floridae | Zator-1_BF | ABEP01023904 | 20,567–15,087 | 5,481 | 33 | 804 | 1 |
| Zator-2_BF | ABEP01045573.1 | 9,586–12,375 (partial) | — | — | 930a | 1 | |
| Culex pipiens | Zator-1_CP | AAWU01037170 | 5,724–55 | 5,670 | 27 | 655b | 1 |
| Drosophila willistoni | Zator-1_DW | AAQB01010370.1 | 43,000–43,612 (partial) | — | — | — | — |
| Helobdella robusta | Zator-1_HR | JGI scaffold 1c | 4,119,775–411,877 (partial) | — | — | — | — |
| Hydra magnipapillata | Zator-1_HM | ABRM01009058.1 | 12,380–8,997 | 3,381 | 25 | 790 | 30 |
| Zator-2_HM | ABRM01000317.1 | 50,483–46,995 | 3,481 | 28 | 832 | 30 | |
| Zator-3_HM | ABRM01020873.1 | 4,736–9,040 | 4,338 | 25 | 784 | 36 | |
| Zator-4_HM | ABRM01000437.1 | 18,224–14,083 | 4,137 | 26 | 445a | 28 | |
| Zator-5_HM | ABRM01025524.1 | 6,886–12,103 | 5,199 | 33 | 1,004 | 3 | |
| Naegleria gruberi | Zator-1_NG | JGI scaffold 196c | 457–2,802 (partial) | — | — | — | — |
| Zator-2_NG | FE236543 | — | — | — | — | ||
| Schmidtea mediterranea | Zator-1_SM | AAWT01010468.1 | 20,679–18,947 (partial) | — | — | — | 9 |
| Zator-2_SM | AAWT01048480.1 | 7,916–11,617 | 3,717 | 26 | 751a | 7 | |
| Zator-3_SM | AAWT01066039.1 | 36,459–39,320 | 2,896 | 31 | — | 10 | |
| Strongylocentrotus purpuratus | Zator-1_SP | AAGJ02142063.1 | 6,596–8,083 (partial) | — | — | — | — |
| Zator-2_SP | AAGJ02034477.1 | 10,880–9,936 (partial) | — | — | — | — |
Protein sequences are predicted: sequences could be partial, missing the start codon, or containing stop codons or small indels, or frame being shifted.
Predicted based on XP_001868493.1.
These sequence data were produced by the US Department of Energy Joint Genome Institute http://www.jgi.doe.gov/in collaboration with the user community.
Zator TPases are significantly related to a group of bacterial TPases called “transposase 36” (described below; hereafter we refer to the insertion sequences [IS] coding for it as TP36 element). The alignment of the Zator and TP36 TPase shows a few conserved blocks in a ∼150 aa region. In this region, three strictly conserved acidic amino acids, D(346), D(463), and E(507) (positions relative to the sequence of Zator-1_HM TPase), were found and most likely constitute the DDE-catalytic motif in Zator and TP36 TPases (fig. 4A).
FIG. 4.—

(A) The multiple alignments between eukaryotic Zator TPases and bacterial TP36 TPases. The three DDE-catalytic resides are indicated with asterisk (*) below, their positions in the Zator-1_HM TPase sequence are indicated above. (B) Phylogenetic relationship between Zator TPases, TP36 TPases, and other TPases from Tc1/Mariner, Pogo, IS630, and “IS630-like” group. The tree is based on the core region alignment shown in supplementary figure S5 (Supplementary Material online). Both Neighbor-Joining and minimum evolution method were applied in the analysis. The two methods gave similar tree topology, and only Neighbor-Joining tree is shown here. Values separated by slashes are bootstrap values derived from Neighbor-Joining and minimum evolution analysis, respectively. Eukaryotic TPases are indicated by black lines and bacterial or archaeal TPases by gray lines. GenBank sequences are identified by their accession numbers; sequences named FAMAR1, SMAR1, SMAR31, MAR1_TV, PrD37D, MARINER_MT, OSMAR1, Mariner-3_SM, PrD37E, SMAR5, Tc1-1_DR, and Tc1-10Xt are from Repbase; Zator sequences are listed in table 4; some TP36 TPase sequences are listed in table 6.
The Origin of Zator TPase from Bacterial Transposase 36
Using protein sequences of 11 Zator TPases initially identified (table 5) as queries in standard BlastP searches against all GenBank proteins, we found that the Zator TPases were not similar to bacterial or eukaryotic proteins, excluding a few Zator TPases annotated previously as hypothetical eukaryotic proteins. In more sensitive searches against the GenBank proteins combined with the 11 Zator TPases, using each TPase as a query in PSI-Blast (Altschul et al. 1997), we found that the Zator TPases were similar to numerous bacterial proteins annotated in GenBank as transposase 36 (hereafter refer to transposase 36 as TP36). To our knowledge, TP36 has not been described in the literature and was introduced recently in the Pfam database of proteins (http://pfam.sanger.ac.uk/) under accession number PF07592. The original similarity between the Zator and TP36 TPases was marginal, producing respective Ei-values 0.006 and 0.024 for the mosquito Zator1_AA and fruit fly Zator_DW TPases as the PSI-Blast queries (Ei is the E-value threshold for the first inclusion of bacterial TPases into the PSI-Blast iterations).
Table 5.
Statistical Significance of Similarities between the Zator and TP36 TPases
| Zator TPase Query | BlastP E-Value |
PSI-Blast (NR + 11) Ei-Value |
PSI-Blast (NR + 18) Ei-Value |
|||
| NR1 | NR2 | NR1 | NR2 | NR1 | NR2 | |
| Zator-1_AA | >1 | >1 | 0.006 (3) | 0.034 (2) | 0.005 (3) | 0.002 (2) |
| Zator-2_AA | >1 | >1 | 0.083 (3) | 0.170 (3) | 0.005 (3) | 0.038 (3) |
| Zator-1_BF | >1 | >1 | 0.061 (3) | 0.025 (3) | 0.001 (3) | 0.001 (3) |
| Zator-2_BF | >1 | >1 | 0.680 (3) | 5× 10⁻⁴ (3) | 0.007 (4) | 8 ×·10−5 (3) |
| Zator-1_CP | >1 | >1 | 0.054 (3) | 0.032 (3) | 0.018 (3) | 0.001 (2) |
| Zator-1_DW | >1 | >1 | 0.024 (3) | 0.016 (3) | 0.005 (3) | 1× 10⁻⁴ (3) |
| Zator-1_HM | >1 | >1 | 0.160 (2) | 1× 10⁻⁴ (2) | 0.005 (3) | 9× 10⁻⁶ (2) |
| Zator-2_HM | >1 | >1 | 0.210 (2) | 0.002 (2) | 0.110 (2) | 2× 10⁻⁴ (2) |
| Zator-3_HM | >1 | >1 | 0.077 (3) | 0.007 (3) | 0.012 (3) | 0.001 (2) |
| Zator-1_SP | >1 | >1 | 0.007 (2) | 0.029 (2) | 2× 10⁻⁴ (3) | 2× 10⁻⁴ (3) |
| Zator-2_SP | >1 | >1 | >1 | 0.450 (2) | 0.110 (2) | 0.038 (3) |
| Zator-5_HM | >1 | >1 | 0.140 (3) | 0.003 (3) | 0.002 (3) | 0.003 (3) |
| Zator-1_HR | >1 | >1 | 0.360 (3) | 0.002 (3) | 0.017 (2) | 2× 10⁻⁴ (2) |
| Zator-1_NG | >1 | >1 | 0.030 (3) | 1× 10⁻⁴ (2) | 0.003 (3) | 1× 10⁻⁴ (2) |
| Zator-2_NG | >1 | >1 | >1 | >1 | >1 | >1 |
| Zator-1_AC | >1 | >1 | 0.009 (2) | 0.001 (2) | 0.001 (2) | 6× 10⁻⁵ (2) |
| Zator-2_SM | >1 | >1 | 0.110 (3) | 8× 10⁻⁴ (3) | 0.019 (3) | 3× 10⁻⁵ (3) |
| Zator-3_SM | >1 | >1 | >1 | 0.510 (3) | 0.180 (3) | 0.002 (3) |
The first column lists all 18 Zator TPases used as queries in BlastP and PSI-Blast searches. The 11 TPases identified at the first stage of our study are in bold. Column 2 shows E-values of best matches between the Zator and bacterial TPases (TP36) detected in BlastP searches against the NR. NR1 and NR2 are two different releases of GenBank downloaded from NCBI in October 2007 (∼4.2 million proteins, including one Zator TPase) and December 2008 (∼7.4 million proteins, including 4 Zator TPases), respectively. Columns 3–4 report Ei-values of best matches between bacterial TPases and a Zator-derived PSSM after adding the first 11 and all 18 Zator TPases to the NR1 and NR2 GenBank sets. The numbers of the PSI-Blast iterations after which these Ei-values were obtained are shown in parentheses.
To ensure that the observed similarity between the Zator and bacterial TPases was significant, we employed the previously described method of “stepwise” PSI-Blast iterations (Kapitonov and Jurka 2005). According to this method, we studied dependence of EI-values on the number of Zator TPases combined with GenBank proteins: 1) used a GenBank set combined with N number of Zator TPases (N was 11 and 18 in our studies); 2) ran PSI-Blast against GenBank combined with TPases using each TPase as a query; 3) selected only Zator TPase sequences with E-values lower than 10−4 to define the PSI-Blast position-specific score matrix (PSSM); 4) took the best Ei-value obtained by PSI-Blast for bacterial proteins when PSSM was constructed without them; and 5) repeated these operations for different numbers (11 and 18) of TPases. If the eukaryotic Zator TPases have evolved in a distant past from the bacterial TP36, then combining more diverse Zator TPase sequences with GenBank should yield PSSM more similar to the TP36 TPases.
Using the original 11 Zator TPases as queries in TBlastN searches, we identified additional seven Zator TPases, less than 40% identical to each other. As shown in table 5, Ei-values of best matches between TP36s and the new PSSM derived from an expanded set of 18 Zator TPases were much smaller (averaging 0.005 and 0.03 for the 168.0 and 162.0 GenBank releases, table 5) than those obtained based on the PSSM constructed from the 11 Zator TPases at the preceding step (averaging 0.075 and 0.13 for the 168.0 and 162.0 GenBank releases). Therefore, the similarity between Zator and TP36 TPases is significant.
Apparently, the TP36 TPases group belongs to the IS630 superfamily of bacterial TPases (supported by PSI-Blast Ei-values <0.005 after several rounds of iterations; data not shown). Moreover, it is commonly believed that TPases of the bacterial IS630 superfamily were ancestors of the Mariner superfamily of eukaryotic TPases that includes the canonical Mariner, Tc1, and Pogo groups. Given the known similarity between the IS630 and Mariner/Tc1/Pogo TPases, it is not surprising that there is significant similarity between the Zator and Mariner/Tc1/Pogo TPases (supported by Ei-values <0.005, after >10 rounds of PSI-Blast iterations with Zator queries against the GenBank proteins; data not shown). Unlike retrotransposons, TPases from different superfamilies of DNA transposons are not similar to each other (Kapitonov and Jurka 2008). Therefore, due to the above-mentioned significant similarities between Zator and Mariner/Tc1/Pogo TPases, Zator transposons could be viewed as members of the Mariner superfamily. However, based on phylogeny studies described below, it appears that transposons of Zator and Mariner superfamilies have evolved independently from different bacterial transposons (TP36 and IS630, respectively).
To illustrate the evolutionary relationship among Zator, TP36, IS630, Mariner, Tc1, and Pogo TPases, we performed a phylogenetic analysis. We collected 75 protein sequences from Repbase and GenBank (see Methods; the multiple alignment of the TPase sequences is shown in the supplementary fig. S5, Supplementary Material online). Based on phylogenetic reconstructions (fig. 4B), it appears indeed that Zator and TP36 TPases form a cluster perfectly separated from IS630/Mariner/Tc1/Pogo and other TPases. Therefore, we assume that Zator transposons have evolved from a TP36 transposon independently from IS630/Mariner transposons and form a separate superfamily of eukaryotic DNA transposons.
To further illustrate the similarity between Zator transposons and TP36 IS at the DNA level, we also extracted seven complete TP36 transposons from seven randomly picked bacterial species (table 6). Interestingly, six of seven TP36 elements share the same termini with Zator elements: 5′-GG and CC-3′, with the exception of the TP36 from Streptomyces sp. Mg1 (table 6), which contains 5′-CT and AG-3′ termini. Like Zator, TP36 elements in most bacteria are also flanked by 3-bp TSD (table 6). However, one TP36 element from Rhodopirellula baltica SH 1 generates the unusual 1-bp TSD (supplementary fig. S1C, Supplementary Material online). There are five TP36 insertion loci in the genome sequence of R. baltica SH 1, and in three of them, the presumed pre and postinsertion sequences were found. Comparison of these sequences clearly demonstrates that each of the three TSD is 1 bp long. In the remaining two of the five loci, no preinsertion sequences were found, but the TP36 elements are flanked by the same 1-bp nucleotide at both ends (data not shown), consistent with the notion that the size of TSD is 1 bp. A single base pair TSD was previously identified in unclassified DNA transposon ACROBAT1 from zebrafish (Kapitonov and Jurka 2002).
Table 6.
TP36 Insertion Sequences from Seven Bacterial Species
| Species | Representative Accession No. | Coordinates | Length (bp) | TIRs Length (bp) | TSD (bp) | TPase (aa) | Copy Number Per Genome |
| Crocosphaera watsonii WH 8501 | AADV02000006.1 | 24,731–26,342 | 1,612 | 26 | 3 | 388 | 34 |
| Gemmata obscuriglobus UQM 2246 | ABGO01000166.1 | 1,918–3,227 | 1,310 | 28 | 3 | 375 | 5 |
| Microcoleus chthonoplastes PCC 7420 | ABRS01000099.1 | 2,709–4,873 | 2,165 | 144 | 3 | 397 | 7 |
| Microcystis aeruginosa NIES-843 | AP009552.1 | 57,776–59,370 | 1,595 | 26 | 3 | 407 | 8 |
| Streptomyces sp. Mg1 | ABJF01000014.1 | 48,471–50,172 | 1,702 | 56 | N/A | 541 | 3 |
| Streptomyces clavuligerus ATCC 27064 | ABJH01000156.1 | 47,927–46,165 | 1,763 | 71 | 3 | 564 | 2 |
| Rhodopirellula baltica SH 1 | BX294149.1 | 66,400–67,771 | 1,372 | 24 | 1 | 421 | 5 |
Discussion
Most of the currently known eukaryotic cut-and-paste DNA transposon superfamilies are DDE superfamilies. PiggyBac and Mariner are the only two superfamilies encoding DDD-TPases, although the Mariner superfamily also contains DDE TPases. The evolutionary relationship between different superfamilies remains largely an open question due to the great sequence divergence among their TPases. In this paper, we report a new DNA transposon superfamily containing the very diverse subgroups of transposons named Sola1, Sola2, and Sola3 coding for distantly related DDD TPases that are significantly different from all other TPases reported to date. Elements from the three Sola groups show different target preferences: Sola3 elements integrate specifically at TTAA sites; some Sola1 elements integrate preferentially at AWWT tetranucleotides; Sola2 elements appear to have no strong target preferences (fig. 2). Given the sequence divergence of the three Sola groups, as well as differences in their target preferences and termini, they can be considered to be three proto-superfamilies that may eventually evolve into separate superfamilies. As shown in figure 1A, elements from all Sola groups are represented in species from the Kingdom of Protista. Due to the possibility of horizontal transfer, scarcity of phylogenetic information on early eukaryotes, and relatively few protist genome sequences available, it is difficult to determine the emergence order of the three groups. Nevertheless, the available data appear to be consistent with Sola1 being older than the other two groups (Sola2 and Sola3). Sola1 elements appear to be more widespread in diverse species, including bacteria, protists, fungi, plants, and choanoflagellate (fig. 1A). However, there is an open possibility that the presence of Sola1 elements in bacterial species Beggiatoa (fig. 1B) is a result of horizontal transfer. In such a case, the age of Sola1 and Sola2 could be comparable. We also noted that there are higher sequence similarities between Sola1/Sola2 and Sola2/Sola3 elements than between Sola1 and Sola3 elements. Sola1 and Sola3 elements did not converge in our PSI-Blast runs, unless Sola2 sequences were added to the set, suggesting that Sola3 elements evolved from Sola2 elements.
Sola3 and PiggyBac elements both integrate preferentially at TTAA sites, and some conserved sequence features around the catalytic residues appear to be shared between Sola3 and the PiggyBac elements (fig. 3C). However, Sola and PiggyBac TPases do not converge during PSI-Blast iterations and the question whether or not the observed similarities are due to common ancestry or convergent evolution remains open.
The Zator superfamily and its bacterial counterpart, TP36 elements, abbreviated from Transposase 36, are distantly related to the Mariner superfamily and bacterial IS630-like elements. However, due to the independent origin of Zator from TP36 (fig. 4B), we classify Zator as a separate eukaryotic superfamily, following earlier practice (Kapitonov and Jurka 2007a). Unlike Mariners, Zator transposons are not present in sequenced genomes of plants and fungi. Therefore, one possible scenario is that a TP36 transposon, ancestral to Zator transposons, was transferred horizontally into a common ancestor of animals. However, Zators populate the protozoan amoeboflagellate N. gruberi genome, suggesting another scenario in which Zator transposons have evolved from a TP36 transposon introduced in a common ancestor of amoeboflagellates, fungi, and animals, followed by subsequent extinctions of Zators from fungi. Alternatively, the first scenario is still tenable if the amoeboflagellate transposons have evolved via horizontal transfer of an animal Zator. For instance, the ∼200-aa TPase core region in the hydra Zator-2_HM is 76% identical to that in the mosquito Zator-1_CP transposon. Given that hydra and mosquito split from their common ancestor some 900 Ma, the observed high identity suggests that these transposons might have evolved via horizontal transfer.
Identification of new superfamilies of TEs, even the most obscure ones, can be critical for understanding their biological impact on eukaryotic genomes. One important example is the RAG1 gene derived from transposons belonging to the little known Transib (Kapitonov and Jurka 2005), and Chapaev DNA transposon superfamilies (Kapitonov and Jurka 2007b; Panchin and Moroz 2008). RAG1 is involved in V(D)J recombination, which is a crucial step in the immune response in vertebrates. Also, TEs might have been precursors of transcription factors and other components of eukaryotic regulatory systems (Robertson and Zumpano 1997; Cordaux et al. 2006; Gentles et al. 2007; Jurka 2008). Therefore, understanding of the biological diversity of TEs is essential for a fundamental understanding of their biological impact on the eukaryotic world.
Supplementary Materials
Supplementary figures S1–S5 are available at Molecular Biology and Evolution online (http://www.mbe.oxfordjournals.org/).
Acknowledgments
This work was supported by the National Institutes of Health grant 5 P41 LM006252.
References
- Adl SM, Simpson AG, Farmer MA, et al. (28 co-authors) The new higher level classification of eukaryotes with emphasis on the taxonomy of protists. J Eukaryot Microbiol. 2005;52:399–451. doi: 10.1111/j.1550-7408.2005.00053.x. [DOI] [PubMed] [Google Scholar]
- Altschul SF, Madden TL, Schaffer AA, Zhang J, Zhang Z, Miller W, Lipman DJ. Gapped BLAST and PSI-BLAST: a new generation of protein database search programs. Nucleic Acids Res. 1997;25:3389–3402. doi: 10.1093/nar/25.17.3389. [DOI] [PMC free article] [PubMed] [Google Scholar]
- Bao Z, Eddy SR. Automated de novo identification of repeat sequence families in sequenced genomes. Genome Res. 2002;12:1269–1276. doi: 10.1101/gr.88502. [DOI] [PMC free article] [PubMed] [Google Scholar]
- Chandler M, Mahillon J. Insertion sequences revisited. In: Craig NL, Craigie R, Gellert M, Lambowitz AM, editors. Mobile DNA II. Washington, DC: American Society for Microbiology Press; 2002. pp. 305–366. [Google Scholar]
- Cordaux R, Udit S, Batzer MA, Feschotte C. Birth of a chimeric primate gene by capture of the transposase gene from a mobile element. Proc Natl Acad Sci USA. 2006;103:8101–8106. doi: 10.1073/pnas.0601161103. [DOI] [PMC free article] [PubMed] [Google Scholar]
- Crooks GE, Hon G, Chandonia JM, Brenner SE. WebLogo: a sequence logo generator. Genome Res. 2004;14:1188–1190. doi: 10.1101/gr.849004. [DOI] [PMC free article] [PubMed] [Google Scholar]
- Dyda F, Hickman AB, Jenkins TM, Engelman A, Craigie R, Davies DR. Crystal structure of the catalytic domain of HIV-1 integrase: similarity to other polynucleotidyl transferases. Science. 1994;266:1981–1986. doi: 10.1126/science.7801124. [DOI] [PubMed] [Google Scholar]
- Gentles AJ, Wakefield MJ, Kohany O, Gu W, Batzer MA, Pollock DD, Jurka J. Evolutionary dynamics of transposable elements in the short-tailed opossum Monodelphis domestica. Genome Res. 2007;17:992–1004. doi: 10.1101/gr.6070707. [DOI] [PMC free article] [PubMed] [Google Scholar]
- Hall TA. BioEdit: a user-friendly biological sequence alignment editor and analysis program for Windows 95/98/NT. Nucl Acids Symp Ser. 1999;41:95–98. [Google Scholar]
- Hickman AB, Perez ZN, Zhou L, Musingarimi P, Ghirlando R, Hinshaw JE, Craig NL, Dyda F. Molecular architecture of a eukaryotic DNA transposase. Nat Struct Mol Biol. 2005;12:715–721. doi: 10.1038/nsmb970. [DOI] [PubMed] [Google Scholar]
- Jurka J. Conserved eukaryotic transposable elements and the evolution of gene regulation. Cell Mol Life Sci. 2008;65:201–204. doi: 10.1007/s00018-007-7369-3. [DOI] [PMC free article] [PubMed] [Google Scholar]
- Jurka J, Kapitonov VV, Pavlicek A, Klonowski P, Kohany O, Walichiewicz J. Repbase update, a database of eukaryotic repetitive elements. Cytogenet Genome Res. 2005;110:462–467. doi: 10.1159/000084979. [DOI] [PubMed] [Google Scholar]
- Kapitonov VV, Jurka J. ACROBAT1, a nonautonomous DNA transposon from zebrafish. Repbase Rep. 2002;2:1. [Google Scholar]
- Kapitonov VV, Jurka J. RAG1 core and V(D)J recombination signal sequences were derived from Transib transposons. PLoS Biol. 2005;3:e181. doi: 10.1371/journal.pbio.0030181. [DOI] [PMC free article] [PubMed] [Google Scholar]
- Kapitonov VV, Jurka J. IS4EU, a novel superfamily of eukaryotic DNA transposons. Repbase Rep. 2007a;7:143–147. [Google Scholar]
- Kapitonov VV, Jurka J. Chapaev – a novel superfamily of DNA transposons. Repbase Rep. 2007b;7:774–781. [Google Scholar]
- Kapitonov VV, Jurka J. A universal classification of eukaryotic transposable elements implemented in Repbase. Nat Rev Genet. 2008;9:411–412. doi: 10.1038/nrg2165-c1. [DOI] [PubMed] [Google Scholar]
- Laity JH, Lee BM, Wright PE. Zinc finger proteins: new insights into structural and functional diversity. Curr Opin Struct Biol. 2001;11:39–46. doi: 10.1016/s0959-440x(00)00167-6. [DOI] [PubMed] [Google Scholar]
- Notredame C, Higgins DG, Heringa J. T-Coffee: a novel method for fast and accurate multiple sequence alignment. J Mol Biol. 2000;302:205–217. doi: 10.1006/jmbi.2000.4042. [DOI] [PubMed] [Google Scholar]
- Panchin Y, Moroz LL. Molluscan mobile elements similar to the vertebrate recombination-activating genes. Biochem Biophys Res Commun. 2008;369:818–823. doi: 10.1016/j.bbrc.2008.02.097. [DOI] [PMC free article] [PubMed] [Google Scholar]
- Pennisi E. Drafting a tree. Science. 2003;300:1694. doi: 10.1126/science.300.5626.1694. [DOI] [PubMed] [Google Scholar]
- Putnam NH, Srivastava M, Hellsten U, et al. (19 co-authors) Sea anemone genome reveals ancestral Eumetazoan gene repertoire and genomic organization. Science. 2007;317:86–94. doi: 10.1126/science.1139158. [DOI] [PubMed] [Google Scholar]
- Rice PA, Baker TA. Comparative architecture of transposase and integrase complexes. Nat Struct Biol. 2001;8:302–307. doi: 10.1038/86166. [DOI] [PubMed] [Google Scholar]
- Robertson HM, Zumpano KL. Molecular evolution of an ancient mariner transposon, Hsmar1, in the human genome. Gene. 1997;205:203–217. doi: 10.1016/s0378-1119(97)00472-1. [DOI] [PubMed] [Google Scholar]
- Shao H, Tu Z. Expanding the diversity of the IS630-Tc1-mariner superfamily: discovery of a unique DD37E transposon and reclassification of the DD37D and DD39D transposons. Genetics. 2001;159:1103–1115. doi: 10.1093/genetics/159.3.1103. [DOI] [PMC free article] [PubMed] [Google Scholar]
- Smit AF, Riggs AD. Tiggers and DNA transposon fossils in the human genome. Proc Natl Acad Sci USA. 1996;93:1443–1448. doi: 10.1073/pnas.93.4.1443. [DOI] [PMC free article] [PubMed] [Google Scholar]
- Tamura K, Dudley J, Nei M, Kumar S. MEGA4: molecular Evolutionary Genetics Analysis (MEGA) software version 4.0. Mol Biol Evol. 2007;24:1596–1599. doi: 10.1093/molbev/msm092. [DOI] [PubMed] [Google Scholar]
Associated Data
This section collects any data citations, data availability statements, or supplementary materials included in this article.