Abstract
The dentin-enamel junction (DEJ) plays an important role in preventing crack propagation from enamel into dentin. This function stems from its complex structure and materials properties which are different from either dentin or enamel. The molecular structural differences in both mineral and organic matrix across the DEJ zone were investigated by means of 2-dimensional confocal Raman microspectroscopic mapping/imaging technique. The intensity ratios of 1450(CH, matrix)/960(P-O, mineral) decreased gradually to nearly zero across the dentin-enamel junction. The width of this transition zone was dependent on the intratooth location, with 12.9±3.2 microns width at occlusal positions and 6.2±1.2 microns at cervical positions. The difference in width was significant (P<0.001). Concurrently, spectral differences in both organic and inorganic matrices across the DEJ were also noted. For example, the ratios of 1243(Amide III)/1450(CH) within the DEJ were lower than the values in dentin, however, the ratios of 1665(Amide I)/1450(CH) within the DEJ were higher than those values in dentin. In addition, the ratios of 1070(carbonate)/960 (phosphate) within the dentin were lower than the values in the DEJ. Raman images indicated that the distribution of the above ratios across the DEJ zone were also different at occlusal and cervical positions. The results suggest that the intratooth-location-dependent structure of the DEJ may be related to its function. Micro-Raman spectroscopic/imaging analysis of the DEJ provides a powerful means of identifying the functional width and molecular structural differences across the DEJ.
Keywords: Dentin-Enamel Junction (DEJ), Molecular Structure, Confocal Raman Microspectroscopic Mapping/Imaging
Introduction
The human tooth or more specifically, the tooth's crown, is composed of dentin covered by enamel. Dentin, which is derived from the mesoderm, is a flexible, mineralized tissue composed of 70% (weight%) inorganic material, 20% organic material, and 10% fluid. In contrast, enamel, which is derived from ectoderm, is a very brittle tissue composed of mostly hydroxyapatite mineral (∼96%), water (∼3%), and trace organic matrix (∼1%) [1]. Thus, the dentin-enamel junction, (DEJ) is an interface between two mineralized tissues with different compositions and biomechanical properties [2]. The DEJ is believed to play an important role in preventing crack propagation from enamel to dentin and inhibiting further catastrophic tooth fracture.
The complex microstructure and composition of the DEJ at various levels is supposedly linked to its function as an effective obstacle for crack propagation. The DEJ structure has been described as a series of 25-200 μm diameter scallops that contain 80-120 nm parallel Type-I collagen fibrils extending from the dentin into enamel, which might play a role in crack prevention [3]. Crack deflection near the DEJ has also been potentially linked to a mechanical property gradient, i.e. modulus, across the zone [4-9]. The modulus gradient has been associated with variations of mineralization and the associated collagen to mineral ratio within the DEJ as compared to dentin and enamel [5, 7, 10]. Recently, finite-element models [11] showed that in the scallop model, the net-compression towards the DEJ was consistently higher than net-tension away from it. As a consequence, the dentin and enamel would be pushed towards each other during loading.
Because of this crack-prevention function, the physical properties, for example, the width, microhardness and elastic modulus of the DEJ, become very critical information. So far, the conclusions on these issues have been in disagreement. Nano-indentation was carried out using a range of 40 to 60 μm across the DEJ zone with loads up to 30,000 μN. The values of modulus and hardness decreased from E = 65 GPa and H = 3.5 GPa in the enamel region to E = 20 GPa and H = 0.7 GPa in the dentin region. An average DEJ width range of 11.8 μm was identified [6]. The results from micro-indentation measurements [1] revealed similar hardness and modulus values. However, another study [12] showed that the microhardness gradient occurred within ∼100 μm range. Some results from optical spectroscopy [13] showed that the median DEJ width was 10 μm ranging from 7 μm to 15 μm, which was similar to the width obtained from the nano-indentation method. However, previous results did not appear to be dependent on the intratooth location [6, 13].
Although the previous studies provide useful information for understanding the DEJ morphology and the associated mechanical properties, to date, there has been no in-depth analysis of the DEJ's chemical structure at the molecular level. The chemical structural information is critical for a more complete understanding of crack-prevention behavior in the DEJ zone, since material properties are dependent on the material chemical composition. This information is also critical in terms of being able to create a biomimetic approach for connecting dissimilar biomaterials.
Confocal micro-Raman spectroscopy has been widely used to investigate chemical/molecular structure of various materials and tissues [14-18] because of its many advantages including minimal specimen preparation and non-invasive sampling capability. In addition, compound-specific molecules can be detected with little spectral interference from H2O. As a result, it has been introduced into the biophysics field to obtain the molecular structure information for both in vivo [19, 20] and in vitro studies [15, 21, 22]. Raman microscopy's high spectral resolution (up to 1 cm-1) and high spatial resolution (up to 1 μm) make it an excellent tool for mapping the components of the DEJ specimens at the micrometer level. Therefore, the purpose of this investigation was to characterize the molecular/structural differences across the DEJ zone using 2-dimensional confocal Raman microspectroscopic mapping/imaging technique.
Materials and Methods
Specimen preparation
Five non-carious, human third molars were collected according to the protocol approved by the UMKC adult health sciences institutional review board. After removing any remaining soft tissues, the extracted teeth were stored at 4°C in 0.9% phosphate-buffered saline (PBS) with 0.002% sodium azide added to inhibit bacterial and fungal contamination (pH 7.4). A slow-speed water-cooled diamond saw (Buehler Ltd., Lake Bluff, IL), was used to remove the roots from the molars. The remaining crowns were then sectioned bucco-lingually to generate a 2-mm thick cross-sectional slice centered on the mesio-buccal and mesio-lingual cusps. The specimens with the exposed DEJ were further manually polished under water with 600 grit SiC paper. To prevent dehydration, all sectioned specimens were placed into PBS solution and then the Raman microscopic analysis immediately followed.
Raman microspectroscopy/imaging
A LabRam HR 800 Raman spectrometer (HORIBA JOBIN YVON, Edison, NJ, USA) using monochromatic radiation emitted by a He-Ne laser (632.8 nm) and operating at excitation power of 20 mW was used to collect Raman spectra and images. It was equipped with a confocal microscope (Olympus BX41), a piezoelectric (PI) XYZ stage with a minimum step width of 50 nm, and an air-cooled CCD detector of 1024×256 pixels. During Raman imaging, the following parameters were used: 600 grating, 140-μm confocal hole, and 100-μm slit width. Spectra were Raman-shift-frequency-calibrated using known lines of silicon.
Specimens were removed from the PBS and placed into distilled water for the micro-Raman analysis. Micro-Raman spectra using a 100X water immersion objective (Olympus, 1.00w) focused on the specimens. Using the optical DEJ as a landmark, mapping spectra were acquired at positions corresponding to 1-μm intervals across a 35-micron length using the computer-controlled x-y-z stage. Spectra were obtained over the spectral region of 400 to 1750 cm−1 and with a 90-s integration time. Six spectral maps were obtained at the buccal cusp and cervical area of each specimen (see Figure 1 (A and B insets indicate buccal and cervical mapping areas). An imaging system and high-resolution monitor enabled visual identification of the position at which the Raman spectra were obtained.
Fig. 1.
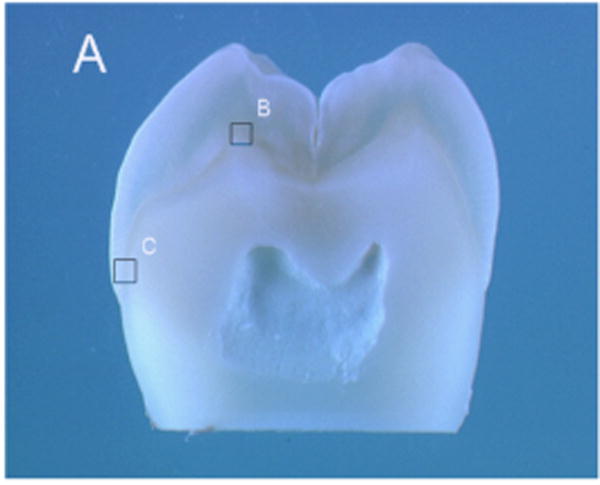
Representative photograph of a cross-sectional tooth slice illustrating where spectral maps were obtained at the buccal cusp and cervical area. A and B insets indicate buccal and cervical mapping areas.
Spectral data analysis
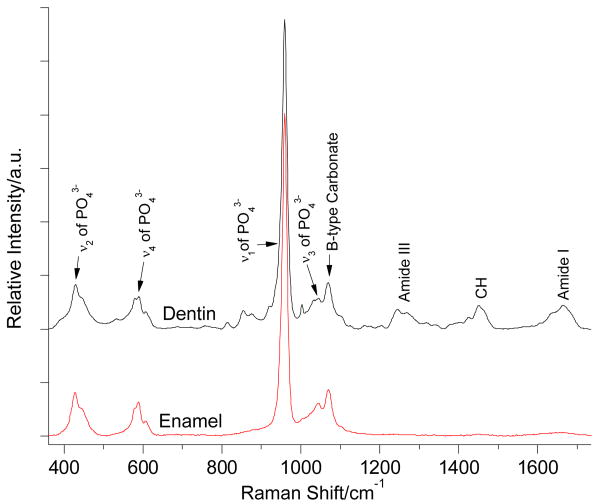
Labspec 5 software (HORIBA JOBIN YVON) was used to analyze the acquired Raman spectra and mapping data. Without additional spectral smoothing, the individual spectra were adjusted using multiple-point baseline correction and mapping spectra for imaging were adjusted using polynomial baseline correction. Two representative Raman spectra obtained from dentin and enamel are shown in Fig. 2. The peaks at 960 cm-1 are assigned to ν1 vibration peak of phosphate group in mineral. The peak at 1070 cm-1 is assigned to ν1 vibration of carbonate group (B-type of carbonate) from mineral. In addition, the peaks at 1246/1270 cm-1, 1450 cm-1 and 1667 cm-1 are assigned to Amide III, CH and Amide I from organic components. The ν1 vibration peak of phosphate at 960 cm-1 was selected as the internal standard for the normalization adjustment (Fig. 1).
Fig. 2.
Representative Raman spectra of dentin and enamel.
Raman images based on the ratios of CH at 1450 cm-1 to ν1 of phosphate at 960 cm-1 were obtained to measure organic matrix mineral content. Using the generated mapping spectra, the width of the DEJ was measured based on the matrix mineral ratios at occlusal and cervical sites. The mean DEJ width of each site/tooth was calculated based on the 6 maps per site. A one-way analysis of variance (ANOVA, α= 0.05) was used to analyze the DEJ width as a function of tooth location, occlusal versus cervical.
In addition, after normalization adjustment based on the CH stretching peak at 1450 cm-1, Raman images based on the ratios of Amide I at 1667 cm-1 to CH peak at 1450 cm-1 and the ratios of Amide III at 1240 - 1270 cm-1 to CH peak at 1450 cm-1 were obtained. The ratios of B-type carbonate at 1070 cm-1 to ν1 of phosphate at 960 cm-1 were obtained to analyze differences in mineral composition across the specimens.
Results
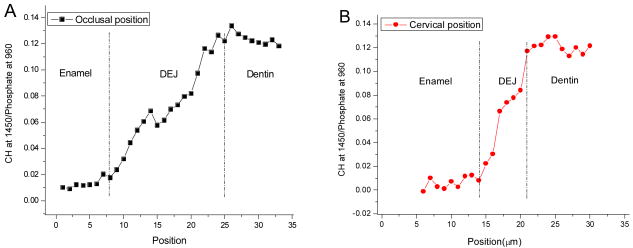
Representative Raman mapping results of the DEJ at occlusal and cervical sites of a human molar are shown in Fig. 3 A and B, respectively. Raman images were obtained based on the intensity ratios of CH at 1450 cm-1 (matrix) to phosphate at 960 cm-1 (mineral). The relative matrix/mineral (1450/960) ratios are represented by the color differences. Yellow/white represents higher relative intensity ratios, while black/dark blue represents lower ratios. A region where the color gradually changes from blue to red or pink is related to the DEJ transition zone. Comparison of the two images indicated that the width of the transition zone at the occlusal position was wider than that at the cervical position. The representative relationships of the matrix/mineral (1450/960) ratios as a function of positions across the DEJ transition zone are shown in Fig. 4A and B. The matrix/mineral ratios of the DEJ were higher than those of enamel and lower than those of dentin. These ratios of the DEJ gradually increased during the transition from the enamel to dentin zone. The widths of the transition zone were measured across the 5 teeth presented in Table 1. There was a significant difference (P<0.001) between the overall mean occlusal DEJ width, 12.9±3.2 μm and the cervical DEJ width, 6.3±1.3 μm.
Fig. 3.
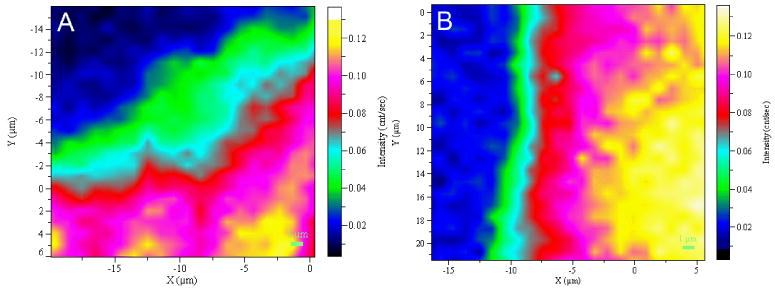
Representative Raman image of the DEJ based on intensity ratios of 1450/960 at occlusal positions (A) and at cervical positions (B).
Fig. 4.
Relative intensity ratios of 1450/960 across the enamel/DEJ/dentin zone at occlusal positions (A) and at cervical positions (B).
Table 1.
Occlusal and cervical DEJ transition zone mean width and standard deviation (μm)
| Tooth | Buccal cusp occlusal site | Buccal cervical site |
|---|---|---|
| 1 | 10.8±3.5 | 6.3±1.4 |
| 2 | 12.2±2.6 | 6.0±0.9 |
| 3 | 12.7±2.8 | 5.8±1.0 |
| 4 | 14.2±2.5 | 6.2±1.5 |
| 5 | 14.8±3.3 | 7.3±1.8 |
| * Overall Mean ±SD | 12.9±3.2 | 6.3±1.3 |
There was a significant difference (P<0.001) in DEJ width between sites.
N = 30 Raman mappings/site (6 measurements/site/tooth)
Raman spectra from the dentin and DEJ zone in the protein-derived spectral region of 1200-1750 cm-1 are shown in Fig. 5 A and B, in which the vibration peak of CH at 1450 cm-1 was selected as internal standard for the normalization adjustment. As compared to dentin spectra, the amide I peak increased, but the amide III peak decreased in the DEJ spectra. In addition, evaluation of the spectra also shows notable changes in protein-derived peaks in the regions of 1350-1430 cm-1 and 1550-1600 cm-1. For example, there was a pronounced peak at ca. 1425 cm-1 in the dentin spectra, while this peak was not obvious in the DEJ spectra. The relative intensities of the peaks at ca. 1380 and 1396 cm-1 were higher in the dentin spectra. The above results indicated that molecular structure of organic matrix in the DEJ was different from that in dentin. The distinctions in organic matrix and its distribution across the DEJ zone at occlusal positions and cervical positions were observed when Raman images were obtained based on the relative intensity ratios of the peaks from amide I-III spectral regions (Fig. 5C-5F). In the amide I/CH images, the values from the intensity ratios of 1667 to 1450 were non-uniformly distributed in the zone across the enamel to dentin. Overall, these values were higher in the enamel zone than those in the dentin zone. However, the DEJ zones at both occlusal and cervical positions were not distinguishable within those images. In contrast to the amide I/CH images, in the amide III/CH images the values from the intensity ratios were lower in the enamel zone, higher in the dentin zone. The DEJ zone was distinguishable in the amide III/CH images with the DEJ being wider at the occlusal position (Fig. 5). The above results indicate that the molecular structure of organic matrix varied between dentin, enamel and DEJ, and was also dependent on the intratooth location.
Fig. 5.
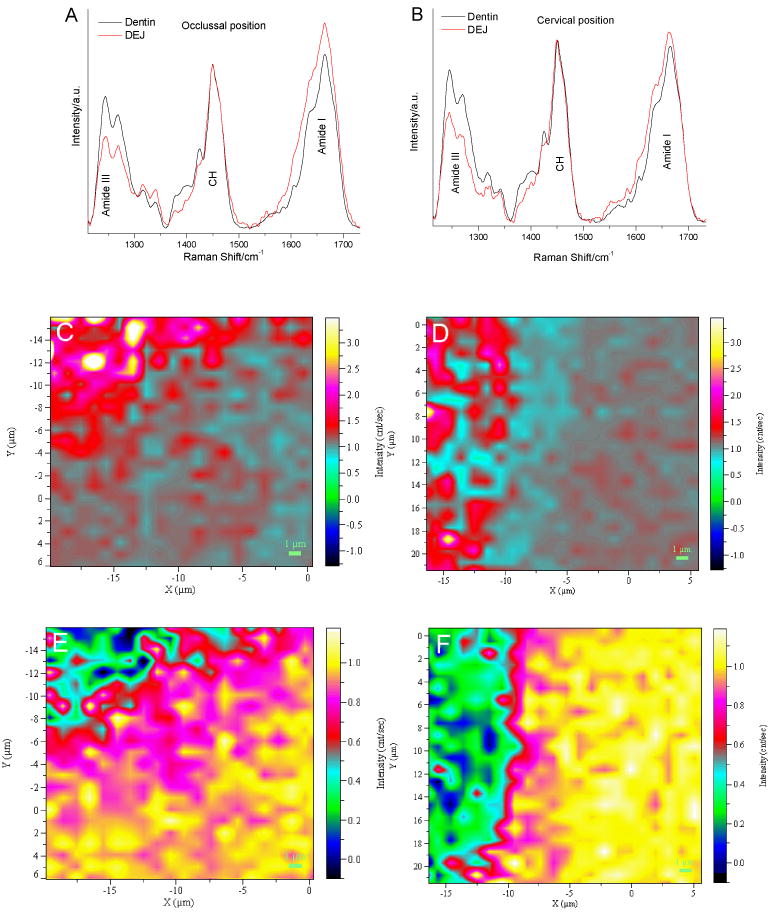
Raman spectra in protein-derived spectral regions from dentin and the DEJ at occlusal positions (A) and at cervical positions (B); representative Raman image of the DEJ based on intensity ratios of amide I/1450 at occlusal positions (C) and at cervical positions (D); representative Raman image of the DEJ based on intensity ratios of amide III/1450 at occlusal positions (E) and at cervical positions (F).
Raman spectra from the dentin and DEJ zone in the spectral region of 900-1150 cm-1 are shown in Fig. 6 A and B. The spectra were normalized based on the 960 cm-1 phosphate peak. Evaluation of the spectra shows some notable changes in mineral-derived peaks. For example, as compared to dentin spectra, the relative intensities of the carbonate peak at 1070 cm-1 (B-type of carbonate) increased in the DEJ spectra at both occlusal and cervical positions. The distribution of 1070/960 ratios across the DEJ zone at occlusal positions and cervical positions are shown in Fig. 6 C and D. Overall, the values of these ratios indicated that the content of type B carbonate in enamel was relatively higher than that in dentin. At the cervical position, the type B carbonate content gradually decreased from the enamel to dentin, and the DEJ zone was uniform. However, at the occlusal position the DEJ zone was not distinguishable in the image (Fig. 6C), indicating the distribution of the type B carbonate content was more heterogeneous and complicated across the occlusal DEJ zone.
Fig. 6.
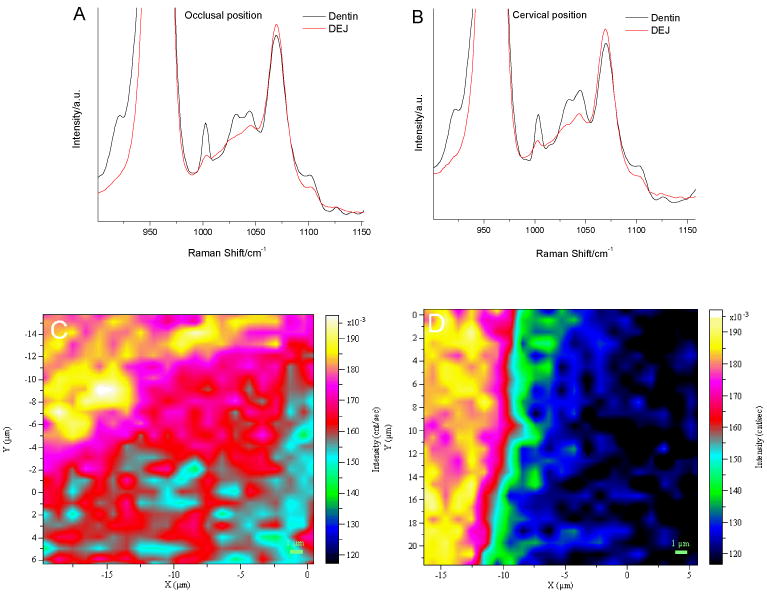
Raman spectra in mineral-derived spectral regions from dentin and the DEJ at occlusal positions (A); at cervical positions (B); representative Raman image of the DEJ based on intensity ratios of 1070/960 at occlusal positions (C); at cervical positions (D).
Discussion
As an interface between two materials with dissimilar composition and properties, the DEJ has been identified since 1835 [23]. However, there have been inconsistent conclusions reported about the functional width of the DEJ zone due to measurements with different instruments with diverse spatial resolutions. For example, when traditional fracture mechanics [4] in combination with SEM approach was used, the width of the DEJ zone was reported as a functional width of 50 to 100 μm, which was the deviation depth of the associated crack path. Furthermore, a Vickers microhardness profile [12] obtained with loads of 15 g across the DEJ revealed a broad transition zone of ∼100 μm. However, with the nano-indentation method [6], although similar values of hardness and elastic modulus were reported as compared to previous studies, the DEJ width was much smaller (∼12 μm). Using a new modulus mapping technique, the same group of investigators reported a DEJ width as low as 2-3 μm [24]. The variations in width measurements can be explained by not only the differences in the spatial resolutions of the instruments, but also by whether the matrices surrounding the interface were included in the measurements. Goldberg et al. suggested that the DEJ is not a simple inert interface between two mineralized structures, but instead should be regarded as a complex that includes the inner aprismatic enamel and the mantle dentin [25].
In the present study, the chemical composition profiles (matrix/mineral ratios) were used to measure the width of the DEJ as a function of tooth position (Fig. 4). The intensity ratios of 1450(CH, matrix)/960(P-O, mineral) remained unchanged in dentin, then decreased gradually to nearly zero across the dentin-enamel junction. The width of this transition zone was determined to be in the range of 5-16 μm. Interestingly, based on the matrix/mineral ratios, it was shown that the mean DEJ width was 12.9±3.2 μm at occlusal positions and 6.3±1.3 μm at cervical positions. Previous research has shown that the enamel initially forms at the occlusal/cuspal locations followed by enamel formation across the crown to the cervical area [26, 27]. The difference in development times of enamel at occlusal and cervical positions might account for the difference in structural width of the DEJ between positions. The difference might also be related to differences in function with the occlusal surfaces exposed to greater loads during mastication than the cervical area.
The difference in DEJ width dependent on intratooth location has not been previously reported in investigations using measurements of mechanical properties, such as hardness or modulus. The direct relationship between mechanical properties and chemical compositions across the DEJ zone needs to be further explored and correlated. However, it's expected that the mechanical properties might not be directly related to chemical compositions such as the matrix/mineral ratios. Many other factors such as porous structure within the DEJ complex may also affect the mechanical properties. But the chemical structural information obtained in this study is very critical in understanding the function of this DEJ complex.
To date, there has been minimal chemical information related to the DEJ transition zone due to its small size. The current micro-Raman results indicate that both chemical structure and composition of organic and inorganic matrices within the DEJ zone are different from either dentin or enamel. In terms of organic matrix, the spectral region of amides I and III was thought to be the best possible region for studying the protein structural changes [28, 29]. The position and intensity of these amide bands are sensitive to the molecular conformation/structure of the polypeptide chains [30] and/or orientation of collagen/proteins [31]. To separate the orientation effects from molecular/structural changes, we collected spectra before and after rotating the specimens. The differences in the dentin and DEJ spectra were unchanged, and insensitive to orientation effects. This indicated that the spectral differences were mainly due to molecular/structural changes. In a comparison of the amides region in the spectra of dentin and DEJ (Fig. 5), the amide I peak increased but the amide III peak decreased in the DEJ spectra. In the images of amide I/CH and amide III/CH, the distribution of these ratios was more heterogeneous in the DEJ transition zone. Besides the amides region, the differences in the region of 1350-1430 cm-1 were also noticeable (Fig. 5). The peaks in this region were pronounced in the dentin spectra. The peaks at ca. 1380, 1396 and 1425 cm-1 are associated with CH2 deformation [32, 33]. The peak at ca. 1396 cm-1 is usually seen in native collagen [33]. The decrease in these peak intensities might be associated with increasing disorder of the functional groups in organic matrix [32]. These spectral changes indicate that the structure of organic matrix in the dentin and DEJ was diverse. Formation of the DEJ begins at the early stages of tooth morphogenesis and is thought to be linked to a mixture of dentin proteins secreted by odontoblasts and enamel proteins from ameloblasts [34-36]. The proteins associated with DEJ formation and collagen fibril bundles that cross the transition zone and insert into enamel [3] might be responsible for the variations and distribution deviations in composition and structure of the organic matrix within the DEJ.
In terms of inorganic matrix variations, it was revealed that the crystal structure of mineral in enamel and dentin is different [37-39]. Based on our micro-Raman results, the position, shape and width of phosphate peak at 960 cm-1 were similar to those for dentin (data not shown), indicating the mineral crystallinity within the DEJ is not much different from the mineral in dentin. However, the intensity ratios of peak at 1070 cm-1 to 960 cm-1 increased from dentin to enamel across the DEJ zone, indicating a higher carbonate content in enamel. However, further Raman study indicated that this relatively higher carbonate content was demonstrated in only a narrow enamel region adjacent to the DEJ (data not shown). For enamel close to the tooth surface, the carbonate content was reported to be very minimal, much lower than that in dentin [40]. These differences in carbonate content are important, because the higher the carbonate the more susceptible to mineral dissolution [10, 41, 42]. Thus, minimal carbonate at the outer enamel surface should provide superior resistance to attack from the acidic by-products associated with dental plaque. However, the increased carbonate within enamel near the DEJ may help explain why dental decay tends to penetrate more rapidly once it nears the DEJ [43].
Besides the difference in width based on matrix/mineral intensity ratios, the intratooth-location-dependent structure of the DEJ was also noticed in other Raman intensity ratios. At cervical positions, the interfacial margins were easily visible in the images from different intensity ratios. For example, these margins usually appeared at x position of about -10 um, and the interfacial zone was relative uniform across the DEJ. However, at occlusal positions, the margins were hard to differentiate, and appeared at different positions in the images from different intensity ratios. The overall interfacial zone was not uniform, and more heterogeneous as compared to that at cervical positions.
In summary, Raman spectroscopy equipped with confocal microscope proved to be useful in investigating the microstructure of the DEJ at the micrometer scale. The Raman results suggest there are difference in the DEJ width as function of intratooth location along with differences in the DEJ organic and inorganic components between the occlusal and cervical sites.
Acknowledgments
This investigation was supported in part by USPHS Research Grants DE 015735, DE 015281 and DE 016023 from the National Institute of Dental and Craniofacial Research, National Institutes of Health, Bethesda, MD 20892.
References
- 1.Xu HHK, Smith DT, Jahanmir S, Romberg E, Kelly JR, Thompson VP, Rekow ED. Indentation damage and mechanical properties of human enamel and dentin. J Dent Res. 1998;77:472–480. doi: 10.1177/00220345980770030601. [DOI] [PubMed] [Google Scholar]
- 2.Walker MP, Fricke BA. Dentin-Enamel Junction of Human Teeth. In: Akay M, editor. Wiley Encyclopedia of Biomedical Engineering. John Wiley & Sons, Inc; Hoboken, NJ: 2006. pp. 1061–1064. [Google Scholar]
- 3.Lin CP, Douglas WH, Erlandsen SL. Scanning electron microscopy of type I collagen at the dentin-enamel junction of human teeth. J Histochem Cytochem. 1993;41:381–388. doi: 10.1177/41.3.8429200. [DOI] [PubMed] [Google Scholar]
- 4.Lin CP, Douglas WH. Structure-Property Relations and Crack Resistance at the Bovine Dentin-Enamel Junction. J Dent Res. 1994;73:1072–1078. doi: 10.1177/00220345940730050901. [DOI] [PubMed] [Google Scholar]
- 5.Dong XD, Ruse ND. Fatigue crack propagation path across the dentinoenamel junction complex in human teeth. J Biomed Mater Res A. 2003;66A:103–109. doi: 10.1002/jbm.a.10541. [DOI] [PubMed] [Google Scholar]
- 6.Marshall GW, Jr, Balooch M, Gallagher RR, Gansky SA, Marshall SJ. Mechanical properties of the dentinoenamel junction: AFM studies of nanohardness, elastic modulus, and fracture. J Biomed Mater Res. 2001;54:87–95. doi: 10.1002/1097-4636(200101)54:1<87::aid-jbm10>3.0.co;2-z. [DOI] [PubMed] [Google Scholar]
- 7.Fong H, Sarikaya M, White SN, Snead ML. Nano-mechanical properties profiles across dentin-enamel junction of human incisor teeth. Mater Sci & Eng C-Biomimetic and Supramolecular Systems. 2000;7:119–128. [Google Scholar]
- 8.Urabe I, Nakajima S, Sano H, Tagami J. Physical properties of the dentin-enamel junction region. Am J Dent. 2000;13:129–135. [PubMed] [Google Scholar]
- 9.Maev RG, Denisova LA, Maeva EY, Denissov AA. New data on histology and physico-mechanical properties of human tooth tissue obtained with acoustic microscopy. Ultrasound Med Biol. 2002;28:131–136. doi: 10.1016/s0301-5629(01)00480-x. [DOI] [PubMed] [Google Scholar]
- 10.WentrupByrne E, Armstrong CA, Armstrong RS, Collins BM. Fourier transform Raman microscopic mapping of the molecular components in a human tooth. J Raman Spectrosc. 1997;28:151–158. [Google Scholar]
- 11.Shimizu D, Macho GA. Functional significance of the microstructural detail of the primate dentino-enamel junction: a possible example of exaptation. J Hum Evol. 2007;52:103–111. doi: 10.1016/j.jhevol.2006.08.004. [DOI] [PubMed] [Google Scholar]
- 12.White SN, Paine ML, Luo W, Sarikaya M, Fong H, Yu ZK, Li ZC, Snead ML. The dentino-enamel junction is a broad transitional zone uniting dissimilar bioceramic composites. J Am Ceram Soc. 2000;83:238–240. [Google Scholar]
- 13.Gallagher RR, Demos SG, Balooch M, Marshall GW, Jr, Marshall SJ. Optical spectroscopy and imaging of the dentin-enamel junction in human third molars. J Biomed Mater Res A. 2003;64:372–377. doi: 10.1002/jbm.a.10436. [DOI] [PubMed] [Google Scholar]
- 14.Baena JR, Lendl B. Raman spectroscopy in chemical bioanalysis. Curr Opin Chem Biol. 2004;8:534–539. doi: 10.1016/j.cbpa.2004.08.014. [DOI] [PubMed] [Google Scholar]
- 15.Darvin ME, Gersonde I, Ey S, Brandt NN, Albrecht H, Gonchukov SA, Sterry W, Lademann J. Noninvasive detection of beta-carotene and lycopene in human skin using Raman spectroscopy. Laser Physics. 2004;14:231–233. [Google Scholar]
- 16.Katz A, Kruger EF, Minko G, Liu CH, Rosen RB, Alfano RR. Detection of glutamate in the eye by Raman spectroscopy. J Biomed Opt. 2003;8:167–172. doi: 10.1117/1.1559726. [DOI] [PubMed] [Google Scholar]
- 17.Pappas D, Smith BW, Winefordner JD. Raman spectroscopy in bioanalysis. Talanta. 2000;51:131–144. doi: 10.1016/s0039-9140(99)00254-4. [DOI] [PubMed] [Google Scholar]
- 18.Sayari A, Hamoudi S. Periodic mesoporous silica-based organic - Inorganic nanocomposite materials. Chem Mater. 2001;13:3151–3168. [Google Scholar]
- 19.Schut TCB, Wolthuis R, Caspers PJ, Puppels GJ. Real-time tissue characterization on the basis of in vivo Raman spectra. J Raman Spectrosc. 2002;33:580–585. [Google Scholar]
- 20.Shim MG, Wilson BC, Marple E, Wach M. Study of fiber-optic probes for in vivo medical Raman spectroscopy. Appl Spectrosc. 1999;53:619–627. [Google Scholar]
- 21.Tsuda H, Arends J. Raman spectroscopy in dental research: a short review of recent studies. Adv Dent Res. 1997;11:539–547. doi: 10.1177/08959374970110042301. [DOI] [PubMed] [Google Scholar]
- 22.Stone N, Kendall C, Smith J, Crow P, Barr H. Raman spectroscopy for identification of epithelial cancers. Faraday Discuss. 2004;126:141–157. doi: 10.1039/b304992b. [DOI] [PubMed] [Google Scholar]
- 23.Fraenkel L. Diss Vratislaviae. Pressburg: 1835. De penitiori dentium humanorum structura observationis. [Google Scholar]
- 24.Balooch G, Marshall GW, Marshall SJ, Warren OL, Asif SA, Balooch M. Evaluation of a new modulus mapping technique to investigate microstructural features of human teeth. J Biomech. 2004;37:1223–1232. doi: 10.1016/j.jbiomech.2003.12.012. [DOI] [PubMed] [Google Scholar]
- 25.Goldberg M, Septier D, Bourd K, Hall R, Jeanny JC, Jonet L, Colin S, Tager F, Chaussain-Miller C, Garabedian M, George A, Goldberg H, Menashi S. The dentino-enamel junction revisited. Connect Tissue Res. 2002;43:482–489. doi: 10.1080/03008200290000817. [DOI] [PubMed] [Google Scholar]
- 26.Reid DJ, Dean MC. Variation in modern human enamel formation times. J Hum Evol. 2006;50:329–346. doi: 10.1016/j.jhevol.2005.09.003. [DOI] [PubMed] [Google Scholar]
- 27.Smith TM, Toussain M, Reid DJ, Olejniczak AJ, Hublin JJ. Rapid dental development in a Middle Paleolithic Belgian Neanderthal. Proc Natl Acad Sci USA. 2007;104:20220–20225. doi: 10.1073/pnas.0707051104. [DOI] [PMC free article] [PubMed] [Google Scholar]
- 28.Frushour BG, Koenig JL. Raman scattering of collagen, gelatin, and elastin. Biopolymers. 1975;14:379–391. doi: 10.1002/bip.1975.360140211. [DOI] [PubMed] [Google Scholar]
- 29.Wang Y, Spencer P. Analysis of acid-treated dentin smear debris and smear layers using confocal Raman microspectroscopy. J Biomed Mater Res. 2002;60:300–308. doi: 10.1002/jbm.10108. [DOI] [PubMed] [Google Scholar]
- 30.Renugopalakrishnan V, Carreira LA, Collette TW, Dobbs JC, Chandraksasan G, Lord RC. Non-uniform triple helical structure in chick skin type I collagen on thermal denaturation: Raman spectroscopic study. Z Naturforsch [C] 1998;53:383–388. doi: 10.1515/znc-1998-5-613. [DOI] [PubMed] [Google Scholar]
- 31.Kazanci M, Roschger P, Paschalis EP, Klaushofer K, Fratzl P. Bone osteonal tissues by Raman spectral mapping: orientation-composition. J Struct Biol. 2006;156:489–496. doi: 10.1016/j.jsb.2006.06.011. [DOI] [PubMed] [Google Scholar]
- 32.Kubisz L, Polomska M. FT NIR Raman studies on gamma-irradiated bone. Spectrochim Acta A Mol Biomol Spectrosc. 2007;66:616–625. doi: 10.1016/j.saa.2006.04.003. [DOI] [PubMed] [Google Scholar]
- 33.Jastrzebska M, Wrzalik R, Kocot A, Zalewska-Rejdak J, Cwalina B. Raman spectroscopic study of glutaraldehyde-stabilized collagen and pericardium tissue. J Biomater Sci Polym Ed. 2003;14:185–197. doi: 10.1163/156856203321142605. [DOI] [PubMed] [Google Scholar]
- 34.Begue-Kirn C, Krebsbach PH, Bartlett JD, Butler WT. Dentin sialoprotein, dentin phosphoprotein, enamelysin and ameloblastin: tooth-specific molecules that are distinctively expressed during murine dental differentiation. Eur J Oral Sci. 1998;106:963–970. doi: 10.1046/j.0909-8836.1998.eos106510.x. [DOI] [PubMed] [Google Scholar]
- 35.Nagano T, Oida S, Ando H, Gomi K, Arai T, Fukae M. Relative levels of mRNA encoding enamel proteins in enamel organ epithelia and odontoblasts. J Dent Res. 2003;82:982–986. doi: 10.1177/154405910308201209. [DOI] [PubMed] [Google Scholar]
- 36.Nanci A, Zalzal S, Lavoie P, Kunikata M, Chen W, Krebsbach PH, Yamada Y, Hammarstrom L, Simmer JP, Fincham AG, Snead ML, Smith CE. Comparative immunochemical analyses of the developmental expression and distribution of ameloblastin and amelogenin in rat incisors. J Histochem Cytochem. 1998;46:911–934. doi: 10.1177/002215549804600806. [DOI] [PubMed] [Google Scholar]
- 37.Chiang YC, Lee BS, Wang YL, Cheng YA, Chen YL, Shiau JS, Wang DM, Lin CP. Microstructural changes of enamel, dentin-enamel junction, and dentin induced by irradiating outer enamel surfaces with CO2 laser. Lasers Med Sci. 2008;23:41–48. doi: 10.1007/s10103-007-0453-y. [DOI] [PubMed] [Google Scholar]
- 38.Moreno EC, Aoba T. Comparative solubility study of human dental enamel, dentin, and hydroxyapatite. Calcif Tissue Int. 1991;49:6–13. doi: 10.1007/BF02555895. [DOI] [PubMed] [Google Scholar]
- 39.Tramini P, Pelissier B, Valcarcel J, Bonnet B, Maury L. A Raman spectroscopic investigation of dentin and enamel structures modified by lactic acid. Caries Res. 2000;34:233–240. doi: 10.1159/000016596. [DOI] [PubMed] [Google Scholar]
- 40.Robinson C, Shore RC, Brookes SJ, Strafford S, Wood SR, Kirkham J. The chemistry of enamel caries. Crit Rev Oral Biol Med. 2000;11:481–495. doi: 10.1177/10454411000110040601. [DOI] [PubMed] [Google Scholar]
- 41.Gron P, Spinelli M, Trautz O, Brudevold F. The effect of carbonate on the solubility of hydroxylapatite. Arch Oral Biol. 1963;8:251–263. doi: 10.1016/0003-9969(63)90016-5. [DOI] [PubMed] [Google Scholar]
- 42.Legeros RZ, Trautz OR, Legeros JP, Klein E, Shirra WP. Apatite Crystallites: Effects of Carbonate on Morphology. Science. 1967;155:1409–1411. doi: 10.1126/science.155.3768.1409. [DOI] [PubMed] [Google Scholar]
- 43.Roberson TM. Cariology: The lesion, etiology, prevention, and control. In: Roberson TM, Heymann HO, Swift EJ, editors. Sturdevant's Art and Science of Operative Dentistry. Mosby Elsevier; St Louis, MO: 2006. [Google Scholar]


