

Abstract
The FDA requires an accurate determination of the dose and potency of tissue engineered or combinational products as is required for drugs. This needs to be done as a rapid, quantitative and non-invasive measurement of biological function/activity in a way as not to perturb the tissue engineered product being developed.
Purpose
The aim of this study was to correlate constitutive release of cytokine(s) from unstimulated cells, at different stages of development within a three-dimensional (3D) organotypic ex vivo produced oral mucosa equivalent (EVPOME) to be used for intraoral grafting, with oral keratinocyte cell viability of the EVPOME.
Materials and methods
Tissue culture media was assayed with an ELISA from monolayer culture of oral keratinocytes and a 3D EVPOME to determine the constitutive release of IL-1α, IL-6, IL-8 and VEGF. VEGF mRNA expression by oral keratinocytes within the 3D EVPOME were detected by in situ hybridization at day 4, 7 and 11. The number of viable oral keratinocytes within the EVPOME was extrapolated from VEGF release using a modified MTT assay.
Results
Both VEGF release level and the number of viable cells in the monolayer cultures and 3D EVPOME as measured by MTT assay significantly increased in a time-dependent manner. (P< 0.001, r= 0.743).
Conclusions
These results suggest that the increasing detectable levels of VEGF associated with the increasing number of viable cells in the EVPOME may provide a useful non-invasive/non-destructive means of assessing both cellular viability (dose) and biological function/activity (potency) of a combinational cell-based device such as the EVPOME.
Keywords: oral keratinocyte, cytokine, tissue engineering, organotypic culture
INTRODUCTION
As technology advances in the field of regenerative medicine, new cell-based devices, such as our recently developed human oral mucosa, an ex vivo produced oral mucosa equivalent (EVPOME)1,2, as well as stem cell-based therapies, will create a need to generate new tools and standards for the development of safe and effective tissue engineered products. In addition, these cell-based devices, classified by the Food and Drug Administration (FDA) as combination products, are required to comply with the regulatory requirements of demonstrating and monitoring the product’s “dose and potency” during manufacturing of the cell therapy product. Dose and potency appear to be representative of cell viability and relevant biological function/activity of the EVPOME, (http://www.fda.gov/cber/summaries.htm) which provides a quantitative measurement of product quality. Moreover, for the final product, a rapid, sensitive and reliable release test including sterility tests needs to be done.
However, it is challenging to provide those conditions for tissue engineered products in comparison to drugs.1 Our previous human clinical trial with the EVPOME did not utilize any release criteria.2 Instead, the assessment of the transplanted graft was done retrospectively through histological evaluation of a manufactured companion EVPOME. According to those histological findings, a parallel manufactured EVPOME or a “representative” biopsy of EVPOME may not be indicative of the true status of the cellular component of the EVPOME that will be grafted into subjects. Although conventional histological examination can provide the final analysis of the graft, it is an invasive/destructive method. The “representative” biopsy is not only invasive but does not indicate the variations that can be seen in different manufactured EVPOMEs. The tests for an EVPOME cell-based device needs to be non-invasive so as not to destroy any of the EVPOME grafts for a clinical use prior to release and the results obtained in real time. It is thus essential that in order to determine and assure the quality of EVPOME prior to grafting, an immediate and non-invasive assay to determine the biological activity of EVPOME as well as the viable cell number should be developed. In an attempt to comply with FDA regulatory guidelines, in an ongoing clinical trial with EVPOME, glucose consumption rate in the tissue culture medium has been used as a release criterion.1 In order to be certain that the graft will function as anticipated, product specific assays will be necessary. One such means would be to assess the release of a constitutively produced cytokine.
To determine potential cytokine(s) for enabling quantitative measurement that characterizes EVPOME quality we investigated interleukin (IL)-1α, IL-6, IL-8 and vascular endothelial growth factor (VEGF) release because of the impact of these cytokines on wound healing of a free tissue graft. Oral mucosa keratinocytes are the major source of IL-1α3, which is an inflammatory cytokine and a regulator of IL-6 and IL-8 expressions. Epithelium derived IL-6 and IL–8 play multi-functional roles in keratinocyte proliferation, the host defense system as well as angiogenesis. 4,5,6
Several studies have shown that unstimulated oral keratinocytes can constitutively secrete cytokines. 7,8 One such cytokine is vascular endothelial growth factor (VEGF). VEGF is a potent mitogen for endothelial cells in vitro and shows angiogenic properties in vivo.9,10 VEGF produced by keratinocytes has been shown to play important roles in wound healing, 11,12,13 and is known to be constitutively secreted from keratinocytes in monolayer cultures. In addition VEGF is elevated in their activated phenotype,14 implying the capacity of VEGF production may be associated with the proliferating status of cells.
The aim of this study was to use an ELISA assay to measure levels of extracellularly constitutively secreted IL-1α, IL-6, IL-8 and VEGF into the culture medium from unstimulated monolayer culture of oral keratinocytes as well as from unstimulated oral keratinocytes within an EVPOME. In addition, we correlated the screened cytokine(s) release level with the number of viable keratinocytes as determined by a MTT assay. This allowed us to use constitutive secretion of cytokines into the tissue culture medium as a real time non-invasive assessment for viability and biological function/activity of EVPOME grafts and as an additional release criterion, to glucose consumption, prior to grafting into humans.
MATERIALS AND METHODS
Primary oral keratinocyte culture and manufacture of EVPOME
Cultures of human oral mucosal keratinocytes and the fabrication of EVPOME in a serum-free culture system without a feeder layer or pituitary extract have been previously described.1 Briefly, keratinized oral mucosa tissue was obtained from patients who have had dental tooth extractions or elective maxillofacial surgeries under an approved protocol by the institutional review board of the University of Michigan. The oral mucosa was incubated in 0.04% trypsin solution (Sigma, St. Louis, MO) overnight at room temperature, followed by neutralization with defined trypsin-inhibitor (Cascade Biologics, Portland, OR). Oral keratinocytes were then dissociated and cells amplified in a serum-free, chemically defined medium, EpiLife supplemented with EDGS (Cascade Biologics, Portland) containing 0.06mM Ca2+, 0.375μg/ml amphotericin B and 25 μg/ml Gentamycin (GIBCO/Invitrogen, Carlsbad, CA). For serial culture, primary oral keratinocytes were harvested by trypsin-EDTA (Cascade Biologics). Oral keratinocytes of passage number one or two were seeded, at a density of 1.5×10⁵ per 1 cm2 of circular AlloDerm® (LifeCell Corp., Branchburgh, NJ), a well size of 48 well-plate, pre-coated with human type IV collagen (Sigma-Aldrich, St. Louis, MO). The oral keratinocyte-AlloDerm® composites were cultured submerged for the first four days with an increase in calcium concentration to 1.2mM and then transferred to an air-liquid interface for an additional 7 days, which is referred to as Day 11 EVPOME.
Measurement of constitutive cytokine (IL-1α, IL-6, IL-8, VEGF) secretion from unstimulated oral keratinocyte monolayer cultures and Day 11 EVPOME
A total of 3×10⁴ oral mucosa keratinocytes of passage number one or two were plated in each well of 24 well-plates (N=12 or 6 (IL-6)) and allowed to attach overnight. When reached at 60–70% confluency, cell-free supernatant was collected at an interval of 24 hours of medium change. The conditioned media from three pieces of Day 11 EVPOME (N=6 or 3 (IL-6)) were also collected at an interval of 24 hours of medium change and stored at −70° C. All samples were done at the same time with an ELISA assay. ELISA assays were performed using the Quantikine immunoassay kits (IL-1α, IL-6, IL-8 and VEGF: R&D system, Minneapolis, MN, USA) according to the manufacture’s instructions. Briefly, 200μl of conditioned medium, controls or standards were added on each well coated with a mouse monoclonal antibodies. After 2h of incubation, wells were washed and incubated with horseradish peroxidase-linked polyclonal antibodies. Following another wash, a substrate solution was added to wells. The optical density value was read on an ELISA reader with absorbance wavelength of 450nm. The concentrations of those cytokines were determined by the standard curve. One sample was measured in triplicate.
For the further correlation study, cells were used for either manufacturing EVPOMEs or for use in the MTT assay. EVPOME harvested at 4, 7, 11 days was cut into quarters. One quarter piece was fixed with 10% formalin, embedded in paraffin, then 5μm sections were stained with hematoxylin and eosin. The other three were used for the following MTT analysis.
MTT assay
Concurrent with EVPOME manufacturing, the harvested cells (twenty different samples or subjects) were seeded into a 48-well plate to make an individual calibration curve by the MTT assay, based on the cleavage of tetrazolium salt (MTT) to formazan crystals by metabolically active cells. Various numbers of cells (1×10⁴, 2×10⁴, 4×10⁴, 6×10⁴) were plated in each well of 200μl/well and cultured at 37°C in a humidified 5% CO2 incubator overnight. 20μl of MTT (Roche Molecular Biochemicals, IN) was added to each well (final concentration 0.5mg/ml), and plates were incubated at 37°C for 4h. Finally, 200μl of acidified isopropanol (0.04 N HCl in isopropanol) was added to all wells to dissolve the purple crystals. The solutions were retrieved and read within 30 min using a microtiter plate reader (Labsystems, Franklin, MA). The measure wavelength was 570nm, and then the best fit line (standard regression line) was constructed by regression analysis between the plated cell numbers and absorbance optical density values.
A modified MTT assay was performed to extrapolate the number of viable cells present within the EVPOMEs, based on the 48-well plate monolayer culture (N=20). One quarter piece of Day 4, 7, 11 EVPOME was immersed in 100μl medium with 10μl MTT at 37°C for 4h, the crystals were dissolved and the optical density value was determined as previously described. Two quarter pieces were tested and the mean optical density value of a quarter piece of EVPOME was calculated. From the optical density values obtained from the modified MTT assay and MTT assay in monolayer culture, the viable number of cells within the EVPOME extrapolated from the standard line of the monolayer culture.
Frozen section from the last quarter piece of EVPOME was examined to observe the formation of MTT formazan crystals in the EVPOME to detect viable cell localization in five samples. After the EVPOME pieces were reacted with MTT mentioned above, they were frozen in OCT compounds (Sakura Finetek, CA, USA) on dry ice and then cut into 8μm sections, no stains were performed.
VEGF release level at day 4, 7, 11 EVPOME
One piece of EVPOME was cultured in one culture insert in this measurement. 1 ml conditioned culture medium of day 4, 7, 11 EVPOME was harvested with an interval of 24 hours. The measurement protocol by ELISA was above mentioned. The VEGF concentrations (pg/mL) were multiplied by either volume of the submerged culture (1.2mL, Day 4) and an air-liquid interface (8.3mL, Days 7 and 11) due to the difference in the culture vessel volume.
In situ hybridization (ISH)
Digoxigenin (DIG)-labelled ISH was performed using the method in our laboratory, as described previously.15 In brief, Day 11 EVPOME sections were prepared and fixed in 4% paraformaldehyde in PBS, followed by treatment with Tris-HCl and digestion with proteinase K. The tissues were hybridized overnight. After hybridization, signals were visualized with anti-DIG-alkaline phoshatase antibody and 5-bromo-4-chloro-3-indolyl-phosphate as a substrate, using a Nucleic Acid detection kit (Roche Molecular Biochemicals), as described previously.
Statistical analyses
Results were expressed as mean ± S.D., with n referring to the number of experiments. Repeated-measures one-way ANOVA were applied to determine the differences among means of each group. A linear regression analysis was made to reveal the correlation between VEGF release level and the viability of EVPOME. A value of p< 0.05 was considered significant.
RESULTS
Baseline cytokine (IL-1α, IL-6, IL-8, VEGF) release level from oral keratinocyte monolayer culture and Day 11 EVPOME and screening
The cytokine levels in the conditioned media are shown in Table 1. All cytokines measured for screening were constitutively produced by cultured oral keratinocytes in a 2D monolayer as well as a 3D EVPOME. Although their baseline release showed different patterns, the cytokine release levels from the 3D EVPOME dropped. IL-1α production level was low in both monolayer culture and EVPOME. IL-6 produced was very a little from EVPOME. In contrast, oral keratinocytes in monolayer and Day 11 EVPOME secreted a larger amount of IL-8 and VEGF. However, IL-8 release level decreased markedly from the 2D monolayer to the 3D EVPOME when compared to VEGF release levels.
Table 1.
Difference of four cytokine release level between 2D (monolayer) and 3D (Day 11 EVPOME) culture. Values indicate mean ±SE.
| Monolayer culture (24 well, ≃2cm2) | Day 11 EVPOME (3 pieces, ≃3cm2) | |
|---|---|---|
| IL-1α | 63.84±14.97pg/mL (N=12) | 27.84±2.31pg/mL (N=6) |
| IL-6 | 288.85±38.49pg/mL (N=6) | 0.49±0.07pg/mL (N=3) |
| IL-8 | 1117.75±274.03pg/mL (N=12) | 237.46±17.9pg/mL (N=6) |
| VEGF | 909.2±213.35pg/mL (N=12) | 410.33±41.07pg/mL (N=6) |
Since this study attempted to investigate “dose and potency”, we concentrated on the secretion of only VEGF into the culture medium from the 3D organotypic cultures because VEGF had the highest secretion levels of all four cytokines.
Development of individual calibration curves
In this investigation we utilized primary oral keratinocytes from twenty donors. This required the development of individualized calibration curves for each MTT assay from a monolayer of primary oral keratinocyte that was used to determine the cell viability of our cells grown in a 3D organotypic culture system, an EVPOME. A representative MTT assay correlated to viability of cells grown in a monolayer is shown in Figure 1. One notes in Figure 1a the presence of MTT formazan crystals within metabolic active cells while non-active cells were devoid of these crystals. Figure 1b illustrates the direct correlation of cell viability/number of cells in a monolayer culture with optical density as measured spectrometrically. A linear relationship between optical densities and the cell numbers plated at the cell values of 1×10⁴, 2×10⁴, 4×10⁴, 6×10⁴ was consistently observed when the individual calibration curves were made (r2 of the curves ranged from 0.963 to 0.996).
FIGURE 1.
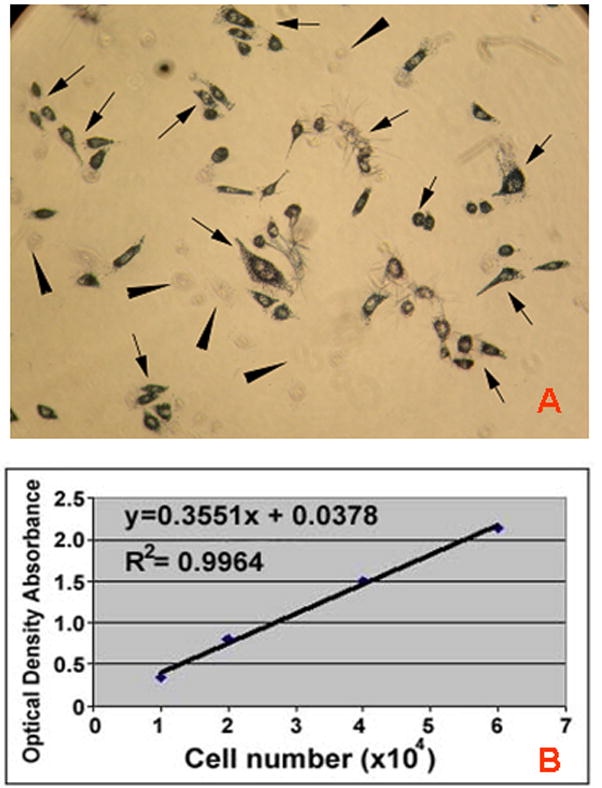
Representative MTT assay for a primary cell culture for oral keratinocytes (a) Evidence of the presence of MTT formazan crystals developed in a monolayer of cultured viable oral keratinocytes (arrows). Note absence of formazan crystals in non-viable cells (arrowheads). (b) A typical calibration curve for primary cells showing a linear relationship between optical densities (cell viability) and the known plated cell numbers.
Manufacture of the EVPOME
A monolayer of cells was present at day 4 when the EVPOMEs are grown submerged (Fig 2a). Once the EVPOME is raised to an air-liquid interface, the cells started stratification with a number of layers directly correlated to number of days in culture (Fig 2b, c). At day 11 a well-stratified epithelial layer with the presence of parakeratinization was evident (Fig 2c).
FIGURE 2.
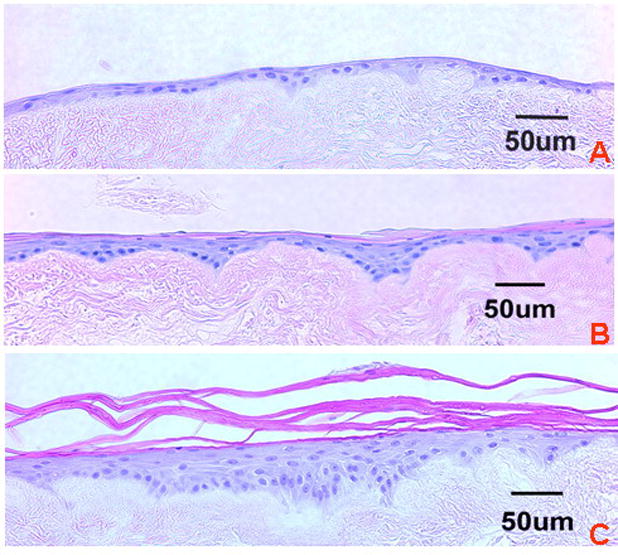
Histology of: (a) Day 4, (b) Day 7, and (c) Day 11 EVPOMEs. Note difference in stratification of the epithelial layer that is correlated with the number of cells and thickness of basal and parabasal cell layers. (Hematoxylin and eosin staining; Scale bar = 50μm)
Number of Viable Cells on an EVPOME
The number of viable oral keratinocytes was calculated by performing a modified MTT assay on an EVPOME at several stages of fabrication; days 4, 7 and 11. All of the formazan crystal positive cells were localized to the basal layer and suprabasal layer (underlies keratinized layer) as seen in a day 11 EVPOME (Fig 3a). The viable number of cells on an EVPOME was extrapolated from the calibration curve developed from the same population of cells grown in a monolayer. Differences in viability were observed during the three stages of development of the EVPOME (day 4, 7, 11). The number of viable cells on the EVPOME consistently increased over days in culture, in a time-dependent manner (p< 0.01) (Fig 3b) as was anticipated as the suprabasal cell layers increased in number secondary to stratification. The mean extrapolated viable cell numbers at the three stages of EVPOME (0.25cm2) were (16.74 ±4.44) × 103, (32.45 ±5.95) × 103 and (43.64 ±8.99) × 103 at day 4, day 7 and day 11, respectively. A repeated-measure one-way ANOVA and the Tukey post-hoc test were used to compare differences among these three groups. Significant differences between each two groups were observed (p< 0.001, n =20).
FIGURE 3.
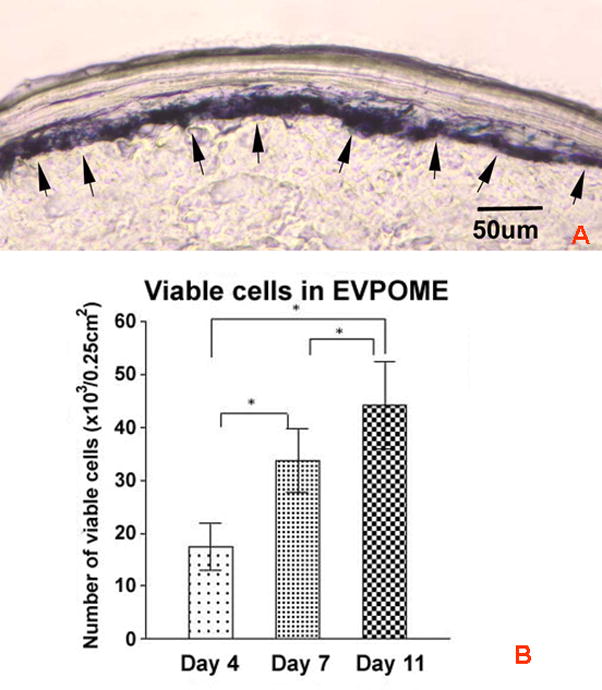
Detection of cell viability on the EVPOME using a MTT assay. (a) Formazon crystals (arrows) from the MTT assay are visible and localized in the basal and suprabasal layer cells of a Day 11 EVPOME. (Frozen section, Scale bar=50um; Original magnification; × 200) (b) An increase in numbers of viable cells within the EVPOME is detected as the culturing period (day 4, 7 and 11) and increase in stratification of the epithelial layer occurs. A repeated-measure one-way ANOVA and the Tukey post-hoc test were used to compare differences among these three groups. Significant differences between each two groups were observed (*, p< 0.001, n =20).
Release level of VEGF from three different stages of 3D EVPOME
We observed a significant difference in VEGF release into the supernatant over days in culture (Fig 4). At day 11, the mean VEGF release level was the highest (719.7 ±119.7 pg) comparing with day 7 (608.9 ±83.31 pg) and day 4 (395.2 ±61.14 pg) (p< 0.001). A repeated-measure one-way ANOVA and the Tukey post-hoc test showed significant differences between the three stages of EVPOME development (p< 0.001, n =20).
FIGURE 4.
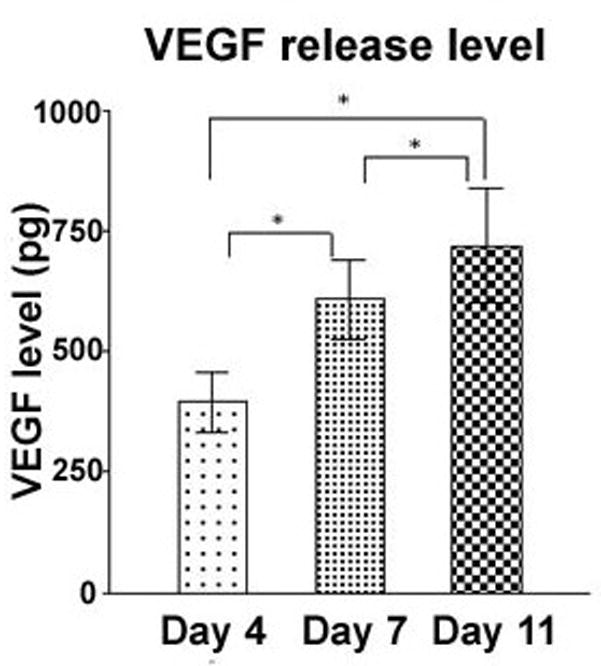
Time-dependent release of VEGF by oral keratinocytes on the EVPOME. A repeated-measure one-way ANOVA and the Tukey post-hoc test were used to compare differences among these three groups. Significant differences between each two groups were observed (*, p< 0.001, n =20).
Correlation between viability and VEGF release by EVPOME
A linear regression analysis was performed to correlate the amount of constitutive release of VEGF to the stage of EVPOME development, and number of viable cells on the EVPOME. A positive correlation was seen between the viable cells numbers in the EVPOME and the amount of VEGF released into the supernatant with a correlation coefficient of 0.743 and a p< 0.001 with a sample size of 20 (Fig 5).
FIGURE 5.
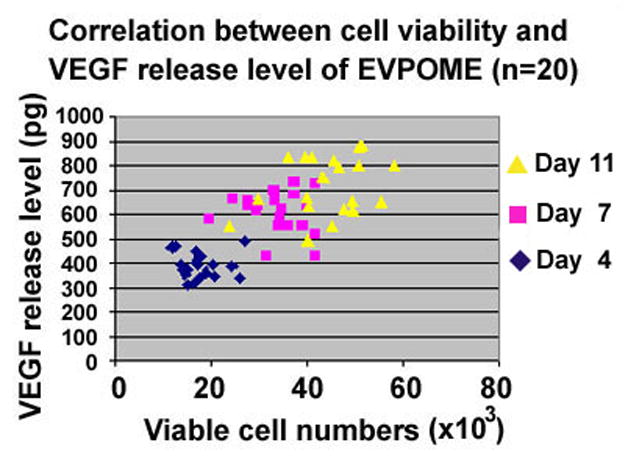
Significant correlation was observed between cell viability, days in culture and VEGF release into the culture medium. Correlation coefficient was 0.743 (p< 0.001).
In situ hybridization (ISH) of Day 11 EVPOME
To confirm that VEGF mRNA expression pattern in EVPOME is consistent with the viable cell localization by the modified MTT assay (Fig 3a), a day 11 EVPOME was examined by ISH. The entire basal and parabasal cells of Day 11 EVPOME expressed VEGF mRNA (Fig 6a). In contrast, the upper most keratinized layer lacked the expression of VEGF mRNA. VEGF sense probe showed no specific signals for VEGF mRNA (Fig 6b).
FIGURE 6.
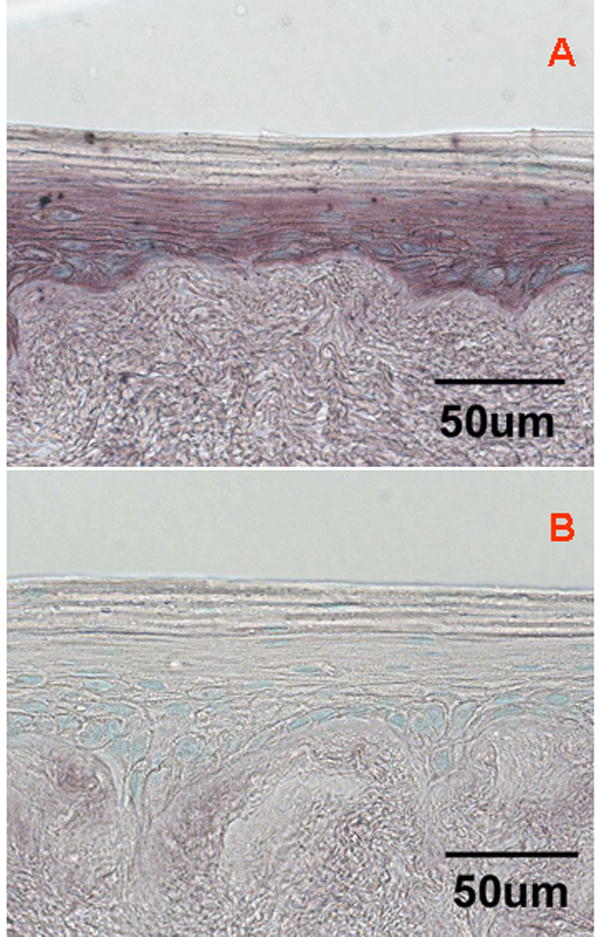
In situ hybridization of Day 11 EVPOME. (a) anti-sense probe: Note VEGF mRNA expression is localized in basal and parabasal cell layers. The uppermost keratinized layer lacked any expression of VEGF mRNA. (b) sense probe: As a negative control, hybridization with the VEGF sense probe does not show any signal. (Scale bar = 50um; Original magnification; x400)
DISCUSSION
At present EVPOMEs are evaluated by the glucose consumption/utilization assay in the conditioned culture medium prior to release of the EVPOME for intraoral grafting for quality assurance.1 This assay is indicative of the metabolic activity of the cellular component of the EVPOME, thus, indirectly correlating with cell viability.16 It is a simple, rapid and practical method for screening the metabolic activity of EVPOME; however this method is limited in its reflection of the biological function/activity of the viable cells on the EVPOME. It was also noted that the histological analysis of companion grafts, manufactured in parallel, showed that the thickness of the epithelial layer of EVPOMEs varied among different individuals as well as among the specimens obtained from the same pool of identical autogenous oral keratinocytes. Therefore the histological assessment of a parallel manufactured graft or “biopsy” of the EVPOME taken from the periphery of the construct may not indicate the actual or overall status of the EVPOME that will be grafted into subjects. To meet the FDA requirements of demonstrating the graft’s “dose and potency”, noninvasive and quantitative methods to measure viability and biological activity are needed. In addition, many studies emphasized the importance of using multiple approaches to assess cell viability to avoid the bias in a single assay system.17,18
One of the means of assessing both cellular activity and biological function is through proteomics. Epidermis has been identified as not only a barrier tissue but also a secretory tissue.19 Thus, there are several cytokines that can be utilized as oral keratinocyte biomarkers. Protein biomarker detection can provide more accurate biological information of the culture products20 and, therefore, might be a more effective and efficient approach to assess and predict the biologic activity of the EVPOME. The appropriate candidate biomarkers should be constitutively produced by keratinocytes as it is important to not introduce any inducible substances that might perturb the manufacturing process. In addition they should be released extracellularly to assist in their easy detection as well as play an important functional role in the successful engraftment of the EVPOME, such as, in wound healing where they could also be prognostic indicators of graft success in situ. Most importantly, these assays should be non-invasive/non-destructive in nature so as not to compromise the cell-based device to be grafted into subjects.
To screen potential biomarkers, the cytokine release levels from Day 11 EVPOME showed that all cytokines appeared to be constitutively produced without any stimulation. However, it appeared IL-6 is infeasible due to the trace amount. Compared with the release levels in monolayer culture in which the majority of cells are viable, IL-8 production from Day 11 EVPOME in which viable and non-viable cells are present decreased more than that of IL-1α and VEGF. Using living skin equivalents, two studies showed IL-8 immunoreaction in the epithelial layer was attenuated as days lapsed.21,22 The production level of IL-1α was much lower than that of VEGF. Dekker reported IL-1α immunostaining in the epithelial layer of skin equivalent was diffuse and weak, and expressed in only the upper suprabasal layers. 23 This is consistent with the low amount of IL-1α released in this study. The expression pattern of IL-1α and IL-8 might not be consistent with the viable cell localization in the tissue-engineered product. In contrast, VEGF secretion did not decrease as much as interleukins from EVPOME. Our previous study demonstrated the soluble VEGF molecules were intensely immunostained in basal and suprabasal layers in EVPOME. 15 Thus, VEGF was chosen as a cytokine biomarker, and its relationship between the metabolic activity of EVPOME by MTT assay and the release level quantitatively was measured over different days in culture.
Our major objective for assessing cell viability on the EVPOME is to determine its metabolic activity which will give us a sense of its self-renewal capacity and ability to survive grafting. A MTT assay has been shown to be a useful tool to assess cell viability, is sensitive to the cellular metabolic activity24 and has shown efficacy when applied to a three-dimensional cultured human skin model.25,26 In our study, the viable cell number of EVPOME was extrapolated from the individual calibration curves of the companion monolayer keratinocytes culture by the MTT assay. Individualized calibration curves for the MTT assay showed a direct correlation between optical densities and cell numbers in monolayer cultures using companion cells. Thus, it appears that the modified MTT assay data was able to detect the number of viable cells present in the EVPOME at day 4, 7 and 11. The Day 11 EVPOME frozen section showed that the majority of MTT reaction products were present in the basal and suprabasal layers in which viable cells are located. This was consistent with the VEGF expression pattern in Day 11 EVPOME found at both mRNA and protein levels. 15 It is thus likely that the oral keratinocytes in basal and suprabasal layers within the EVPOME are the viable cells that also secret VEGF. Since mitosis has been present in the basal layer of normal epithelium giving rise to daughter cells that move upward and differentiate to form the keratinized layer,27 this suggested tissue renewal and differentiation seen within the EVPOME is similar to that in native oral mucosa.
In EVPOME, a statistically significant positive correlation was present between the number of viable cells and VEGF levels detected in culture medium (r=0.743, p<0.001) indicating that the VEGF level secreted from EVPOME directly correlated with the extrapolated keratinocyte viability in EVPOME. It is thus possible that VEGF levels in the culture medium measured by ELISA can be used as a biomarker to monitor the number of metabolically active cells in an EVPOME and as an additional release criterion. This method would allow us to monitor and measure “dose and potency” of EVPOME efficiently, rapidly and non-invasively during its manufacture process prior to grafting.
The correlation determination (r2=0.553) means that 55.3% of the secreted VEGF data is accounted for by the linear relationship. This modest result might be due to the variation of the thickness of the viable cell layers among individuals and/or different ratios of VEGF isoforms, soluble vs insoluble, produced by the oral keratinocytes.28 To improve the non-invasive assessment of the EVPOME with biomakers, additional biomarkers released constitutively and extracellularly without any stimulation should be utilized in conjunction with VEGF to enhance accuracy.
Another potential marker is human beta defensin 1 (hBD-1), an innate antimicrobial peptide that is constitutively produced by oral keratinocytes who can also secrete hBD-2 and hBD-3 after stimulation. 29 We have shown that surface enhanced laser desorption/ionization (SELDI) technology can detect different protein profiles of supernatant at different stages of fabrication of EVPOMEs (unpublished data). On the gel protein profile, proteins that contain hBD1 (5068 Da) were visualized and increased once EVPOME was cultured at an air-liquid interface. Although SELDI is appealing, the current feasibility is limited because this is a semi-quantitative assay, and the protein identity needs to be confirmed by using specific immunoaffinity capture on ProteinChip Arrays. Another potential biomarker would be measuring apoptosis markers such as caspase 3/7 that could be an inverted cell “viability” assay. However, this is an invasive analysis. In addition, although measuring lactate dehydrogenase (LDH) release into supernatant is a non-invasive assay, this is not beneficial since it is indicative of cell death not viability. In the future, by measuring multiple biomarkers and/or multiplex assays, one could develop a more practical and feasible non-invasive technique to predict post-grafting results of EVPOME grafts accurately and to facilitate the criteria for quality control and assurance and the release testing of the cell-based combination device.
In conclusion, we demonstrated that both the number of viable cells and the secreted amount of VEGF increased during the manufacturing process of an EVPOME which is a tissue engineered cell-based device. In addition, a positive relationship between VEGF production and the number of viable cells was present. Our results suggest that the release level of VEGF could be useful as a biomarker suitable to validate the quality of the cellular component of the EVPOME and reflect “dose and potency” of the product. Further studies with more individuals and with other constitutively released biomarkers are necessary.
Acknowledgments
We would like to thank Kathleen Welch for statistical analysis and Judi Schmitt for her assistance in culturing oral keratinocytes and laboratory expertise. This work was supported by DE 13417 and DE 15784 grants from the NIDCR/NIH:, awarded to SEF.
Footnotes
Publisher's Disclaimer: This is a PDF file of an unedited manuscript that has been accepted for publication. As a service to our customers we are providing this early version of the manuscript. The manuscript will undergo copyediting, typesetting, and review of the resulting proof before it is published in its final citable form. Please note that during the production process errors may be discovered which could affect the content, and all legal disclaimers that apply to the journal pertain.
References
- 1.Izumi K, Song J, Feinberg SE. Development of a Tissue-Engineered Human Oral Mucosa: From the Bench to the Bed Side. Cells Tissues Organs. 2004;176(1–3):134–152. doi: 10.1159/000075034. [DOI] [PubMed] [Google Scholar]
- 2.Izumi K, Feinberg SE, Iida A, Yoshizawa M. Intraoral grafting of an ex vivo produced oral mucosa equivalent: a preliminary report. Int J Oral Maxillofac Surg. 2003;32(2):188–97. doi: 10.1054/ijom.2002.0365. [DOI] [PubMed] [Google Scholar]
- 3.Sfakianakis A, Barr CE, Kreutzer DL. Actinobacillus actinomycetemcomitans-induced expression of IL-1alpha and IL-1beta in human gingival epithelial cells: role in IL-8 expression. Eur J Oral Sci. 2001;109(6):393–401. doi: 10.1034/j.1600-0722.2001.00162.x. [DOI] [PubMed] [Google Scholar]
- 4.Niyonsaba F, Ushio H, Nakano N, Ng W, Sayama K, Hashimoto K, Nagaoka I, Okumura K, Ogawa H. Antimicrobial peptides human beta-defensins stimulate epidermal keratinocyte migration, proliferation and production of proinflammatory cytokines and chemokines. J Invest Dermatol. 2007;127(3):594–604. doi: 10.1038/sj.jid.5700599. [DOI] [PubMed] [Google Scholar]
- 5.Grone A. Keratinocytes and cytokines. Vet Immunol Immunopathol. 2002;6;88(1–2):1–12. doi: 10.1016/s0165-2427(02)00136-8. [DOI] [PubMed] [Google Scholar]
- 6.Sfakianakis A, Barr CE, Kreutzer DL. Localization of the chemokine interleukin-8 and interleukin-8 receptors in human gingiva and cultured gingival keratinocytes. J Periodontal Res. 2002;37(2):154–60. doi: 10.1034/j.1600-0765.2002.00024.x. [DOI] [PubMed] [Google Scholar]
- 7.Formanek M, Knerer B, Temmel A, Thurnher D, Millesi W, Kornfehl J. Oral keratinocytes derived from the peritonsillar mucosa express the proinflammatory cytokine IL-6 without prior stimulation. J Oral Pathol Med. 1998;27(5):202–6. doi: 10.1111/j.1600-0714.1998.tb01942.x. [DOI] [PubMed] [Google Scholar]
- 8.Coquette A, Berna N, Vandenbosch A, Rosdy M, De Wever B, Poumay Y. Analysis of interleukin-1alpha (IL-1alpha) and interleukin-8 (IL-8) expression and release in vitro reconstructed human epidermis for the prediction of in vivo skin irritation and/or sensitization. Toxicol In Vitro. 2003;17(3):311–21. doi: 10.1016/s0887-2333(03)00019-5. [DOI] [PubMed] [Google Scholar]
- 9.Ribatti D. The crucial role of vascular permeability factor/vascular endothelial growth factor in angiogenesis: a historical review. Br J Haematol. 2005;128(3):303–9. doi: 10.1111/j.1365-2141.2004.05291.x. [DOI] [PubMed] [Google Scholar]
- 10.Ferrara N. VEGF: an update on biological and therapeutic aspects. Curr Opin Biotechnol. 2000;11(6):617–24. doi: 10.1016/s0958-1669(00)00153-1. [DOI] [PubMed] [Google Scholar]
- 11.Szpaderska AM, Walsh CG, Steinberg MJ, DiPietro LA. Distinct patterns of angiogenesis in oral and skin wounds. J Dent Res. 2005;84(4):309–14. doi: 10.1177/154405910508400403. [DOI] [PubMed] [Google Scholar]
- 12.Coste A, Brugel L, Maitre B, Boussat S, Papon JF, Wingerstmann L, et al. Inflammatory cells as well as epithelial cells in nasal polyps express vascular endothelial growth factor. Eur Respir J. 2000;15(2):367–72. doi: 10.1034/j.1399-3003.2000.15b24.x. [DOI] [PubMed] [Google Scholar]
- 13.Boussat S, Eddahibi S, Coste A, Fataccioli V, Gouge M, Housset B, et al. Expression and regulation of vascular endothelial growth factor in human pulmonary epithelial cells. Am J Physiol Lung Cell Mol Physiol. 2000;279(2):L371–8. doi: 10.1152/ajplung.2000.279.2.L371. [DOI] [PubMed] [Google Scholar]
- 14.Trompezinski S, Denis A, Vinche A, Schmitt D, Viac J. IL-4 and interferon-gamma differentially modulate vascular endothelial growth factor release from normal human keratinocytes and fibroblasts. Exp Dermatol. 2002;11(3):224–31. doi: 10.1034/j.1600-0625.2002.110305.x. [DOI] [PubMed] [Google Scholar]
- 15.Nakanishi Y, Izumi K, Yoshizawa M, Saito C, Kawano Y, Maeda T. The Expression and Production of Vascular Endothelial Growth Factor in Oral Mucosa Equivalents. Int J Oral Maxillofac Surg. 2007;36(10):928–33. doi: 10.1016/j.ijom.2007.06.013. [DOI] [PubMed] [Google Scholar]
- 16.Meuwly F, Papp F, Ruffieux PA, Bernard AR, Kadouri A, von Stockar U. Use of glucose consumption rate (GCR) as a tool to monitor and control animal cell production processes in packed-bed bioreactors. J Biotechnol. 2006;122(1):122–9. doi: 10.1016/j.jbiotec.2005.08.005. [DOI] [PubMed] [Google Scholar]
- 17.Vasiliev AV, Kiseliov IV, Ivanov AA, Fedorov DN, Smirnov SV, Terskikh VV. Preservation of human skin: viability criteria. Annals of Burns and Fire Disasters. 2002;15(3):145–50. [Google Scholar]
- 18.Marzullo P, Parodi O, Sambuceti G, Reisenhofer B, Gimelli A, Giorgetti A, et al. Myocardial viability: nuclear medicine versus stress echocardiography. Echocardiography. 1995;12(3):291–302. doi: 10.1111/j.1540-8175.1995.tb00552.x. [DOI] [PubMed] [Google Scholar]
- 19.Boyce ST. Epidermis as a secretory tissue. J Invest Dermatol. 1994;102(1):8–10. doi: 10.1111/1523-1747.ep12371721. [DOI] [PubMed] [Google Scholar]
- 20.Hatzimanikatis V, Choe LH, Lee KH. Proteomics: theoretical and experimental considerations. Biotechnol Prog. 1999;15(3):312–8. doi: 10.1021/bp990004b. [DOI] [PubMed] [Google Scholar]
- 21.Barker CL, McHale MT, Gillies AK, Waller J, Pearce DM, Osborne J, Hutchinson PE, Smith GM, Pringle JH. The development and characterization of an in vitro model of psoriasis. J Invest Dermatol. 2004;123(5):892–901. doi: 10.1111/j.0022-202X.2004.23435.x. [DOI] [PubMed] [Google Scholar]
- 22.Konstantinova NV, Duong DM, Remenyik E, Hazarika P, Chuang A, Duvic M. Interleukin-8 is induced in skin equivalents and is highest in those derived from psoriatic fibroblasts. J Invest Dermatol. 1996;107(4):615–21. doi: 10.1111/1523-1747.ep12584215. [DOI] [PubMed] [Google Scholar]
- 23.Dekker P, Parish WE, Green MR. Protection by food-derived antioxidants from UV-A1-induced photodamage, measured using living skin equivalents. Photochem Photobiol. 2005;81(4):837–42. doi: 10.1562/2005-02-03-RA-432. [DOI] [PubMed] [Google Scholar]
- 24.Takahashi S, Abe T, Gotoh J, Fukuuchi Y. Substrate-dependence of reduction of MTT: a tetrazolium dye differs in cultured astroglia and neurons. Neurochem Int. 2002;40(5):441–8. doi: 10.1016/s0197-0186(01)00097-3. [DOI] [PubMed] [Google Scholar]
- 25.Watanabe T, Hasegawa T, Takahashi H, Ishibashi T, Itagaki H, Sugibayashi K. Utility of MTT assay in three-dimensional cultured human skin model as an alternative for draize skin irritation test: approach using diffusion law of irritant in skin and toxicokinetics-toxicodynamics correlation. Pharm Res. 2002;19(5):669–75. doi: 10.1023/a:1015366331634. [DOI] [PubMed] [Google Scholar]
- 26.Tornier C, Rosdy M, Maibach HI. In vitro skin irritation testing on reconstituted human epidermis: Reproducibility for 50 chemicals tested with two protocols. Toxicol In Vitro. 2006;20(4):401–16. doi: 10.1016/j.tiv.2005.09.004. [DOI] [PubMed] [Google Scholar]
- 27.Squier CA, Kremer MJ. Biology of oral mucosa and esophagus. J Natl Cancer Inst Monogr. 2001;29:7–15. doi: 10.1093/oxfordjournals.jncimonographs.a003443. [DOI] [PubMed] [Google Scholar]
- 28.Viac J, Palacio S, Schmitt D, Claudy A. Expression of vascular endothelial growth factor in normal epidermis, epithelial tumors and cultured keratinocytes. Arch Dermatol Res. 1997;289(3):158–63. doi: 10.1007/s004030050172. [DOI] [PubMed] [Google Scholar]
- 29.Diamond DL, Kimball JR, Krisanaprakornkit S, Ganz T, Dale BA. Detection of beta-defensins secreted by human oral epithelial cells. J Immunol Methods. 2001;256(1–2):65–76. doi: 10.1016/s0022-1759(01)00442-2. [DOI] [PubMed] [Google Scholar]