Abstract
Objective
In patients with intractable epilepsy, the use of interictal spikes as surrogate markers of the epileptogenic cortex has generated significant interest. Previous studies have suggested that the cortical generators of the interictal spikes are correlated with the epileptogenic cortex as identified from the ictal recordings. We hypothesize that causal analysis of the functional brain networks during interictal spikes are correlated with the clinically-defined epileptogenic zone.
Methods
We employed a time-varying causality measure, the adaptive directed transfer function (ADTF), to identify the cortical sources of the interictal spike activity in eight patients with medically intractable neocortical onset epilepsy. The results were then compared to the foci identified by the epileptologists.
Results
In all eight patients, the majority of the ADTF-calculated source activity was observed within the clinically-defined SOZs. Furthermore, in 3 of the 5 patients with two separate epileptogenic foci, the calculated source activity was correlated with both cortical sites.
Conclusions
The ADTF method identified the cortical sources of the interictal spike activity as originating from the same cortical locations as the recorded ictal activity.
Significance
Evaluation of the sources of the cortical networks obtained during interictal spikes may provide information as to the generators underlying the ictal activity.
Keywords: epilepsy, interictal spike, connectivity, source localization
I. Introduction
Epilepsy is one of the most common neurological disorders with an estimated worldwide incidence of 0.5 to 1%. While advances in pharmacologic agents have aided in the treatment and suppression of epileptic events, a significant number of patients continue to have uncontrolled seizures despite optimal medical management. In these cases, surgical intervention is at times the only remaining option if standard medical therapies have failed. If the cortical regions responsible for the initiation and propagation of the ictal activity - the so-called epileptogenic zone - are found to be focal in nature and confined to non-eloquent cortex, they may be surgically removed to alleviate the patient's symptoms.
Electrocorticogram (ECoG) recordings are used to aid in the localization of the epileptogenic zone in a majority of these surgical candidates (Engel and Ojemann, 1993). This technique, which involves recording from localized intracranial sites for extended periods of time, has remained largely unchanged over the past 50 years (Walker, 1949; Penfield and Jasper, 1954). Today, in the absence of abnormalities on structural imaging studies, the clinical gold standard for determining the location and extent of the epileptogenic zone remains ECoG analysis of the ictal activity (Ebersole and Pedley, 2003).
In addition to ictal activity, interictal spikes are also assumed to be markers of the epileptogenic cortex. The localization of the seizure-generating regions of cortex from interictal spikes has drawn significant interest due to their abundance compared to the relatively rare ictal events. However, the precise relationship between the seizure onset zone (SOZ) and interictal spike activity remains somewhat amorphous. Numerous studies have shown that positive surgical outcome does not necessarily depend upon resection of the entire region displaying spiking activity (Tran et al., 1995; Kanazawa et al., 1996; Alarcon et al., 1997; Ebersole 2000; Ulbert et al., 2004). While these studies have indicated that the presence of interictal spike activity is not a good measure by which to determine the SOZ, other studies have examined the propagation patterns of the interictal spikes as a surrogate for defining the cortical generators of the ictal activity. The propagation of interictal spikes from the generating regions has been known for some time (Penfield and Jasper, 1954), although recent advances in computational techniques have made this type of analysis more practical. In animal models of epilepsy, studies in cortical slices have shown the epileptiform activity to arise from considerably focal regions of cortex (Tsau et al., 1999; Wu et al., 1999). Similarly in humans, a study by Alarcon et al (1997) found that resection of the regions which acted as pacemakers of the interictal activity was associated with improved post-surgical outcome (Alarcon et al., 1997). More recently, a study performed by Lai et al (2007) has shown that analysis of the time latency during interictal spike propagation can be used to estimate the SOZ in a cohort of epileptic patients (Lai et al., 2007).
Due to the observed propagation of the interictal spike activity from the source region to the surrounding cortex, techniques to estimate brain connectivity could be potentially useful in identification of the SOZ. The majority of these techniques estimate the flow of information throughout the brain based upon the concept of Granger causality (Granger, 1969). Several of these methods have been shown to successfully locate the sources of brain activity in both patients with epilepsy as well as normal subjects performing standard neuroscience paradigms (Friston, 1994; Kaminski et al., 1997; Baccala and Sameshima, 2001; Baccala et al., 2004; Brovelli et al., 2004; Astolfi et al., 2005; Babiloni et al., 2005; Astolfi et al., 2007; Ding et al., 2007; Supp et al., 2007).
One such method for estimating cortical connectivity is the directed transfer function (DTF) first described by Kaminski and Blinowska (1991). The DTF is a type of causality estimate applied to multivariate systems, such as EEG/ECoG recordings, and has previously been shown to accurately identify the SOZ from ictal recordings in patients with mesial temporal lobe epilepsy (Franaszczuk et al., 1994; Franaszczuk and Bergey, 1998). It is defined in the framework of the multivariate autoregressive (MVAR) model. In this procedure, a single set of model coefficients are obtained from the analyzed time series. Due to the time-invariant nature of these coefficients, the underlying assumption that accompanies the utilization of the DTF method is that the data must be stationary over the analyzed time window. While this assumption may hold true for selected ictal segments, the same cannot be assumed for temporally short events such as interictal spikes.
We have recently examined a dynamic measure of causality, termed the adaptive directed transfer function (ADTF), in order to overcome the limitation posed by this conventional approach (Wilke et al., 2008). This technique utilizes time-variant coefficients obtained from an adaptive multivariate autoregressive (AMVAR) model in order to obtain the connectivity information from transient events. In preliminary studies, the ADTF method has been shown to possess the capability to identify sources of temporally short processes.
In the present study, we apply the ADTF technique to interictal spike data collected from ECoG recordings in a group of pediatric patients with neocortical-onset epilepsy. This group of patients was selected based upon the close proximity of the SOZ to the intracranial grids. We compare our results obtained using the ADTF method with the epileptogenic foci determined by the clinicians from ictal ECoG recordings.
II. Methods
Patients
Intracranial EEG recordings were obtained from a group of eight pediatric patients (3M/5F, ages 7-14) undergoing surgical evaluation for the treatment of medically intractable epilepsy at the University of Chicago's Pediatric Epilepsy Center. The patients were selected on the criterion that each presented with complex partial seizures with at least one neocortical focus. All of the selected patients underwent surgical resection of the presumed seizure focus/foci and all experienced significant reductions in seizure frequency during clinical follow-up 6-12 months post-operatively. The patients' data were studied under a protocol approved by the Institutional Review Boards at the University of Minnesota and the University of Chicago.
Interictal Spike Data
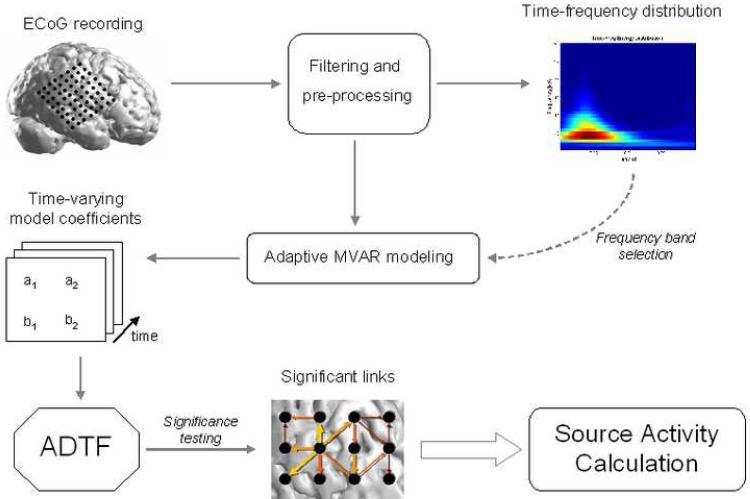
Electrocorticogram (ECoG) recordings were obtained through the use of rectangular silastic electrode grids (interelectrode distance: 10 mm) placed upon the cortical surface. The recordings were referenced to the contralateral mastoid, passed through a 200 Hz anti-aliasing filter and sampled at 400 Hz (BMSI 6000; Nicolet Biomedical Inc, Madison, WI, USA). Spike activity was identified from the interictal recordings at least four hours removed from an ictal event. An average of eighteen spikes per patients (range: 7-28) were selected for the analysis. Following acquisition of the data, additional off-line pre-processing was performed, including 0.1-75 Hz band-pass filtering and automated artifact rejection. Visual inspection was also performed on the data and channels displaying the presence of artifact were discarded from the analysis. Following the filtering procedure, the Z-score of each channel was obtained by subtracting the mean value and dividing the result by the standard deviation. The Z-score was performed to avoid any potential bias by the ADTF method due to large power discrepancies between the channels and has been used in previous studies employing causality calculations. The ADTF method was subsequently applied to this data to calculate the time-varying connectivity pattern. An overview of the methods used in the current study is shown in Figure 1.
Figure 1.
Overview of the method utilized in the present study. The interictal spike recordings were identified from ECoG recordings in each patient. The frequency band of interest for each interictal spike was selected by time-frequency analysis and the ADTF method was utilized to obtain the connectivity pattern during each spike recording. From here, the cortical regions displaying the greatest amount of information outflow were identified.
Surrogate Data Testing
Since the ADTF function has a highly nonlinear relationship to the time series from which it is derived, the distribution of its estimators under the null hypothesis of no connectivity is not well established and conventional parametric statistical analysis cannot be used. To overcome this problem, a nonparametric statistical test using surrogate data (Theiler et al., 1992; Palus and Hoyer, 1998) was utilized in the present study. In this method, the original time series was Fourier transformed and the phases of the Fourier coefficients were randomly and independently shuffled to create a new surrogate time series. The process of shuffling the phases destroys the causal connections between the ECoG channels while additionally preserving the spectral structure of the time series which is a critical aspect since the ADTF is a measure of frequency-specific causal interactions. Following the phase shuffling, the data was inverse Fourier transformed and the ADTF method was applied to the surrogate dataset. This process was repeated 1000 times and the resultant distribution of ADTF values was assumed to represent a collection of causal activity which arose from purely spurious activity (e.g. due to the phase shuffling procedure). Using these empirical distributions, which were obtained for each time point, frequency band and channel pair, the statistical significance of causal links obtained from the original time series via the ADTF method was evaluated (p=0.01) (Ding et al., 2007).
Source Localization
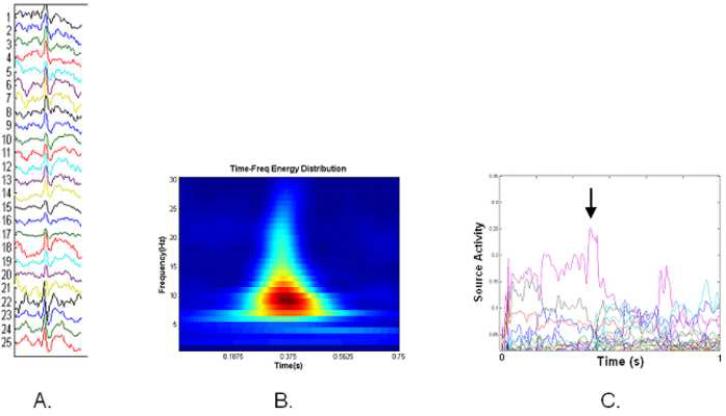
Following the surrogate data procedure, a map was obtained which contained the statistically significant time-varying interactions among the analyzed ECoG channels. The derivation of the causal activity measurements by means of the ADTF method is given in the Appendix. The amount of ADTF-calculated information leaving each node was summed to obtain a measure of the source activity arising from each node. Here, the source activity is a measure of the degree to which information propagates from a particular node to the rest of the network. The source activity values were then subsequently evaluated at the time point corresponding to the average peak of the selected interictal spike. A diagram depicting an interictal spike recording, time-frequency distribution and source activity values is shown in Figure 2.
Figure 2.
A. A representative sample of one of the analyzed interictal spike waveforms.
B. The time-frequency representation of (A)
C. The ADTF-calculated source activity from the cortical network during the interictal spike shown in (A). The time point at the average interictal spike peak is denoted by the arrow.
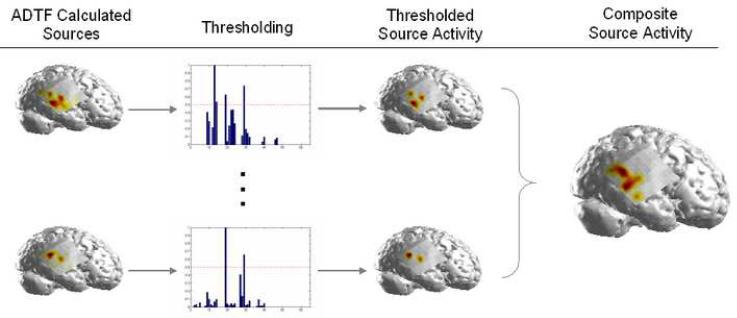
For each interictal spike, a 50% threshold was applied to the source activity values. The thresholded source activity obtained for each interictal spike was summed to obtain a composite ADTF-calculated source activity map (Fig. 3). The cortical locations of the ADTF-calculated sources of the interictal spike activity were compared to the clinically-defined SOZs. In each patient, the location and extent of the cortical SOZs were determined by trained epileptologists by identification of the ECoG channels which contained the earliest ictal changes preceding the propagation of the epileptiform activity. Two separate SOZs were identified clinically in five of the patients while the remaining three patients had one identified SOZ apiece.
Figure 3.
An overview of the calculation of the composite source activity. The cortical source activity was calculated and a 50% threshold was applied for each interictal spike. The thresholded activity was then summed for all of the interictal spikes in each patient to obtain an average source activity map for each patient.
III. Results
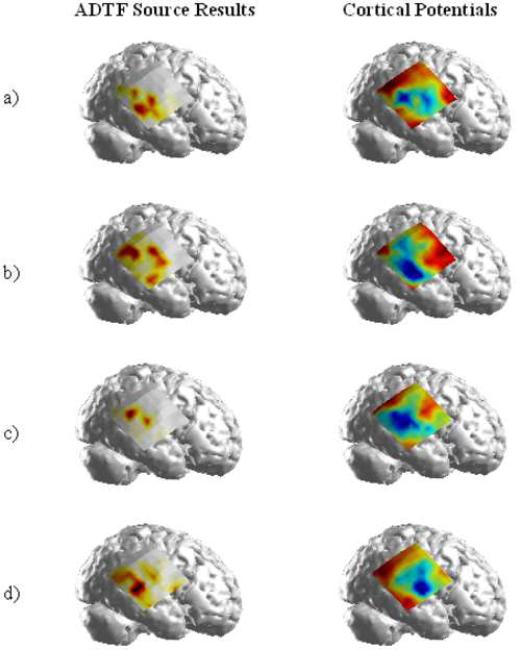
Seven spikes were selected from the interictal recordings in Patient 1. The ADTF results prior to the thresholding procedure for four of the selected spikes are shown in Figure 4. The cortical potentials corresponding to each of the four spikes are also shown for reference. As can be observed from Figure 4, the cortical regions displaying the peak magnitude during the interictal spike are not necessarily correlated with the areas containing the greatest interictal spike source activity. Differences are readily observed between the two maps, particularly in spikes 2 and 4 (Fig. 4(b) and (d)). In general, the spatial extent of the ADTF-calculated sources tended to be more focal in nature compared to the cortical potential map. This trend was seen in the other seven patients as well.
Figure 4.
The ADTF-calculated source activity (prior to the thresholding procedure) and the cortical potential map for 4 of the selected spikes in Patient 1.
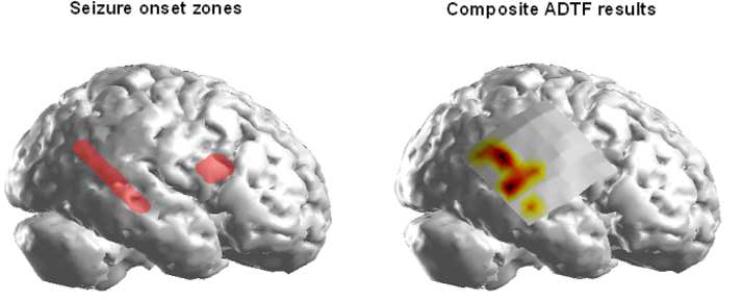
The SOZ delineated by the epileptologist for Patient 1 is shown in Figure 5(a). The corresponding ADTF-calculated source activity from the analyzed interictal spikes in this patient is shown in Figure 5(b). The composite results in Figure 5 show almost all of the ADTF-calculated source activity to be localized to the epileptogenic focus in the right temporal lobe of this patient. No source activity was observed within the vicinity of the right frontal focus. Upon visual examination of the interictal ECoG recordings, the majority of the spiking activity was located in the posterior two-thirds of the ECoG grid with little to no activity observed in the cortical regions around the frontal focus. A right anterior temporal lobectomy and resection of the frontal focus was performed in this patient. Post-operatively, the patient experienced a 70% decrease in seizure frequency.
Figure 5.
A. The seizure-onset zone (SOZ) determined by the epileptologist in Patient 1 is shown in red highlight. In all of the analyzed patients, the location and extent of the SOZ was delineated from ictal information.
B. The composite ADTF source results obtained from summing the thresholded source activity values from all of the analyzed spikes in this patient.
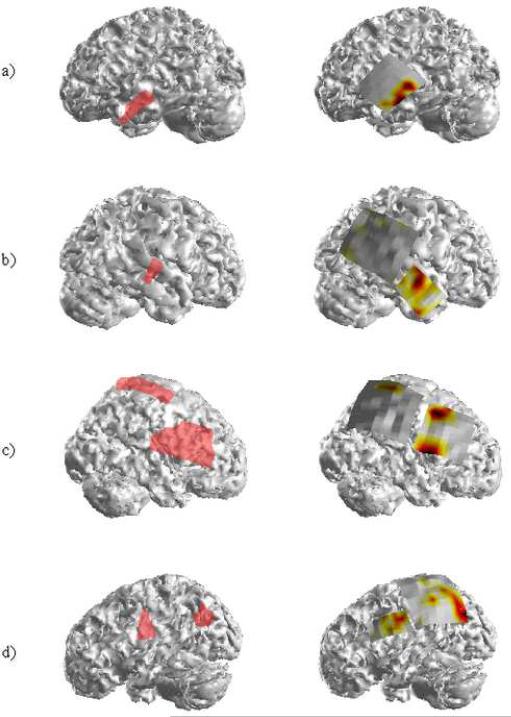
Patients 2 and 3 also presented with neocortical foci in the anterior left and right temporal lobes respectively. Nine interictal spikes were obtained for analysis in Patient 2 while sixteen spikes were analyzed in Patient 3. The results of the ADTF source analysis for these two patients are shown in Figures 6 (a) and (b) respectively. In both patients, the source activity was localized to the respective SOZs identified clinically. Furthermore, the extent of the composite source activity observed in both patients was nearly identical to the borders of the respective SOZs. Patients 2 and 3 each experienced significant reductions in seizures with Patient 3 experiencing a decrease of roughly 85%.
Figure 6.
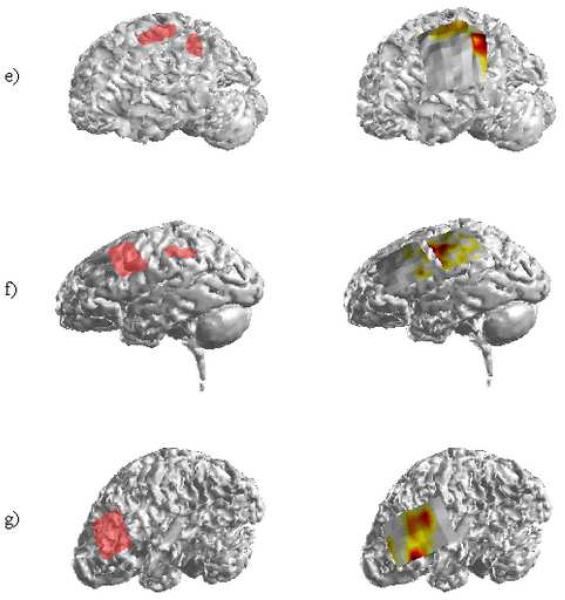
The SOZs and the corresponding ADTF source activity in the remaining seven patients. Each patient underwent surgical resection of the epileptologist-determined ictal foci.
Patients 4, 5 and 6 each presented with a pair of separate neocortical foci. In Patient 4, two clinical SOZs were identified: one within the superior portion of the parietal lobe and a second larger focus encompassing the right frontal lobe. Analysis of twenty-seven interictal spikes in this patient resulted in three ADTF-estimated source regions. One of these regions overlapped the parietal SOZ while the other two were located on the superior and inferior borders of the frontal SOZ. Patient 5 had one clinically identified focus in the frontal lobe while a second was identified in the left parietal/occipital lobe. Twenty-eight interictal spikes were analyzed revealing ADTF-estimated source activity corresponding to both SOZs. As can be seen in Figure 6(d), the source activity corresponding to the posterior SOZ was slightly greater in spatial extent than the clinically identified focus. However, the maximum focal area of the ADTF-calculated interictal spike source activity was observed within the posterior SOZ. Patient 6 (Fig. 6(e)) had two tightly clustered clinical foci. Analysis of twenty-one interictal spikes revealed ADTF source activity which was almost identical in spatial location and extent as the clinical SOZ. Following resective surgery, Patient 4 was seizure-free while Patients 5 and 6 both experienced significant reductions in seizure frequency.
Two SOZs were identified in the left frontal and left parietal lobes of Patient 7. Twenty-five interictal spikes were analyzed in this patient and the ADTF-calculated source results are shown in Figure 6(f). As can be seen from the source results, the majority of the activity estimated from the ADTF method is located on the posterior aspect of the frontal SOZ. Similar to Patient 1, little to no source activity was observed in the second, smaller SOZ. On examination of the ECoG recordings, interictal spikes were observed in the cortical area corresponding to the posterior SOZ. The spikes were much more frequently observed, though in the area corresponding to the frontal SOZ. Patient 7 experienced a significant decrease in seizure activity following surgical resection.
A single clinical SOZ was identified by the clinicians in the eighth and final patient. Here, the SOZ encompassed a large portion of the frontal SOZ. Significant ADTF-estimated source activity was observed in the inferior and posterior portions of the SOZ following analysis of ten interictal spikes. Surgical resection of the frontal focus was performed and the patient was seizure-free post-operatively. A summary of the patients analyzed in the present study is shown in Table 1.
Table 1.
Information on the eight patients included in this study. Patients 1, 4, 5, 6 and 7 had two SOZs determined by the epileptologists while the remaining patients had one focus apiece. All underwent surgical resection; Patients 4 and 8 were seizure-free while the rest experienced a 70% or greater decrease in seizure frequency postoperatively.
| Patient | Sex | Age | No. of foci | No. of spikes | No. of analyzed electrodes | Outcome |
|---|---|---|---|---|---|---|
| 1 | F | 8 | 2 | 7 | 49 | SR |
| 2 | F | 14 | 1 | 9 | 44 | SR |
| 3 | M | 7 | 1 | 16 | 60 | SR |
| 4 | M | 12 | 2 | 27 | 41 | SF |
| 5 | F | 12 | 2 | 28 | 62 | SR |
| 6 | F | 10 | 2 | 21 | 36 | SR |
| 7 | F | 9 | 2 | 25 | 65 | SR |
| 8 | M | 8 | 1 | 10 | 49 | SF |
IV. Discussion
Several techniques have been utilized to discern the flow of information throughout the brain structures during temporally short processes (Schack and Krause, 1995; Ding et al., 2000; Hesse et al., 2003; Philiastides and Sajda, 2006; Astolfi et al., 2008). These methods, which have typically focused upon analysis of event related potentials (ERPs) obtained during simple cognitive tasks, have revealed the capability to capture short causal interactions between cortical regions. To our knowledge, this is the first study to apply such a time-varying spectral analysis technique to the measurement of cortical connectivity during interictal spikes.
In this study, we have applied the ADTF technique to interictal spikes obtained from ECoG data in a cohort of eight pediatric patients with neocortical onset epileptic seizures. We observed that the employed ADTF method was able to localize the sources of the interictal spike waveforms and, furthermore, these sources were coincident with the SOZ identified by the epileptologists from the ictal records in each patient. In addition, in three of the five patients with two separate ictal foci, the employed ADTF method was able to identify spiking activity which arose from both of the SOZs. These results are in agreement with previous studies comparing the site of the interictal `pacemakers', identified by time-latency differences in the spike waveforms, with the surgically resected cortex (Alarcon et al., 1997; Lai et al., 2007).
In two of the patients with multifocal epilepsy, the ADTF identified a single focal source of the interictal spike activity. There are potentially multiple explanations for this observation. In Patient 1, interictal spikes were not observed in the presence of the frontal SOZ. It is possible that, had more spikes been available for analysis, source activity may have been observed in the frontal SOZ. Alternatively, the frontal SOZ observed in this patient could have been a secondary source drive by the temporal lobe SOZ. Similarly in Patient 7, the spiking activity was more prominent over the anterior SOZ compared to the smaller posterior SOZ. Based upon these results, further studies examining the relationship between interictal spike generators and the SOZ in patients with multiple SOZs is warranted.
During the course of our analysis, we observed a loose correlation between the recorded cortical potentials and the calculated ADTF source activity during the interictal spikes. In general, the cortical potentials related to the interictal spike activity were in the vicinity of the SOZ, however the potential maps were not an exact match to the cortical locations designated as the SOZ. The spatial extent of the cortical potentials tended to be more widespread than the corresponding ADTF source locations. These findings are in agreement with previous studies which have shown that the presence of interictal spikes are not focally confined to the SOZ (Tran et al., 1995; Kanazawa et al., 1996; Alarcon et al., 1997; Ebersole, 2000; Ulbert et al., 2004). In our study, we found the ADTF source results to be relatively constrained to the cortical areas identified as the SOZ.
There have been several studies which have suggested that the rising phase of the interictal spike best represents the focal generator of the observed activity (Scherg et al., 1999; Ebersole, 2000b; Lantz et al., 2003). In the current study, we analyzed the causal information flow at the peak point of the interictal spike. Our findings that the source activity at this selected temporal point are correlated with the SOZs, however, are not necessarily conflicting with these previous studies. While electrophysiologic-based source localization measures and the causality method employed in the current study provide estimates of the underlying cortical activity, they provide measurements of two related albeit separate aspects of the spatiotemporal interictal spike waveform. The causality information identified by the ADTF is based both upon the current and historic activity at a specified temporal point. As a result, the causal activity we identify at the peak point of the interictal spike is a synthesis of the prior electrophysiologic activity (i.e. during the rising phase of the interictal spike). Therefore, the findings that the causal activity is coincident with the estimated SOZs are in agreement with these previous studies.
Upon calculating the ADTF source activity for each interictal spike, little variability was observed in the causal networks during the course of the interictal spike. While there was variation in the connectivity patterns observed prior to and following the interictal spike waveform, we did not observe rapid fluctuations that significantly altered these patterns of the ADTF-calculated source activity during the interictal spike (see Figure 2). Thus, whether the time point was selected so to immediately precede or follow the average peak point, little or no change in the ADTF-calculated connectivity pattern was observed. A possible reason for this lack of variability could be due to the selected frequencies for which the connectivity patterns were calculated. In a majority of the interictal spikes, the frequency bands selected as described in the Appendix were typically in the alpha and beta range. Therefore, these cortical networks may not undergo significant changes in these frequencies over the relatively short duration of the interictal spike. The lack of such observable changes among the selected cohort of patients is encouraging as it suggests the cortical networks underlying the interictal spike activity are relatively uniform and stable over the generation of the spiking events.
The major limitations with the ADTF source estimation technique employed in the present study lie in the intracranial recordings. The current method is limited to the identification of cortical sources which are in close proximity to the recording sites. If the cortical generator responsible for the initiation of the interictal spike is located outside of the area covered by the ECoG, the ADTF method will produce erroneous results. In this case, the ADTF will identify the proximal recording site as the source of the observed activity although this identified “source” may in fact be spatially removed from the true source of the observed activity. For this reason, care must be given in the interpretation of the result when a source is identified as confined to an edge of the recorded field. Similarly, when the source is located within a deep portion of the brain, the ADTF method may identify the cortical manifestations of the source activity. However, this problem can be solved through the use of stereotactic EEG (sEEG) recordings if deeper regions of the brain are responsible for the activity, as in mesial temporal lobe epilepsy. The ADTF method presented in this study can be readily applied to accommodate these recordings as well. The previously described limitations are not confined to the ADTF method, however, as they are applicable to any analysis which utilizes intracranial recordings. In the present study, we specifically selected patients with neocortical onset epilepsy as the ictal generators were in close contact with the ECoG electrodes, thereby minimizing or avoiding altogether the aforementioned limitations.
In utilizing the ADTF method, as with most any method dealing with electrophysiologic signals, it is important to be cognizant of discrepancies in the SNR during the calculation of causal activity. In the present study, several measures were taken to mitigate potential bias from the ADTF estimate. Firstly, filtering and artifact rejection were performed and channels which were contaminated by the presence of artifact arising from high impedance, line noise, etc were removed prior to the analysis. Secondly, the Z-transform was applied to the time series prior to application of the ADTF method. This served to normalize the analyzed dataset by removing the mean values and setting the variance equal to one. Thus, in the analyzed datasets in the current study, the discrepancies in amplitude of the interictal spike waveforms among the channels were small or insignificant.
Although the present study explored the application of the ADTF method to ECoG recordings of interictal spikes, the connectivity technique utilized in this study could also be readily applied to cortical potentials reconstructed from scalp recordings. In this procedure, the cortical potentials are estimated from non-invasive scalp EEG recordings through a linear inverse procedure, and shown to be highly correlated with measured cortical activity (He et al., 2002; Zhang et al., 2003). Alternatively the dynamic connectivity estimator can also be applied to cortical current density estimates (Michel et al., 2004; Babiloni et al., 2005; Sperli et al., 2006; Bai et al., 2007) of epileptic activity. Babiloni et al. (2005) have previously applied the time-invariant DTF technique to cortical current density estimates from high-resolution EEG measurements. From this study, it was shown that the DTF was able to elucidate functional cortical networks related to the motor activity. In the present study, we have shown that the generators of the interictal spikes as discerned by application of the ADTF method to ECoG data are spatially correlated with the ictal generators. Application of the ADTF method to similar cortical current density estimates from interictal spike activity may provide a means to easily and non-invasively discern the generators of the epileptiform activity.
In summary, we have examined the functional sources of interictal spike activity through estimation of the cortical connectivity by means of the ADTF method. From the results in eight patients with neocortical onset epilepsy, the ADTF identified the interictal generators as arising from the same cortical locations as the ictal SOZ. Based upon the results of this analysis, such time-varying connectivity techniques may prove to be a useful surrogate to identification of the SOZ by ictal recordings.
Acknowledgements
This work was supported in part by NIH RO1EB007920, RO1EB00178, T32EB008389, and a grant from the Institute of Engineering in Medicine of the University of Minnesota.
Appendix
Multivariate Adaptive Autoregressive Modeling
For each interictal spike time series, an adaptive multivariate autoregressive (AMVAR) model was fit to the data. The AMVAR model describes the datasets as follows:
| (1) |
Where X (t) is the data vector, Λ(i,t) are the matrices of time-varying model coefficients, E(t) is independent white noise and p is the model order. We established the time-varying coefficient matrices by the Kalman filter algorithm (Arnold et al., 1998) which describes the behavior of the multivariate signals by the observations equation, i.e. (1), and the following state equation:
| (2) |
The observation and state equations of this algorithm can be solved by the recursive least squares (RLS) algorithm with forgetting factor (Campi, 1994). The optimum order for the model was chosen by the Schwarz Bayesian Criterion (SBC) (Schwarz, 1978) which has previously been shown to possess a high degree of accuracy (Lutkepohl, 1985).
Adaptive Directed Transfer Function
The Directed Transfer Function (DTF) was developed by Kaminski and Blinowska as a means by which to determine the direction of the flow of information in multivariate systems (Kaminski and Blinowska, 1991). They described the DTF as:
| (3) |
where and Λk=o = I. Here, Λ is the matrix of model coefficients obtained from a time-invariant multivariate autoregressive (MVAR) model and H (f) is the transfer matrix containing the frequency-specific causal relationships. Since we are able to characterize the time-varying model coefficients, Λ(i, t), from (1), we can thus obtain the time-varying transfer matrix, H (f, t). The normalized ADTF is defined by the elements of the transfer matrix in the spectral domain, which describes the directional interaction from the jth to the ith element as:
| (4) |
Source Activity
In order to evaluate the information arising from each node during the course of the interictal spike, Eq (4) was integrated over the frequency band of interest. Here, the time-frequency (TF) distribution was calculated for each interictal spike using Morlet wavelets (Goupillaud et al., 1984). From the TF distribution, the frequency containing the maximum power during the peak of the interictal spike was identified. A 50% threshold was applied to the TF distribution in order to obtain the upper and lower limits of the frequency band of interest. The selected frequency bands were typically in the alpha to beta frequency range and the selected width was within a 5 to 15 Hz window (average ~ 8 Hz).
By integrating Eq (4) over the selected frequency band, we can obtain the average causal information in the frequency band of interest - here the frequencies corresponding to the interictal spike.
| (5) |
Additionally, we can calculate the amount of source activity arising from each node by summing the contributions that each exerts upon the network as a whole.
| (6) |
Here, the source activity, SA, corresponds to the degree in which activity propagates from a particular node, j, to the rest of the network. A SA value of one indicates that the particular node contributes heavily to the network activity while a value around zero indicates that the particular node has little or no contribution to the activity in a given time series.
Footnotes
Publisher's Disclaimer: This is a PDF file of an unedited manuscript that has been accepted for publication. As a service to our customers we are providing this early version of the manuscript. The manuscript will undergo copyediting, typesetting, and review of the resulting proof before it is published in its final citable form. Please note that during the production process errors may be discovered which could affect the content, and all legal disclaimers that apply to the journal pertain.
References
- Alarcon G, Garcia Seoane JJ, Binnie CD, Martin Miguel MC, Juler J, Polkey CE, et al. Origin and propagation of interictal discharges in the acute electrocorticogram. Implications for pathophysiology and surgical treatment of temporal lobe epilepsy. Brain. 1997;120(Pt 12):2259–2282. doi: 10.1093/brain/120.12.2259. [DOI] [PubMed] [Google Scholar]
- Arnold M, Miltner WH, Witte H, Bauer R, Braun C. Adaptive AR modeling of nonstationary time series by means of Kalman filtering. IEEE Trans Biomed Eng. 1998;45:553–562. doi: 10.1109/10.668741. [DOI] [PubMed] [Google Scholar]
- Astolfi L, Cincotti F, Mattia D, Babiloni C, Carducci F, Basilisco A, et al. Assessing cortical functional connectivity by linear inverse estimation and directed transfer function: simulations and application to real data. J Clin Neurophysiol. 2005;116:920–932. doi: 10.1016/j.clinph.2004.10.012. [DOI] [PubMed] [Google Scholar]
- Astolfi L, Cincotti F, Mattia D, De Vico Fallani F, Tocci A, Colosimo A, et al. Tracking the time-varying cortical connectivity patterns by adaptive multivariate estimators. IEEE Trans Biomed Eng. 2008;55:902–913. doi: 10.1109/TBME.2007.905419. [DOI] [PubMed] [Google Scholar]
- Astolfi L, Cincotti F, Mattia D, Marciani MG, Baccala LA, de Vico Fallani F, et al. Comparison of different cortical connectivity estimators for high-resolution EEG recordings. Hum Brain Mapp. 2007;28:143–157. doi: 10.1002/hbm.20263. [DOI] [PMC free article] [PubMed] [Google Scholar]
- Babiloni F, Cincotti F, Babiloni C, Carducci F, Mattia D, Astolfi L, et al. Estimation of the cortical functional connectivity with the multimodal integration of high-resolution EEG and fMRI data by directed transfer function. NeuroImage. 2005;24:118–131. doi: 10.1016/j.neuroimage.2004.09.036. [DOI] [PubMed] [Google Scholar]
- Baccala LA, Alvarenga MY, Sameshima K, Jorge CL, Castro LH. Graph theoretical characterization and tracking of the effective neural connectivity during episodes of mesial temporal epileptic seizure. J Integr Neurosci. 2004;3:379–395. doi: 10.1142/s0219635204000610. [DOI] [PubMed] [Google Scholar]
- Baccala LA, Sameshima K. Partial directed coherence: a new concept in neural structure determination. Biol Cybern. 2001;84:463–474. doi: 10.1007/PL00007990. [DOI] [PubMed] [Google Scholar]
- Bai X, Towle VL, He EJ, He B. Evaluation of cortical current density imaging methods using intracranial electrocorticograms and functional MRI. NeuroImage. 2007;35:598–608. doi: 10.1016/j.neuroimage.2006.12.026. [DOI] [PMC free article] [PubMed] [Google Scholar]
- Brovelli A, Ding M, Ledberg A, Chen Y, Nakamura R, Bressler SL. Beta oscillations in a large-scale sensorimotor cortical network: directional influences revealed by Granger causality. Proc Natl Acad Sci U.S.A. 2004;101:9849–9854. doi: 10.1073/pnas.0308538101. [DOI] [PMC free article] [PubMed] [Google Scholar]
- Campi M. Performance of RLS identification algorithms with forgetting factor: a phi-mixing approach. J Math Syst Estimation Contr. 1994;4:1–25. [Google Scholar]
- Ding L, Worrell GA, Lagerlund TD, He B. Ictal source analysis: localization and imaging of causal interactions in humans. NeuroImage. 2007;34:575–586. doi: 10.1016/j.neuroimage.2006.09.042. [DOI] [PMC free article] [PubMed] [Google Scholar]
- Ding M, Bressler SL, Yang W, Liang H. Short-window spectral analysis of cortical event-related potentials by adaptive multivariate autoregressive modeling: data preprocessing, model validation, and variability assessment. Biol Cybern. 2000;83:35–45. doi: 10.1007/s004229900137. [DOI] [PubMed] [Google Scholar]
- Ebersole JS. Noninvasive localization of epileptogenic foci by EEG source modeling. Epilepsia. 2000;41(Suppl 3):S24–33. doi: 10.1111/j.1528-1157.2000.tb01531.x. [DOI] [PubMed] [Google Scholar]
- Ebersole JS. Sublobar localization of temporal neocortical epileptogenic foci by source modeling. Adv Neurol. 2000b;84:353–363. [PubMed] [Google Scholar]
- Ebersole JS, Pedley TA. Current practice of clincal electroencephalography. 3rd ed. Lippincott Williams and Wilkins; 2003. [Google Scholar]
- Engel J, Jr, Ojemann GA. Surgical treatment of the epilepsies. 2nd ed. Raven Press; New York: 1993. [Google Scholar]
- Franaszczuk PJ, Bergey GK. Application of the directed transfer function method to mesial and lateral onset temporal lobe seizures. Brain Topogr. 1998;11:13–21. doi: 10.1023/a:1022262318579. [DOI] [PubMed] [Google Scholar]
- Franaszczuk PJ, Bergey GK, Kaminski MJ. Analysis of mesial temporal seizure onset and propagation using the directed transfer function method. Electroencephalogr Clin Neurophysiol. 1994;91:413–427. doi: 10.1016/0013-4694(94)90163-5. [DOI] [PubMed] [Google Scholar]
- Friston KJ. Functional and effective connectivity in neuroimaging: a synthesis. Hum Brain Mapp. 1994;2:56–78. [Google Scholar]
- Goupillaud P, Grossman A, Morlet J. Cycle-octave and related transforms in seismic signal analysis. Geoexploration. 1984;23:85–102. [Google Scholar]
- Granger CWJ. Investigating causal relations by econometric models and cross-spectra methods. Econometrica. 1969;37:424–428. [Google Scholar]
- He B, Zhang X, Lian J, Sasaki H, Wu D, Towle VL. Boundary element method-based cortical potential imaging of somatosensory evoked potentials using subjects'magnetic resonance images. NeuroImage. 2002;16:564–576. doi: 10.1006/nimg.2002.1127. [DOI] [PubMed] [Google Scholar]
- Hesse W, Moller E, Arnold M, Schack B. The use of time-variant EEG Granger causality for inspecting directed interdependencies of neural assemblies. J Neurosci Methods. 2003;124:27–44. doi: 10.1016/s0165-0270(02)00366-7. [DOI] [PubMed] [Google Scholar]
- Kaminski M, Blinowska K, Szclenberger W. Topographic analysis of coherence and propagation of EEG activity during sleep and wakefulness. Electroencephalogr Clin Neurophysiol. 1997;102:216–227. doi: 10.1016/s0013-4694(96)95721-5. [DOI] [PubMed] [Google Scholar]
- Kaminski MJ, Blinowska KJ. A new method of the description of the information flow in the brain structures. Biol Cybern. 1991;65:203–210. doi: 10.1007/BF00198091. [DOI] [PubMed] [Google Scholar]
- Kanazawa O, Blume WT, Girvin JP. Significance of spikes at temporal lobe electrocorticography. Epilepsia. 1996;37:50–55. doi: 10.1111/j.1528-1157.1996.tb00511.x. [DOI] [PubMed] [Google Scholar]
- Lai Y, van Drongelen W, Hecox K, Frim D, Kohrman M, He B. Cortical activation mapping of epileptiform activity derived from interictal ECoG spikes. Epilepsia. 2007;48:305–314. doi: 10.1111/j.1528-1167.2006.00936.x. [DOI] [PubMed] [Google Scholar]
- Lantz G, Spinelli L, Seeck M, Grave di Peralta R, Sottas CC, Michel CM. Propagation of interictal epileptiform activity can lead to erroneous source localizations: a 128 channel EEG mapping study. J Clin Neurophysiol. 2003;20:311–319. doi: 10.1097/00004691-200309000-00003. [DOI] [PubMed] [Google Scholar]
- Lutkepohl H. Comparison of criteria for estimating the order of a vector autoregressive process. J Time Ser Anal. 1985;6:5–52. [Google Scholar]
- Michel CM, Murray MM, Lantz G, Gonzalez S, Spinelli L, Grave de Peralta R. EEG source imaging. J Clin Neurophysiol. 2004;115:2195–2222. doi: 10.1016/j.clinph.2004.06.001. [DOI] [PubMed] [Google Scholar]
- Palus M, Hoyer D. Detecting nonlinearity and phase synchronization with surrogate data. IEEE Eng Med Biol Mag. 1998;17:40–45. doi: 10.1109/51.731319. [DOI] [PubMed] [Google Scholar]
- Penfield W, Jasper H. Epilepsy and the functional anatomy of the human brain. Little, Brown and Co.; Boston: 1954. [Google Scholar]
- Philiastides MG, Sajda P. Causal influences in the human brain during face discrimination: a short-window directed transfer function approach. IEEE Trans Biomed Eng. 2006;53:2602–2605. doi: 10.1109/TBME.2006.885122. [DOI] [PubMed] [Google Scholar]
- Schack B, Krause W. Dynamic power and coherence analysis of ultra short-term cognitive processes--a methodical study. Brain Topogr. 1995;8:127–136. doi: 10.1007/BF01199776. [DOI] [PubMed] [Google Scholar]
- Scherg M, Bast T, Berg P. Multiple source analysis of interictal spikes: goals, requirements, and clinical value. J Clin Neurophysiol. 1999;16:214–224. doi: 10.1097/00004691-199905000-00003. [DOI] [PubMed] [Google Scholar]
- Schwarz G. Estimating the dimension of a model. Ann Stat. 1978;6:461–464. [Google Scholar]
- Sperli F, Spinelli L, Seeck M, Kurian M, Michel CM, Lantz G. EEG source imaging in pediatric epilepsy surgery: a new perspective in presurgical workup. Epilepsia. 2006;47:981–990. doi: 10.1111/j.1528-1167.2006.00550.x. [DOI] [PubMed] [Google Scholar]
- Supp GG, Schlogl A, Trujillo-Barreto N, Muller MM, Gruber T. Directed cortical information flow during human object recognition: analyzing induced EEG gamma-band responses in brain's source space. PLoS ONE. 2007;2:e684. doi: 10.1371/journal.pone.0000684. [DOI] [PMC free article] [PubMed] [Google Scholar]
- Theiler J, Eubank S, Longtin A, Galdrikian B, Farmer JD. Testing for nonlinearity in time series: the method of surrogate data. Physica D. 1992;58:77–94. [Google Scholar]
- Tran TA, Spencer SS, Marks D, Javidan M, Pacia S, Spencer DD. Significance of spikes recorded on electrocorticography in nonlesional medial temporal lobe epilepsy. Ann Neurol. 1995;38:763–770. doi: 10.1002/ana.410380511. [DOI] [PubMed] [Google Scholar]
- Tsau Y, Guan L, Wu JY. Epileptiform activity can be initiated in various neocortical layers: an optical imaging study. J Neurophysiol. 1999;82:1965–1973. doi: 10.1152/jn.1999.82.4.1965. [DOI] [PubMed] [Google Scholar]
- Ulbert I, Heit G, Madsen J, Karmos G, Halgren E. Laminar analysis of human neocortical interictal spike generation and propagation: current source density and multiunit analysis in vivo. Epilepsia. 2004;45(Suppl 4):48–56. doi: 10.1111/j.0013-9580.2004.04011.x. [DOI] [PubMed] [Google Scholar]
- Walker A. Electrocorticography in epilesy. Electroencephalogr Clin Neurophysiol. 1949;2:30–37. [Google Scholar]
- Wilke C, Ding L, He B. Estimation of time-varying connectivity patterns through the use of an adaptive directed transfer function. IEEE Trans Biomed Eng. 2008;55:2557–2564. doi: 10.1109/TBME.2008.919885. [DOI] [PMC free article] [PubMed] [Google Scholar]
- Wu JY, Guan L, Tsau Y. Propagating activation during oscillations and evoked responses in neocortical slices. J Neurosci. 1999;19:5005–5015. doi: 10.1523/JNEUROSCI.19-12-05005.1999. [DOI] [PMC free article] [PubMed] [Google Scholar]
- Zhang X, van Drongelen W, Hecox KE, Towle VL, Frim DM, McGee AB, et al. High-resolution EEG: cortical potential imaging of interictal spikes. J Clin Neurophysiol. 2003;114:1963–1973. doi: 10.1016/s1388-2457(03)00194-9. [DOI] [PubMed] [Google Scholar]


