

Abstract
Mechanisms that underlie early ischemic damages to the blood-brain-barrier (BBB) are not well understood. This study presents a novel magnetic resonance imaging (MRI) technique using a widely available pulse sequence and a long-circulating intravascular contrast agent to quantify water movements across the BBB at early stages of stroke progression. We characterized the integrity of the BBB by measuring the flip angle dependence of the water exchange-affected MRI signal intensity, to generate an efficient quantitative index of vascular permeability (WEI, or water exchange index). We performed in vivo MRI experiments to measure the transvascular WEI immediately after the permanent filament occlusion of the middle cerebral artery of mice (n = 5), in which we monitored changes in blood volume (Vb), apparent diffusion coefficient (ADC), and intra-/extravascular WEI for 4 hours. Statistically significant elevations (P < 0.05) of WEI in the ischemic tissue were observed as early as 1 hour after ischemic onset. Initial reduction of the apparent blood volume (Vapp) in the infarct cortex was followed by a continuous increase of Vapp over time. Although the measured ADC in the ipsilesional cortex continuously decreased, the abnormally high intra-/extravascular WEI remained constant at a significantly elevated level, indicating apparent BBB injury at this early stage of stroke.
Keywords: water exchange, stroke, blood-brain barrier, mouse
After an ischemic insult, the affected cerebral tissue undergoes a series of changes associated with initially reversible damages that eventually evolve into irreversible tissue damage (1). Biophysical alterations due to ischemic injury include cell swelling, reduced water diffusion, disruption of the blood-brain-barrier (BBB), and loss of cell membrane integrity (2). Almost immediately after ischemic attack, cytotoxic edema, characterized by cellular swelling occurs, leading to an increase in intracellular fluid and a concomitant reduction in extracellular/extravascular water content. The primary mechanism of such changes is believed to a decrease in the intracellular ATP that drives the sodium–potassium pump, and a resultant increase in intracellular sodium concentration, which together create an osmotic pressure gradient. The early increase in cellular volume has been frequently documented, as have changes in both intra- and extracellular water diffusion properties (3,4). Infarcted tissue in acute ischemia typically exhibits restricted water diffusion (i.e., apparent diffusion coefficient: ADC) when examined with diffusion-weighted magnetic resonance imaging (DWI) (5). At later phases, vasogenic edema, associated with local disruption of the blood-brain-barrier (BBB), follows the cytotoxic edema (1). The dysfunctional BBB leads to the extravasation of protein-rich plasma, with subsequent accumulation of vascular fluid in the interstitial space. BBB disruption arises when tight junctions between endothelial cells disengage, during which the neoformation and enhanced activity of pinocytic vesicles are frequently observed (6). Both hydrostatic and osmotic forces created by blood perfusion and the interstitial accumulation of various biological molecules induce the extravasation of intravascular fluid (7).
Because vasogenic edema accompanies the extravasation of protein, spatial and temporal leakage profiles of staining dye or various imaging contrast agents have been used to identify the degree of vasogenic dysfunction. Along these same lines, various strategies have been used to evaluate the vascular permeability. However, such techniques have been highly limited by the fact that measurement is only possible when the damaged BBB allows the extravasation of extrinsic markers (e.g., Gd-DTPA) (8,9). Therefore, given that extrinsic markers usually are not capable of crossing the BBB at acute stages of stroke, it has not been feasible to observe the progressive weakening of the BBB. We described here a novel way to quantify acute BBB leakage in cerebral ischemia by using intrinsic water molecules as a measurement marker.
Recent evidence has revealed that the expression of perivascular aquaporin proteins (e.g., AQP4) that form water channels may be involved in water movement across the BBB interface and are disturbed as early as 1 hour after cerebral ischemia (10,11). We posit that water movement regulated by perivascular water channel proteins is probably impaired and/or dysfunctional during stroke progression and can be used as a measurement target of interest. To monitor early BBB impairment, we propose an MRI technique based on the difference in the longitudinal relaxation rate (i.e., 1/T1) between the intra- and extravascular spaces. A difference of T1 relaxation rates can be created by intravenous administration of a strictly intravascular long circulating contrast agent. Then, the MRI signal is affected by the water exchange between tissue compartments that consist of intra- and extravascular spaces. The effects of water exchange on MRI signal intensity are also dependent on the MRI pulse sequence and pulse sequence parameters as well as compartmental sizes. Our measurement technique exploits the dependence of the MRI signal intensity acquired with 3D SPGR on the flip angle (α) to identify the disrupted BBB integrity. We demonstrated that this relatively simple MRI technique provides a non-invasive means for understanding and quantifying the water movement across the BBB interface. Water molecules that traverse the vascular membrane offer a unique opportunity not only for observing the presence of vascular damage at early stages of stroke but also for understanding how such impairment evolves into a serious vascular dysfunction at later stages.
Previously, we reported that the transvascular water movement (i.e., between intra- and extravascular spaces) in rat brains can be quantified by using a widely available MRI pulse sequence (i.e., 3D SPGR) and an intravascular contrast agent (i.e., Gd-PGC) (12,13). We have also shown that the degree of intra-/extravascular water movement (i.e., transvascular water exchange) reflects the integrity of the BBB and that the transvascular water exchange is elevated in brain tumor vasculature (12). In the current study, we investigated time-dependent hyper-acute changes of various biophysical parameters in a mouse stroke model of permanent middle cerebral artery occlusion (MCAo). Specifically, we hypothesized that vascular integrity is distinctively altered within an hour of ischemic onset, concurrently accompanying cytotoxic edema. We performed two-compartment model simulations to optimize MRI parameters and the contrast agent dose to achieve measurement accuracy. Furthermore, adjustment of the measured water exchange index (WEI) was made, considering time-dependent biophysical changes such as reduced diffusion and cellular swelling that may affect the measurement accuracy. By directly examining the movements of water molecules through the vascular membrane, our goal was to devise a convenient and practical methodology for assessing BBB damage during stroke progression without acquiring the leakage profile of extrinsic molecules into the interstitial space, and thereby, to provide a possible predictor of ensuing vasogenic events.
Materials and Methods
Intravascular MR Imaging Contrast Agent
Protected graft copolymer bearing covalently linked Gd-DTPA residues (Gd-PGC) was synthesized and purified as described previously (13). The batches of Gd-PGC were characterized on a size-exclusion HPLC column (TSK3000SW, Supelco, Bellefonte PA) and gadolinium concentrations were determined by elemental analysis. The polymer was dissolved at 50 mg/mL (13 mM Gd) in DPBS, at pH 7 and sterile-filtered.
Animal Preparation
A total of 9 mice were used in the study. Five male mice (C57B16J, 8 weeks old, roughly 30 g each) were prepared with the permanent occlusion of the middle cerebral artery and the femoral vein for administration of MR contrast agents. Continuous inhalation of gas mixture (30% O2 70% N2O2) with 1.5% Isoflurane was used for anesthesia during the surgical preparations. Immediately after occlusion, mice were relocated to a stereotaxic frame designed for the steady fixation of head position for MRI acquisition. During MRI acquisitions, the mice were anesthetized with 1.5% Isoflurane in a 1:1 gas mixture of medical air and oxygen while body temperature (∼36°C) and oxygen saturation (>95%) were monitored. Two stroke and two normal mice were used for acquisition of cerebral blood flow (CBF) maps and high resolution structural images.
MRI Acquisition
The MRI data were acquired with a 3D-SPGR (spoiled gradient echo) pulse sequence on a 9.4 T scanner (Bruker). Before and after intravenous administration of Gd-PGC (17.5 μmol Gd/kg), we collected 3D volume images (matrix = 64 × 64 × 128 and FOV = 1.6 × 1.6 × 3.2 cm, thus isotropic voxel) with TR/TE = 40/4.0 ms, number of average = 1, while varying the flip angle at 20°, 40°, 60°, and 90°. Additionally, the 3D-SPGR scan was performed with TR/TE = 40/[6, 8, 10] ms with the fixed flip angle at 40° for calculating the T2* change due to the intravascular contrast agent. After the administration of the Gd-PGC, we repeated each set of 3D-SPGR images with various flip angles and TEs every 30 minutes for approximately 4 hours after the MCAo; we also acquired diffusion weighted images (DWI) were acquired every 30 minutes, using a diffusion-weighted EPI pulse sequence with TR/TE = 3700/40 ms and b = 5, 300, 800, and 1200 sec/mm2 for ADC calculation. After the 3D SPGR acquisitions, T2 maps were acquired using a multi-spin echo sequence with TR/TE = 3000/[15, 30, 45, 60, 75, 90, 105, 120] ms, 9 slice, and slice thickness = 0.75 mm. At the end of each experiment, we collected 2D T1-weighted conventional gradient echo images (TR/TE = 150/4 ms, flip angle = 80°, 9 slices, slice thickness = 0.75 mm) before and after the administration of Gd-DTPA (0.2 mmoles Gd/kg). Additional T1-weighted images were acquired after Gd-DTPA injection, for ∼20 minutes to detect apparent BBB disruptions. We acquired maps of cerebral blood flow (CBF) for selected animals (n = 2 stroke mice and n = 2 normal mouse) using multi-shot EPI (TR/TE = 1000/3 ms, 4 shots, matrix = 64 × 64, and FOV = 1.9 cm) with a continuous arterial spin labeling (CASL) technique. For the same set of animals, we obtained conventional SE diffusion-weighted images (Matrix = 128 × 128, TR/TE/b = 4000 ms/30 ms/[0, 1123, and 1627 sec/mm2]) after MCAo.
Simulation
We simulated the MR signal intensity (SI) of brain tissue using a two-compartment model that consisted of intra- and extravascular spaces and used the modified Bloch equations containing proton exchange terms between these compartments. The tissue signal intensity was calculated as a function of the proton (i.e., water) exchange rate between the intra- and extravascular compartments and compartment fractions. The apparent blood volume (Vapp) was calculated as a function of flip angle (α), assuming no exchange between two compartments as follows:
| [1] |
We define the water exchange index (WEI) as a ratio of the apparent blood volume measured with a flip angle of 10° to that measured with a flip angle 90°. As the water exchange rate increases, the extent of Vapp overestimation also increases when a low flip angle acquisition is used, but remains approximately constant with a 90° flip angle. As such, the ratio of the signal intensities from these two acquisitions provides an indicator of the water exchange rate (see the Results section):
| [2] |
The true blood volume fraction (Vb) was defined by , as it was previously demonstrated that Vb was accurately evaluated using a flip angle ∼ 90° (12).
Furthermore, signal intensity simulations were used to examine the WEI as functions of varying TR, the dose of the intravascular contrast agent, and the fractional volume ratio (Vb/Vitst). We performed additional WEI simulations in which the residence time of water molecules in the interstitial volume (τex) was varied from 50 to 150% of the original value. For all simulations, we assumed an impermeable cellular membrane, with the total cell volume before ischemia onset set at 0.8 (14).
Data Analysis
We selected regions of interest (ROI) pertaining to lesion areas that were visually outlined based on diffusion-weighted images collected at ∼4 hours after the onset of MCAo in the ipsilesional cortex. Corresponding ROIs in the contralateral cortex were used to compare MRI-derived parameters. The ADC map was calculated by using the diffusion-weighted EPI with b = 5, 300, 800, and 1200 s/mm2; Vapp maps were calculated using the 3D SPGR sequence (TR/TE = 40/4.0 ms) with varying flip angle. In particular, we calculated regional T2* using 3D SPGR with varying TE (i.e., 4.0, 6, 8, and 10 ms), the value of which was used to correctly estimate the purely T1-weighted signal intensity.
We performed an exponential fit to describe the diffusional change over time, calculating the time constant (i.e., τo) for the time-dependent ADC decrease in the ipsilesional cortex as follows:
| [3] |
As previously discussed, cellular swelling and decreased ADC may affect WEI measurements. In the current study, we further corrected the temporal WEI data assuming that changes in the intracellular volume (Vcell) are proportionally dependent on the measured ADC values. Assuming a normal cell volume (Vcell(0)) of ∼ 0.8, the stroke-affected Vcell was adjusted in a time-dependent manner as follows:
| [4] |
We calculated the size of the effective interstitial (i.e., extravascular and extracellular) compartment (Vtist) assuming an impermeable cellular membrane and using the relation Vb(t) = 1 − Vitst(t) - Vcell(t).
Data Adjustment
The cytotoxic edema and ADC decay in extravascular (intracellular and interstitial) spaces requires a modification of the two-compartment model typically used. We assumed that the fractional volume ratio (Vb/Vitst) and the residence time of water molecules in the interstitial (i.e., extravascular and extracellular) space (τitst) were altered by stroke-induced biophysical changes. Specifically, we considered two possible contributions were considered: (1) the time dependence of Vb/Vitist changes and (2) the dependence of τtist on diffusion in the interstitial space (Ditst). As Regan and Kuchel have previously discussed, the dependence of τitst on Ditst may be nonlinear as the intra-compartmental water diffusion is severely attenuated (e.g., infarct) (15). The ipsilesional Ditst (assumed to be Dipsilesional) was used to infer the ipsilesional diffusion-affected τtist using the published relationship between mean residence time (τitst) and diffusion.
Statistical Analysis
Unless specified otherwise, all statistical analyses for the ROI presented in the study were performed using a two-tailed t-test. For correlation analyses, we applied the Pearson product-moment correlation test (and linear regression). All of the numerical data were presented as averages ± one standard deviation. Statistical significance was accepted at a confidence level of 0.95.
Results
Simulation Data
Signal intensity differences before and after the administration of contrast agent were used to calculate apparent blood volume (Vapp) using Equation [1]. Figure 1a shows the dependence of the measured Vapp on flip angle, with which we can quantify the true fractional blood volume (Vb) for all the simulated water exchange rates (WERs) by using relatively high flip angles (e.g., 90°). Lowering the flip angle generally predicts an overestimation of the Vb. Such overestimations are dependent on the WER as shown in Figure 1a, and thus provide a theoretical basis for the WER-sensitive water exchange index (WEI) as shown in Figure 1b. Varying TR resulted in differentiated WEI values, whereby calculated WEI curves increased just as TR increased—this was particularly the case for relatively low WER (1–8 Hz)—and the WEI curves were asymptotically dependent on the increasing WER (Fig. 1b). Figure 1c shows the dependence of normalized WEI (to the WEI value at WER = 20 Hz) on WER, wherein decreasing TR from 200 to 5 ms lessened the asymptotic dependence of WEI on WER. Figure 1d shows the sensitivity of WEI (i.e., the derivative of WEI with respect to WER) for detecting changes in WER. Using TR = 40 ms, (T1 of blood after the administration of Gd-PGC) = 200 ms, and Vb = 0.02, WEI sensitivity asymptotically decreases with increasing WER.
FIG. 1.
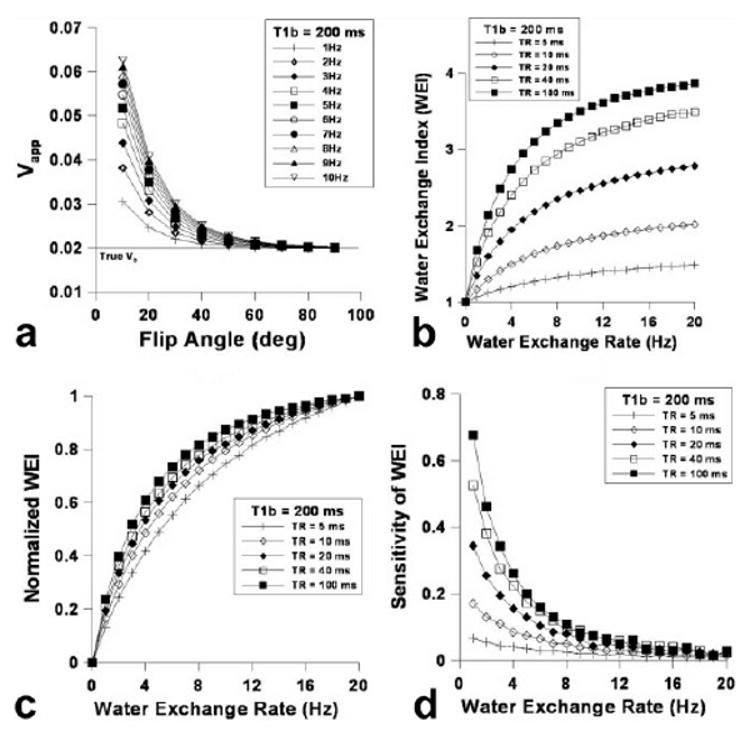
a–d: Simulated Vapp dependence on flip angle varying water exchange rate (WER) using the 3D-SPGR pulse sequence: TR = 0.04 s, Vb = 0.02, and = 0.2 s after the administration of Gd-PGC (a), the calculated water exchange index (WEI) dependence on the WER (b), the normalized WEI dependence on WER (c), and the sensitivity of WEI dependence on WER (i.e., the derivative of WEI with respect to WER) (d).
Figure 2a shows the dependence of Vapp on flip angle and the contrast agent concentration ([C]), for which or was varied from 50 to 500 ms. Much like increasing TR affects WEI, increasing the contrast agent dose (i.e., decreasing ) increased the overall WEI (Fig. 2b), while decreasing reduced the asymptotic dependence of WEI on WER as shown in Figure 2c. The sensitivity of WEI drastically increased with decreasing particularly in the relatively high range of WER. Figure 3 shows (a) the dependence of WEI, (b) the normalized WEI, and (c) the WEI sensitivity on WER using a relatively short TR (i.e., 5 ms). When TR = 5 ms, the overall WEI was reduced in comparison to the relatively high TR (Fig. 2b), although the asymptotic tendency was attenuated with increasing WER (Fig. 3b). The sensitivity of WEI (Fig. 3c) was relatively small compared with a longer TR (Fig. 2d); however, the dependence of sensitivity on the WER was nearly constant over the range of WER for various T1bpost values. Figure 4a shows the blood volume (Vb) measurement accuracy, where the dependence of Vapp on flip angle while Vb was varied from 0.02 to 0.2. The Vb measurement accuracy was greatest when the flip angle was 90°, and nearly independent of the actual Vb value. The simulated WEI decreased as Vb/ Vextra increased, as shown in Figure 4b, independent of WER.
FIG. 2.
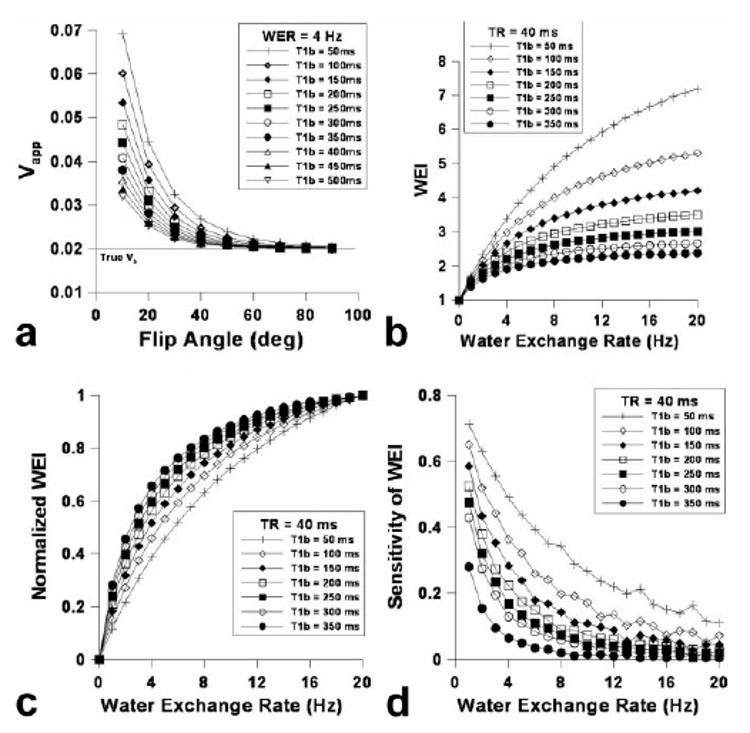
a–d: Simulated Vapp dependence on flip angle varying contrast agent concentration using the 3D-SPGR pulse sequence: TR = 0.04 s, Vb = 0.02, and WER = 4 Hz (a), the calculated water exchange index (WEI) dependence on the water exchange rate (WER) (b), the normalized WEI dependence on WER (c), and the sensitivity of WEI dependence on WER (i.e., the derivative of WEI with respect to WER) (d).
FIG. 3.
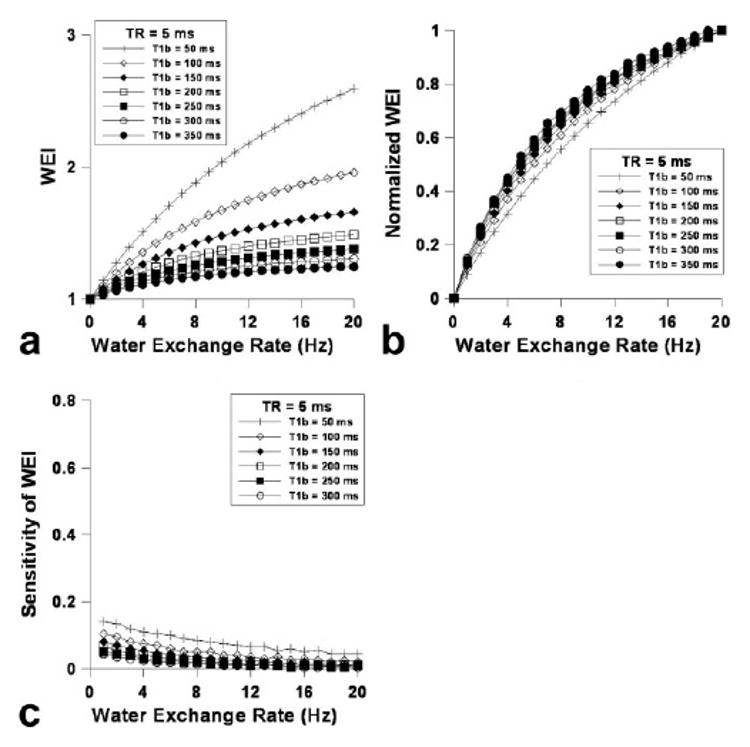
a–c: Calculated water exchange index (WEI) dependence on the water exchange rate (WER) with TR = 0.005 s (a), the normalized WEI dependence on WER (b), and the sensitivity of WEI dependence on WER (i.e., the derivative of WEI with respect to WER; c).
FIG. 4.
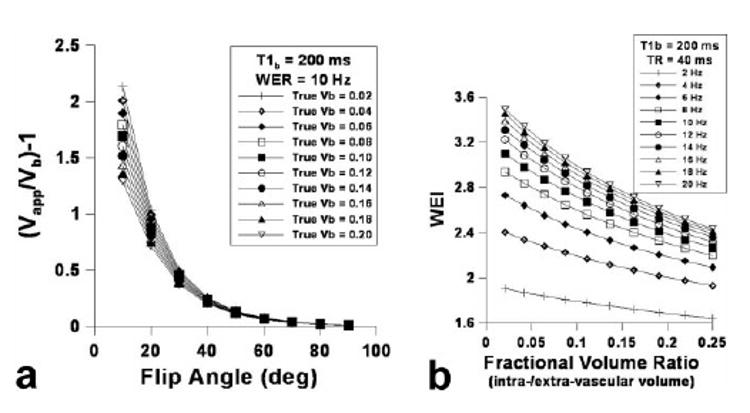
Simulated blood volume measurement accuracy (i.e., Vapp/Vb-1) dependence on flip angle varying true blood volume (Vb) using the 3D-SPGR pulse sequence: TR = 0.04 s, = 0.2 s, and WER = 10 Hz (a) and WEI dependence on the fractional volume ratio (= intravascular volume/extravascular volume) varying WER: TR = 0.04 s, = 0.2 s (b).
Animal Data
WEI measurements were started approximately 1 hour after ischemic onset, immediately after the acquisition of other MRI-derived structural parameters including ADC and T2 maps. We acquired angiograms using maximum intensity projection (MIP), which revealed clear occlusion of the right middle cerebral artery (Fig. 5a). Postcontrast angiograms demonstrate that Gd-PGC is strictly confined within the intravascular space. Meanwhile, the CBF quantified by continuous arterial spin labeling (CASL) showed the overall extent of diminished blood perfusion in both cortical and subcortical areas (Fig. 5b). After the administration of Gd-PGC (molecular mass, ∼ 500,000 Da), the blood pooling was clearly visible in areas including the venous sinuses, from which the signal intensity of blood before and after Gd-PGC (Eq. [1]) was calculated. Gd-PGC (Fig. 5a) did not enhance the T1-weighted signals in stroke lesions visually defined by diffusion-weighted imaging (DWI: Figure 5c). T1-weighted images continuously acquired before and after intravenous injection of Gd-DTPA (∼550 Da) also show that Gd-DTPA did not leak into the extravascular spaces in any of the ischemic mice. Early ischemic lesions detected with DWI correlated well with the spatial extent of injury in T2-weighted images (Fig. 5c).
FIG. 5.
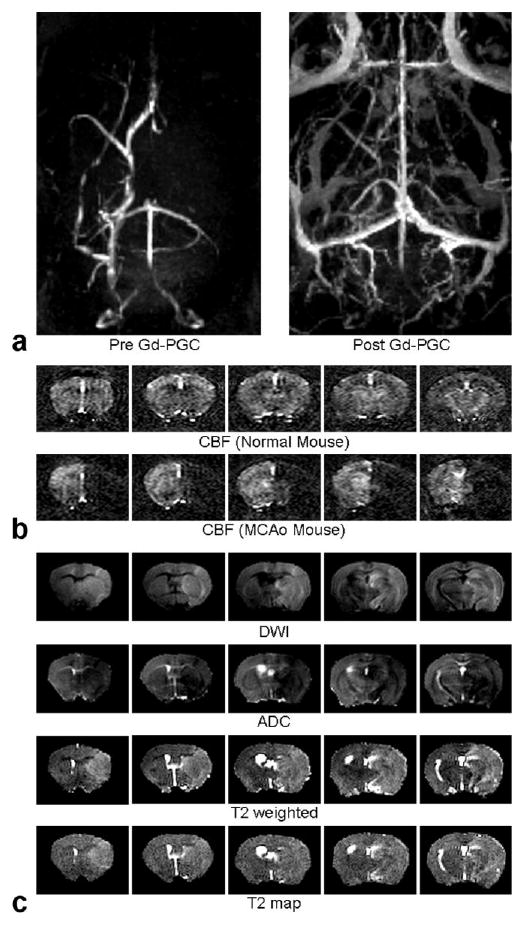
a–c: Representative structural MRI in five coronal slices (slice thickness = 0.75 mm): angiograms (maximum intensity projection) before and after the administration of Gd-PGC (a), cerebral blood flow maps acquired using ASL for normal and MCAo mice (b), DWI (b = 1627 sec/mm2) and ADC maps (∼2 hours after the onset of MCAo), T2 weighted (TR/TE = 3000/80 ms) images, and T2 maps (∼4 hours after the onset of MCAo; c).
For the duration of each study, the WEI was elevated in comparison to the contralesional WEI values as shown in Figure 6a. Figure 6b shows the time-dependent ADC and the measured Vb (or )values. The WEI quantified in the contralateral cortex using the lesion ROI's was significantly lower than that measured in the ipsilesional cortex and remained nearly constant throughout the experiment. After ischemic onset, the measured ADC in the lesion cortex continuously decreased throughout the duration of the study. The fitted exponential time constant (τo) for the ADC decrease in the ipsilateral cortex was 5.51 ± 1.24 hours. The T2 value measured in the lesion area continuously increased over time (data not shown). The ipsilesional cortical blood volume (Vb) was significantly lower than the contralesional value throughout the experiment; the reduced ipsilesional Vb slowly recovered, but remained significantly lower than the contralesional value. We used the T2* values measured before and after Gd-PGC administration to calculate ΔR2* (= 1/ T2*Post- 1/ T2*Pre), which we then used to estimate the relative cerebral blood volume (rCBV) (16). The was 2.14 ± 0.42% in the contralesional cortex while the ipsilesional value was 1.15 ± 0.38% at the 1-hour time point. Similarly, the T2*-derived ipsilesional cortical rCBV ratio (i.e., ΔR2*ipsi/ΔR2*contra = 0.58 ± 0.41 at t = 1 hour) was significantly smaller than that measured in normal control mice (ΔR2*ipsi/ΔR2*contra ∼1) for all time points.
FIG. 6.
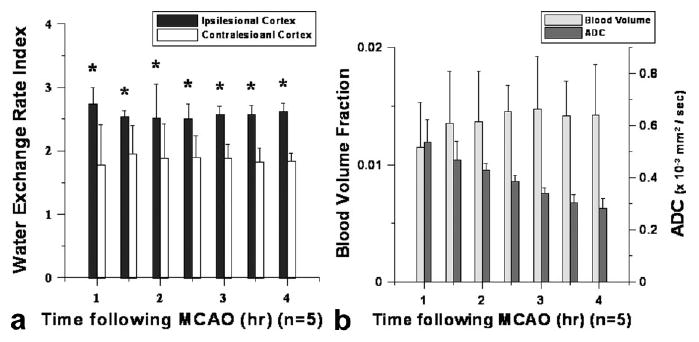
a,b: Measured water exchange rate index (WEI) (a) and ratio (ipsi/contra) of apparent blood volume ( ) and apparent diffusion coefficient (ADC; b): quantified from ROIs placed over ipsilesional and contralesional cortices.
Ipsilesional levels increased slightly from ∼1.2 to ∼1.5% during the experiment (Fig. 6b). Correction of Vb using the fractional volume ratio (Vb(t)/Vitst(t)) based on the temporally decaying ipsilesional ADC values had a negligible effect on the ipsilesional Vb. Similarly, the time independence of WEI was minimally affected when Vb(t)/Vitst(t) was used to adjust WEI due to the intrinsically small Vb. Furthermore, we considered a possible dependence of interstitial water residence time (τitst) on interstitial diffusion (Ditst), based on the previous observations in which decreasing diffusion in a compartment nonlinearly affected the mean water residence time (17). Specifically, increasing τitst caused by a drop in ADC in the lesion area resulted in a relative reduction in WEI. When corrected, the ∼30% increase in τitst derived from a ADC decrease from 0.7 × 10⁻⁹ to 0.3 × 10⁻⁹ m2/s, according to Regan and Kuchel (17), resulted in ∼12% increase in measured WEI in the ipsilesional cortex, suggesting an appreciable time dependence.
Discussion
Methods for efficiently and accurately assessing blood-brain-barrier (BBB) damage, in the acute and sub-acute stages of stroke progression are highly important for understanding the biological and mechanistic links between changes in vascular physiology and stroke-induced tissue degradation. The dysfunction of the protective BBB has critical ramifications that manifest in the brain hemorrhage and vasogenic edema. Consequently, it is necessary to design an in vivo technique to quantify early stroke-induced BBB disruption, which may provide effective treatment options and methods for evaluating the efficacy of pharmacological intervention. The acute changes in vascular permeability have frequently been measured in stroke studies to demonstrate the severity of stroke, predicting overall outcomes, and understand impaired cerebrovascular function in the course of stroke progression. Although it has been presumed that BBB damage worsens progressively over time, vascular damages in the hyperacute stage are difficult to quantify using the leakage profile from intra- to extravascular spaces. The extravasation of extrinsic molecules appears to be dependent on the size and charge of agents and predominantly occurs after ∼2 to 3 hours after thrombolysis (8,18).
Along with the recently growing awareness about the need for acute treatment of pathologic vascular conditions, our previous observations in brain tumor model studies and the quantification technique of water exchange rate (WER) between intra- and extravascular spaces form the basis of the design of our current study (2,12). Because our strategy uses intrinsic and biologically relevant water molecules as a quantification marker, it has a distinct advantage over other commonly-used vascular permeability measurement strategies that use leaky extrinsic molecules (e.g., contrast agents). Measurements based on permeability markers are also susceptible to hemodynamic features such as hydrostatic pressure and perfusion. The steady state WER technique preempts such limitations and allows the direct quantification of the transvascular water movement which is inherent even in intact normal brains. However, thus far, factors such as the relatively long acquisition time required for T1 measurement, small cerebral blood volume fraction (2∼3%), and the lack of available intravascular T1 contrast agents have prevented wide spread usage of the WER quantification technique. In the current study, we have hypothetically reduced the measurement time by introducing a water exchange index (WEI), which can be acquired within minutes and eliminates prolonged calculations, and by enhancing the signal-to-noise ratio (SNR) using high-field 9.4 Tesla (T) MRI and a 3D pulse sequence. Additionally, recent advances in clinically available intravascular blood pool agents (i.e., Vasovist® approved in the European Union) may support the practical feasibility of this technique.
Using an initial computer simulation of water exchange scenarios (Fig. 1a), we arrived at the conclusion that the actual Vb can be calculated using a 3D SPGR pulse sequence in conjunction with a relatively large flip angle. Our cortical (2.14 ± 0.45%) matches well with the cortical blood volume of the murine brain, quantified using various other techniques (12,19). Because the flip angle dependence of (Fig. 1a) was used to evaluate a secondary marker (i.e., WEI) to describe transvascular water movement, the calculated WEI was not linearly proportional to the WER. Therefore, it is necessary to characterize the measurable range of WER and the degrees of sensitivity. Figure 1b describes the dependence of the simulated WEI on WER, whereby increasing TR resulted in increased WEI values (Fig. 1b). However, increasing the TR of the 3D SPGR pulse sequence made the dependence of WEI on WER less linear (Fig. 1c) and only amplified the sensitivity of the WEI technique in the lower WER range (Fig. 1d). On the other hand, despite the slightly elevated overestimation of Vb over all flip angles with increasing Gd-PGC dose, Vb can be measured using a high flip angle with a relatively high accuracy (error < 5% of Vb using α = 90°) as shown in Figure 2a. The simulation indicates that increasing the contrast agent dose is advantageous for WER-affected measurements of WEI in several ways, providing (1) improved linearity between WEI and WER, and thus providing the proportional representation of WER (Fig. 2c), and (2) increased sensitivity over a larger range of WER (Fig. 2d).
Reducing the TR further improves the proportional linearity between WEI and WER; however, it also decreases the sensitivity of WEI over the total WER values (Fig. 3). More importantly, the fractional volume ratio between intra- and interstitial spaces (i.e., blood volume (Vb) and effective interstitial space (Vitst)) significantly affects the accuracy of the WEI measurements. Because the extravascular space is composed of an intracellular compartment and an interstitial space filled with various stromal matrices, the current simulation using the two-compartment model is probably limited in that the extracellular/extravascular space is treated as a single effective compartment that allows the fast mixing of water molecules. Figure 4a reveals that the calculated WEI is indeed dependent on the fractional ratio between blood volume and effective interstitial volume fraction. For a temporally stable (i.e., normal) tissue environment, the fractional ratio probably is not an influential factor on WEI measurement accuracy. However, dynamic cellular and hemodynamic changes during stroke progression are highly time-dependent and could provide complex factors that might affect the measurement accuracy of WEI.
In the current study, we observed a temporal trend of increase in the ipsilesional cortex, which may have been caused by two possible factors. (1) Cytotoxic edema or increased cellular volume over time reduces the Vitst, and thereby the fractional volume ratio-related exchange effect alters the quantified .(2) The loss of vascular tonus causes vascular dilation (especially at peri-infarct regions: unpublished data). Nonetheless, the simulation suggests that the effect of the former is only marginal with such low intrinsic blood volume in the ipsilesional brain (< 1%). Thus, the increased blood volume in the ipsilesional cortex was most likely caused by vasodilation in peri-infarct areas. We can infer from the time-dependent cytotoxic edema and the temporal trend of increasing Vb that the fractional volume ratio (Vb/Vitst) rapidly increases after the onset of stroke. Simulations further indicate that the increase in Vb/Vitst in ischemic brain tissue can significantly underestimate WEI measurements (Fig. 4b). In addition, a strong body of evidence revealed that water diffusion decreases in both the intracellular and interstitial compartments in hyper-acute stages of stroke, where mixing of protons becomes significantly limited in both compartments. The reduced water diffusion in Vitst interferes with the assumption of fast mixing of water molecules, which is adopted by the two-compartment model used for calculating WEI. As such, to properly estimate the WEI independent of rapidly evolving biological milieu, it is necessary to consider the spectrum of biophysical changes during stroke progression in addition to the aforementioned characterization of exchange-affected MR signal.
The distribution of the long-circulating Gd-PGC is clearly visible in various blood pools of the brain, while the angiogram acquired before Gd-PGC administration depicts the occlusion of the right MCA (Fig. 5a). As CBF maps show (Fig. 5b), the extent of significantly reduced blood perfusion induced by the permanent MCAo encompasses both cortical and subcortical areas. The lesion areas defined by structural MRI (i.e., DWI and T2-weighted) matched well. Technically, to avoid inflow effects in the calculation of WEI, we used a 3D pulse sequence; we obtained the intravascular SI measurements (denominator of Eq. 1) from the venous sinuses. WEI corrections were made assuming hypothetical temporal changes in the Vb/Vitst, based on the time courses of the ADC decay (4). Because the infarct region WEI may be either over- or under-estimated by the evolving compartment volume differences, as a first pass, we assumed a proportional relationship between the effective extravascular space and the relative ADC value. Despite significant changes in Vitst, upon correction, factoring in Vb(t)/Vitst(t) changes did not affect the temporal trend of WEI due to the intrinsically small ipsilesional cerebral Vb. However, we can predict that when the available blood volume is high (e.g., reperfusion), the effect of variable Vb(t)/Vitst(t) could significantly influence the accuracy of WEI measurements.
We performed additional corrections of WEI measurements considering an altered diffusion-affected water residence time, because, according to the previous study by Regan and Kuchel, the intracellular water residence time is dependent on the intracellular diffusion (17). In particular, for a spherical compartment, diffusion rates below ∼0.5 × 10⁻⁹ m2/s significantly affect the compartmental water residence time. Analogous to such observations, the residence time of water molecules in the interstitial space may be affected by severe reduction of ipsilesional ADC(t) (∼0.3 × 10⁻⁹ m2/s at t = 4 hours). Although in this study we did not explicitly calculate the hypothetical increment of diffusion-affected water residence time (e.g., Monte Carlo simulation), we wish to point out that the reduced Ditst is, in fact, within the range that becomes highly sensitive to τitst. The increase in τitst can be translated to the reduced WER, as the mass exchange relationship used in the two-compartment model (i.e., Vitst/τitst = Vb/τb) becomes limited by the reduction in Ditst during stroke progression. In fact, the increase in τitst (i.e., due to reduction of Ditst from 0.7 × 10⁻⁹ m2/s to 0.3 × 10⁻⁹ m2/s) directly influences the accuracy of WEI measurements and results in the underestimation of WEI. When diffusion-related τitst corrections were applied in addition to the adjustment with Vb(t)/Vitst(t), the ipsilesional time-dependence of WEI substantially increased, revealing possibility of progressive BBB damage.
In vivo WEI measurements suggest a significant drop in Vb and an early rise in WER in the infarct cortex at t ∼ 1 hour, as shown in Figure 6a. Similarly, Figure 4a shows that the increase or decrease of Vb/Vitst reduces or elevates WEI, respectively. However, due to an equivalent drop in Vitst(t ∼ 1 hour), Vb/Vitst is not altered at t ∼ 1 hour. Additional effects of reduced Ditst on τitst are probably negligible because Ditst remained greater than 0.5 × 10⁻⁹ m2/s, the critical diffusion rate below which τitst is significantly affected. Therefore, the measured WEI at t ∼ 1 hour was not affected by either the altered Vb/Vitst or the restricted Ditst in the cortical infarct, suggesting significant acute damage to the integrity of the BBB. The time-independent WEI value of the ipsilesional cortex beyond t ∼ 1 hour was somewhat surprising considering that BBB damage is, presumably, progressive. As mentioned above, such discrepant trends may be caused by the following hypothetical factors. (i) The measurement sensitivity of WEI is attenuated as the WER increases (Figs. 1–3), suggesting that the further elevation of WEI or subtle changes in WEI may not be quantifiable using the current study method. (ii) Continuously augmenting Vb(t)/Vitst(t) over time suppresses the inherently increasing trend of WEI in the infarct tissue, even though simulations indicate that this may not be the case. (iii) The alteration in τitst caused by the restriction of Ditst underestimates the WEI.
Possible errors in measurement accuracy and model interpretation arise from a lack of evidence and unrealistic simplifications. For example, two different studies by Pfeuffer et al. and Quirk et al. have reported widely varying residence time for the cerebral intracellular water molecules, at τcell ∼ 15 and 500 ms, respectively (14,20). Our study assumed impermeable cellular membrane (2), which is likely altered during the course of cytotoxic edema. Moreover, the intra-compartment water residence time (τi) may be nonlinearly affected by the intra-compartmental volume (Vi) as Pfeuffer et al. showed that the 20% change in Vi resulted in only a ∼10% increase in τi (20). Moreover, the relationship between the rate of diffusion and affected τitst, acquired in the in vitro setting, could differ from the highly variable in vivo condition. For such reasons, although the WEI revealed a positive time-dependence when corrected for Vb(t)/Vitst(t) and ADC decay, our model may have been oversimplified for accurately evaluating the time-dependent contribution of the altered transvascular water exchange rate. On the other hand, the increased blood flow and glucose consumption in infarct penumbra may give rise to the observed WEI increase as the energy demand elevates in such regions. An increased net flux of water always occurs when brain activity increases compared with the normal resting state. Therefore, it can be suggested that there is a complementary increase of water flux across the endothelial cell wall (essentially by means of AQP4) to the glial endfoot. Hypothetically, based on such interpretations, the observed phenomenon may not require an actual BBB disintegration because it is an essential behavior as long as the penumbra remains normoxic. Nonetheless, the elevated WEI values and other related evidence gained from simulations strongly suggest ischemia-affected water movements across the BBB, even at a highly acute stage of stroke progression and despite the presence of factors that may affect measurement accuracy.
It has been frequently documented that cytotoxic edema precedes stroke-induced vascular changes. Conventionally, the assessment of cerebrovascular damage involves using spatial and temporal leakage profiles of molecular markers from intra- to extravascular spaces. The size of documented molecular markers used in previous studies ranges from 500 to 1000 Da with varying charge characteristics (8,9). Therefore, as Nagaraja et al. have suggested in an acute stroke models (21), there is probably a contrast agent size-dependent threshold for the detection of the dysfunctional BBB that allows the initial leak. By using the intrinsic water molecule as a quantification marker, the current study bypasses such a threshold and shows that the integrity of the BBB is affected in acute stages of ischemia. Despite of significant increases in the WEI, none of the mice used in the current study exhibited leakage of Gd-DTPA. The lack of Gd-DTPA leakage is probably due to relatively low level BBB damage and/or reduced local hydrostatic static pressure caused by the permanent occlusion. Interestingly, the WEI elevation in the cortical infarct is not preceded by but is altered concurrently with initial ADC decay within the time window allowed for the experiment, suggesting parallel evolution of the vascular and cellular transformations. Only recently, has the need for intervention for vascular protection at acute stages of stroke been addressed (2,22). In support of this assertion, the results of this study indicate that the initiation of progressive vascular damage probably occurs earlier than that previously thought and warrants future studies to better understand the underlying biochemical mechanisms of acute vascular degeneration in stroke.
Our observation of acute BBB impairment may reveal a new perspective for understanding stroke-induced vascular transformation with regard to both reversible and irreversible ischemic damage. For future studies, it will be important to characterize the biochemical and physiological basis of changes in transvascular water movement using immunohistochemical assays (e.g., AQP4) and other relevant measurements (e.g., glucose consumption). In addition, the preservation and deterioration of basal vascular functions should be scrutinized by using various vascular stimuli, for instance, exposure to various gases (e.g., O2 and CO2) to physiologically define the degree of vascular dysfunction. More importantly, a possible correlative relationship between hypertension and the potentially impaired integrity of the BBB before critical hemorrhage formation should be investigated using the strategy presented herein, to provide a possible preventive approach in stroke research. As such, our attempt to characterize acute vascular damages by transvascular WER is largely a work in progress, but may provide a basis for understanding early vascular impairments at acute phases of stroke progression. In conclusion, we demonstrated early alteration of vascular barrier function and showed that stroke-induced changes to BBB integrity can be quantitatively characterized by measuring the transvascular water exchange rate.
Acknowledgments
The authors gratefully acknowledge the financial support from NIH-NIBIB grant 2R01EB002066.
References
- 1.Matsumoto K, Lo EH, Pierce AR, Wei H, Garrido L, Kowall NW. Role of vasogenic edema and tissue cavitation in ischemic evolution on diffusion-weighted imaging: comparison with multiparameter MR and immunohistochemistry. AJNR Am J Neuroradiol. 1995;16:1107–1115. [PMC free article] [PubMed] [Google Scholar]
- 2.Fagan SC, Hess DC, Machado LS, Hohnadel EJ, Pollock DM, Ergul A. Tactics for vascular protection after acute ischemic stroke. Pharmacotherapy. 2005;25:387–395. doi: 10.1592/phco.25.3.387.61592. [DOI] [PubMed] [Google Scholar]
- 3.Ozsunar Y, Grant PE, Huisman TA, Schaefer PW, Wu O, Sorensen AG, Koroshetz WJ, Gonzalez RG. Evolution of water diffusion and anisotropy in hyperacute stroke: significant correlation between fractional anisotropy and T2. AJNR Am J Neuroradiol. 2004;25:699–705. [PMC free article] [PubMed] [Google Scholar]
- 4.Sotak CH. Nuclear magnetic resonance (NMR) measurement of the apparent diffusion coefficient (ADC) of tissue water and its relationship to cell volume changes in pathological states. Neurochem Int. 2004;45:569–582. doi: 10.1016/j.neuint.2003.11.010. [DOI] [PubMed] [Google Scholar]
- 5.Lythgoe MF, Thomas DL, Calamante F, Pell GS, King MD, Busza AL, Sotak CH, Williams SR, Ordidge RJ, Gadian DG. Acute changes in MRI diffusion, perfusion, T(1), and T(2) in a rat model of oligemia produced by partial occlusion of the middle cerebral artery. Magn Reson Med. 2000;44:706–712. doi: 10.1002/1522-2594(200011)44:5<706::aid-mrm8>3.0.co;2-1. [DOI] [PubMed] [Google Scholar]
- 6.Pluta R, Gajkowska B. Ultrastructural changes in the sensomotor cortex of the rabbit after complete 30-min brain ischemia. J Neurosci Res. 1984;11:35–47. doi: 10.1002/jnr.490110105. [DOI] [PubMed] [Google Scholar]
- 7.Shima K. Hydrostatic brain edema: basic mechanisms and clinical aspect. Acta Neurochir Suppl. 2003;86:17–20. doi: 10.1007/978-3-7091-0651-8_4. [DOI] [PubMed] [Google Scholar]
- 8.Jiang Q, Ewing JR, Ding GL, Zhang L, Zhang ZG, Li L, Whitton P, Lu M, Hu J, Li QJ, Knight RA, Chopp M. Quantitative evaluation of BBB permeability after embolic stroke in rat using MRI. J Cereb Blood Flow Metab. 2005;25:583–592. doi: 10.1038/sj.jcbfm.9600053. [DOI] [PubMed] [Google Scholar]
- 9.Gotoh O, Asano T, Koide T, Takakura K. Ischemic brain edema following occlusion of the middle cerebral artery in the rat: I. The time courses of the brain water, sodium and potassium contents and blood-brain barrier permeability to 125I-albumin. Stroke. 1985;16:101–109. doi: 10.1161/01.str.16.1.101. [DOI] [PubMed] [Google Scholar]
- 10.Vajda Z, Pedersen M, Fuchtbauer EM, Wertz K, Stodkilde-Jorgensen H, Sulyok E, Doczi T, Neely JD, Agre P, Frokiaer J, Nielsen S. Delayed onset of brain edema and mislocalization of aquaporin-4 in dystrophin-null transgenic mice. Proc Natl Acad Sci U S A. 2002;99:13131–13136. doi: 10.1073/pnas.192457099. [DOI] [PMC free article] [PubMed] [Google Scholar]
- 11.Frydenlund DS, Bhardwaj A, Otsuka T, Mylonakou MN, Yasumura T, Davidson KG, Zeynalov E, Skare O, Laake P, Haug FM, Rash JE, Agre P, Ottersen OP, Amiry-Moghaddam M. Temporary loss of perivascular aquaporin-4 in neocortex after transient middle cerebral artery occlusion in mice. Proc Natl Acad Sci U S A. 2006;103:13532–13536. doi: 10.1073/pnas.0605796103. [DOI] [PMC free article] [PubMed] [Google Scholar]
- 12.Kim YR, Rebro KJ, Schmainda KM. Water exchange and inflow affect the accuracy of T1-GRE blood volume measurements: implications for the evaluation of tumor angiogenesis. Magn Reson Med. 2002;47:1110–1120. doi: 10.1002/mrm.10175. [DOI] [PubMed] [Google Scholar]
- 13.Bogdanov AA, Jr, Weissleder R, Frank HW, Bogdanova AV, Nossif N, Schaffer BK, Tsai E, Papisov MI, Brady TJ. A new macromolecule as a contrast agent for MR angiography: preparation, properties, and animal studies. Radiology. 1993;187:701–706. doi: 10.1148/radiology.187.3.8497616. [DOI] [PubMed] [Google Scholar]
- 14.Quirk JD, Bretthorst GL, Duong TQ, Snyder AZ, Springer CS, Jr, Ackerman JJ, Neil JJ. Equilibrium water exchange between the intra- and extracellular spaces of mammalian brain. Magn Reson Med. 2003;50:493–499. doi: 10.1002/mrm.10565. [DOI] [PubMed] [Google Scholar]
- 15.Regan DG, Kuchel PW. Simulations of NMR-detected diffusion in suspensions of red cells: the effects of variation in membrane permeability and observation time. Eur Biophys J. 2003;32:671–675. doi: 10.1007/s00249-003-0331-x. [DOI] [PubMed] [Google Scholar]
- 16.Zaharchuk G, Mandeville JB, Bogdanov AA, Jr, Weissleder R, Rosen BR, Marota JJ. Cerebrovascular dynamics of autoregulation and hypoperfusion. An MRI study of CBF and changes in total and microvascular cerebral blood volume during hemorrhagic hypotension. Stroke. 1999;30:2197–2204. doi: 10.1161/01.str.30.10.2197. discussion 2204-2195. [DOI] [PubMed] [Google Scholar]
- 17.Regan DG, Kuchel PW. Mean residence time of molecules diffusing in a cell bounded by a semi-permeable membrane: Monte Carlo simulations and an expression relating membrane transition probability to permeability. Eur Biophys J. 2000;29:221–227. doi: 10.1007/s002490000081. [DOI] [PubMed] [Google Scholar]
- 18.Ding G, Jiang Q, Li L, Zhang L, Gang Zhang Z, Ledbetter KA, Ewing JR, Li Q, Chopp M. Detection of BBB disruption and hemorrhage by Gd-DTPA enhanced MRI after embolic stroke in rat. Brain Res. 2006;1114:195–203. doi: 10.1016/j.brainres.2006.07.116. [DOI] [PubMed] [Google Scholar]
- 19.Pathak AP, Schmainda KM, Ward BD, Linderman JR, Rebro KJ, Greene AS. MR-derived cerebral blood volume maps: issues regarding histological validation and assessment of tumor angiogenesis. Magn Reson Med. 2001;46:735–747. doi: 10.1002/mrm.1252. [DOI] [PubMed] [Google Scholar]
- 20.Pfeuffer J, Flogel U, Leibfritz D. Monitoring of cell volume and water exchange time in perfused cells by diffusion-weighted 1H NMR spectroscopy. NMR Biomed. 1998;11:11–18. doi: 10.1002/(sici)1099-1492(199802)11:1<11::aid-nbm498>3.0.co;2-e. [DOI] [PubMed] [Google Scholar]
- 21.Nagaraja TN, Keenan KA, Brown SL, Fenstermacher JD, Knight RA. Relative distribution of plasma flow markers and red blood cells across BBB openings in acute cerebral ischemia. Neurol Res. 2007;29:78–80. doi: 10.1179/174313206X153815. [DOI] [PubMed] [Google Scholar]
- 22.Fagan SC, Hess DC, Hohnadel EJ, Pollock DM, Ergul A. Targets for vascular protection after acute ischemic stroke. Stroke. 2004;35:2220–2225. doi: 10.1161/01.STR.0000138023.60272.9e. [DOI] [PubMed] [Google Scholar]