Abstract
Rationale and Objectives
The presence of opacified materials presents several technical challenges for automated detection of polyps in fecal-tagging CT colonography (ftCTC), such as pseudo-enhancement and the distortion of the density, size, and shape of the observed lesions. We developed a fully automated computer-aided detection (CAD) scheme that addresses these issues in automated detection of polyps in ftCTC.
Materials and Methods
Pseudo-enhancement was minimized by use of an adaptive density correction (ADC) method. The presence of tagging was minimized by use of an adaptive density mapping (ADM) method. We also developed a new method for automated extraction of the colonic wall within air-filled and tagged regions. The ADC and ADM parameters were optimized by use of an anthropomorphic phantom. The CAD scheme was evaluated with 32+32 cases from two types of clinical ftCTC databases. The cases of database I had full cathartic cleansing and 40 polyps ≥6 mm, and the cases of database II had reduced cathartic cleansing and 44 polyps ≥6 mm. The by-polyp detection performance of the CAD scheme was evaluated by use of a leave-one-patient-out method with 5 features, and the results were compared with those of a conventional CAD scheme by use of free-response receiver operating characteristic curves.
Results
The CAD scheme detected 95% and 86% of the polyps ≥6 mm with 3.6 and 4.2 FPs per scan on average in databases I and II, respectively. For polyps ≥10 mm, the detection sensitivity was 94% in database I (with one missed hyperplastic polyp) and 100% in database II. The detection sensitivity of the new CAD scheme was approximately 20% higher than that of the conventional CAD scheme.
Conclusion
The results show that the CAD scheme developed in this study resolves the technical challenges introduced by fecal tagging, is applicable to a variety of colon preparation regimens, and provides a performance superior to that of conventional CAD schemes.
Keywords: computer-aided detection, CAD, fecal tagging, CT colonography, virtual colonoscopy
1 Introduction
Colorectal cancer is one of the three leading causes of cancer-related mortalities in the United States. Approximately 148,000 new cases and 55,000 deaths from colon cancer were estimated to occur in 2006 [1]. Screening can reduce colon cancer by facilitating the detection and removal of pre-cancerous polyps. Colonoscopy is considered to have the highest diagnostic performance for screening of colon cancer, but it also has a high cost, the risk of complications, and problems with patient compliance [2].
Minimally invasive computed tomographic colonography (CTC, also known as virtual colonoscopy) can potentially yield a high diagnostic performance in the detection of clinically significant polyps [3]. As with colonoscopy, proper bowel preparation is necessary with CTC for confident detection of colorectal lesions. Residual materials and poor distension can reduce the sensitivity of CTC by obscuring polyps, and solid fecal materials can reduce the specificity of CTC by imitating polyps. The presence of fecal materials can be minimized by use of cathartic cleansing of the colon. However, cathartic cleansing is also a major barrier for patient compliance [4].
In fecal-tagging CT colonography (ftCTC), the residual materials are opacified by use of orally administered high-density tagging agents. Fecal tagging facilitates the differentiation of polyps from tagged residual materials, and it enables the detection of polyps covered by tagged materials. In the most successful large-scale CTC study to date, the use of cathartic cleansing and ftCTC was combined [3]. Other recent ftCTC studies have demonstrated promising results also when cathartic cleansing was minimized or omitted [5–7].
CTC studies have indicated a large variability in observer performance in the detection of polyps [8]. Computer-aided detection (CAD) could be used to reduce the performance variability and to increase radiologists' diagnostic performance in CTC by automatically pointing out suspicious lesions to the radiologists [9,10]. Several semi-automated and fully automated CAD schemes have demonstrated a high sensitivity and a low false-positive (FP) rate in the detection of colorectal lesions in CTC [11]. However, most of these early CAD schemes were developed for use with CTC without fecal tagging (which we will denote as nCTC in this paper).
In ftCTC, the presence of a fecal-tagging agent in CTC data introduces several technical challenges for the application of CAD. The first problem is the effect of pseudo-enhancement (PEH). In nCTC, soft-tissue materials, such as polyps, are expected to have CT attenuations of ≤100 HU. In ftCTC, high-density tagging artificially increases the observed density of nearby materials, and pseudo-enhanced polyps may demonstrate CT attenuations of up to >500 HU. Furthermore, the effect of the PEH varies greatly according to the amount, thickness, and radiodensity of tagged materials, and it can vary substantially even between different regions of the same colon. Therefore, CT attenuation is not a reliable feature for automated identification of tagged regions in ftCTC. This is a serious disadvantage for the application of CAD. Because of the PEH, automatically extracted regions of polyps may appear smaller than the actual regions of the polyps, and they may be distorted in shape. This can reduce the detection sensitivity and specificity of CAD.
A second problem is that fecal tagging affects the calculation of most shape and texture features. Ideally, voxels that represent tagged regions in ftCTC would represent air in nCTC. However, because air has a lower CT attenuation than does soft tissue, and because tagged regions have a higher CT attenuation than does soft tissue, soft-tissue regions covered by tagging are negative image regions as opposed to soft-tissue regions covered by air. Such changes in CT attenuation can change the direction of the gradient of CT attenuation and the principal curvature of the local surface. Therefore, shape features that use the principal surface curvature may for example indicate that polyps covered by tagging have concave rather than the visually perceived convex shapes. Furthermore, because of the variable effects of tagging, it is not obvious where, how, and how much the measured shape and texture features should be adjusted to correct for these effects.
The tagging and the PEH also present problems for the automated extraction of the colon, which is an important part of any automated CAD scheme for CTC. Even if tagging is not used, fully automated colon extraction is a challenging problem in cases where the colonic lumen is split into multiple disconnected components, some of which may be separated in distance, because of collapsed regions. Although the visible regions of colonic lumen can be reconnected over the collapsed segments of the colon [12], pieces of small bowel could be included in the extracted region. The presence of tagging can further complicate the colon extraction, because thin walls between the colon and small bowel may become invisible in the ftCTC data due to the PEH. This can result in complex networks of interconnected lumen paths between the colon and small bowel. In ftCTC, the colon is also more often connected to the small bowel through an open ileocecal valve than in nCTC, because the opacified fluid at the ileocecal valve facilitates tracking of the colonic lumen directly into the small bowel. Yet another problem is that osseous structures and tagged materials have similar CT attenuation values in ftCTC, and the differentiation between these materials may become challenging in cases where tagged regions and osseous structures appear to be directly connected because of the partial-volume effect and the PEH.
Hardly any studies have presented explicit CAD methods for the detection of polyps in ftCTC cases. Summers et al. [13] detected polyps submerged in opacified fluid by reversing the sign of the principal components of surface curvature, but did not present details of the method or its integration with the detection of polyps in air-filled regions. A large-scale evaluation of the resulting semi-automated CAD scheme with cathartically cleansed ftCTC cases indicated that only 31% of submerged polyps ≥6 mm were detected by the method at a low 61% overall detection sensitivity for adenomas ≥6 mm with approximately 4 FPs per scan, and that only 89% of the large ≥10 mm adenomas were detected by the scheme [14]. Another method of automated polyp detection for ftCTC was presented by Zalis et al. [15], who employed digital subtraction bowel cleansing (DSBC) for elimination of the effects of tagging from minimally cathartic ftCTC data before the application of a fully automated CAD scheme. Although the CAD scheme was able to detect 100% of the polyps ≥6 mm in the study, the relatively high number of 7 FPs per scan on average was attributed at least partially to artifacts introduced by the DSBC.
In this study, for addressing the above problems of ftCTC, we developed a new fully automated CAD scheme, called an ftCAD scheme, for the detection of polyps in ftCTC. To our knowledge, this is the first fully automated ftCAD scheme that explicitly addresses as well as resolves the above technical challenges of automated detection of colorectal polyps in ftCTC. In our approach, the problem of PEH is addressed by preprocessing of the ftCTC data with a previously developed adaptive density correction (ADC) method (see Section 2.2). After the application of the ADC, we minimize the effects of tagging on shape and texture features by use of an adaptive density mapping (ADM) method (see Section 2.3). We also developed a new method for the extraction of the colon in ftCTC cases (see Section 2.4). The parameters of the ADC and ADM methods were optimized by use of an anthropomorphic phantom; the parameter optimization is described in Section 2.5.
Because many polyps might not be covered by tagged materials in ftCTC cases, it is not obvious whether the ftCAD scheme provides a superior performance over that of a conventional CAD scheme developed for use with CTC cases without fecal tagging (nCAD), even if ftCTC cases are used. Therefore, to evaluate the benefit of the new methods developed in this study, we compared the performance of the ftCAD scheme with that of a previously developed nCAD scheme which is described in Refs. [16,17] and [10]. Furthermore, because colon preparation can have a significant effect on the difficulty of polyp detection, we evaluated the two CAD schemes by use of two different types of ftCTC databases. Database I included 32 polyp cases with full cathartic cleansing, and database II included 32 polyp cases with reduced cathartic cleansing. Although the colon preparation of Database I may provide nearly optimal bowel conditions for the application of CAD, the preparation of Database II is expected to be better tolerated and more acceptable to patients in large-scale screening applications [5,20,7]. Thus, our study also demonstrates the potential benefit of CAD under a variety of colon preparation conditions.
2 Materials and Methods
2.1 Detection of polyps
Because our nCAD scheme has been presented in detail elsewhere [16,17,10], here we present only a brief overview of the detection of polyps in this scheme. In nCTC, this scheme has routinely yielded 90–95% detection sensitivities for polyps ≥5 mm at 1–3 FP detections per scan on average [18,19].
The detection of polyps is based upon two volumetric rotation-invariant shape features: the shape index (SI) and the curvedness (CV) [10]. The SI characterizes the topologic 3-D shape of the local iso-intensity surface patch in the vicinity of a voxel, and the CV characterizes the flatness of the shape indicated by the SI. Polyp candidates are detected by the application of hysteresis thresholding of the SI and CV features. The complete regions of the detected polyp candidates are extracted by use of conditional morphologic dilation [18]. False positives are reduced by the application of a Bayesian neural network (BNN) [21] based on shape and texture features calculated from the regions of polyp candidates [22]. The final output of the CAD scheme is determined based upon the decision surface generated by the BNN [10]. All of these steps are fully automated.
2.2 Adaptive density correction (ADC) method
We employed the ADC method to minimize the effects of PEH in ftCTC data as an automated preprocessing step for CAD (Figure 1). Because the ADC method has been described and evaluated in detail in Refs. [23] and [24], here we provide only a brief overview of the method.
Fig. 1.
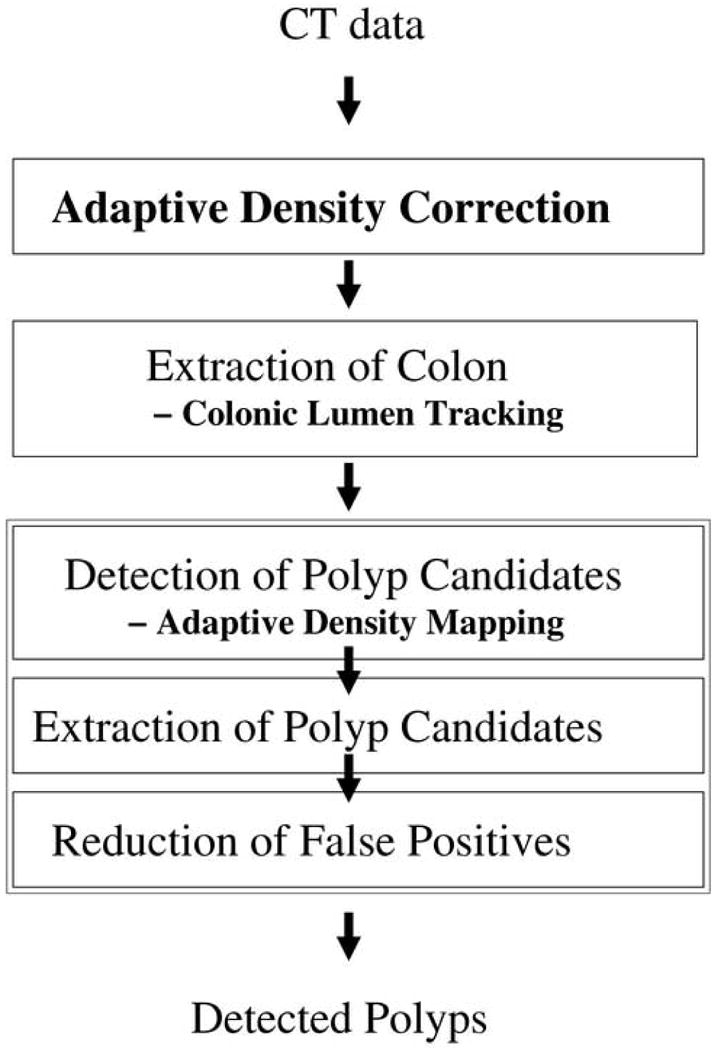
An overview of the ftCAD scheme.
The scattering of X-rays caused by physical interactions of the X-rays with the target volume becomes more dominant as the physical density of the target material, such as tagging agent, increases [23]. To approximate this effect, let vI(p) denote the observed CT attenuation in Hounsfield units (HU) at voxel p of input volume I, and let vˆI(p) denote the actual radiodensity of p without the effect of PEH. Then, the observed CT attenuation of p can be represented as
| (1) |
where the additive term vI(p)PEH represents the effect of PEH at p. We estimate this term by modeling of the PEH as an iterative additive Gaussian effect as follows: Each voxel q with a high value of CT attenuation distributes residual pseudo-enhancement “energy” r0(q) to its neighboring voxels p according to a Gaussian function. This distributed energy is redistributed iteratively according to
| (2) |
where σ2(rn−1(q)) represents the Gaussian spread of the distributed residual energy at q at iteration n − 1, and is the Euclidean distance between p and q. At each iteration, the residual energy that was distributed during previous iteration is redistributed according to Eq. (2). The iteration terminates when the redistributable energy becomes negligible. Then, the PEH is minimized by
| (3) |
where N is the number of iterations. An advantage of ADC is that it uses only the output data of a CT scanner, and thus it can be applied retrospectively to any CTC or ftCTC cases. After the application of the ADC, we can assume that CT attenuations ≤tT (tT ≈ 100 HU) represent untagged materials such as soft tissue and air, whereas higher CT attenuations indicate tagged materials.
2.3 Adaptive density mapping (ADM) method
The purpose of using the ADM method is to minimize the effect of tagging agent on the CT attenuation for automated detection of polyps in ftCTC cases. This allows a uniform calculation of shape and texture features in tagged and untagged regions without any feature-specific adjustments. The method has two steps. In the first step, we identify the interface regions between air and tagged materials. In the second step, we convert the CT attenuations to minimize the effects of tagging. For convenient explanation, however, we will describe the second step of the ADM method before the first step.
We assume that the ftCTC data have been preprocessed by the ADC method described in the previous section. Thus, we can assume that CT attenuations ≤tT represent untagged regions (the establishment of tT and other parameters is described in Section 2.5). Because of the density variation of the observed CT attenuation due to local structural and CT noise and the tagging agent, we also assume that CT attenuations tT < vI < tU can represent both tagged and untagged regions, and that CT attenuations ≥tU represent only tagged regions. Thus, to minimize the effect of tagging agent, we can map the CT attenuations according to
| (4) |
The mapping does not affect voxels with CT attenuations ≤tT, because these can be assumed to be not affected by tagging after the application of the ADC. The voxels with CT attenuations ≥tU are assigned the CT attenuation of air (-1000 HU), because these voxels indicate clearly tagged residual materials that should be ignored. The voxels with CT attenuations between tT and tU are mapped linearly from tT to -1000 HU, because voxels with CT attenuations close to tT are more likely to represent soft-tissue regions, whereas voxels with CT attenuations close to tU are more likely to represent tagged regions.
Figure 2 shows an example of the effect of the ADM method on the calculation of the SI feature which is used for the detection of polyps in our CAD scheme (see Ref. [10] for details on the calculation of the SI). Figure 2a shows a polyp covered by tagged fluid. Figure 2b shows the coding between SI values (indicated by a vertical gray-scale bar) and five local surface shapes. For example, convex cap-like shapes are represented by a white color, whereas concave cup-like shapes are represented by a dark color. Figure 2c indicates how the SI values computed from the original CT data of Figure 2a are reversed under the tagging. For example, the convex soft-tissue shape of the polyp is indicated by dark colors that represent a concave shape in the SI coding. Figure 2d indicates how the SI values have been corrected after the application of the ADM method. The region of the polyp is now indicated in white color, which represents a convex shape in the SI coding.
Fig. 2.
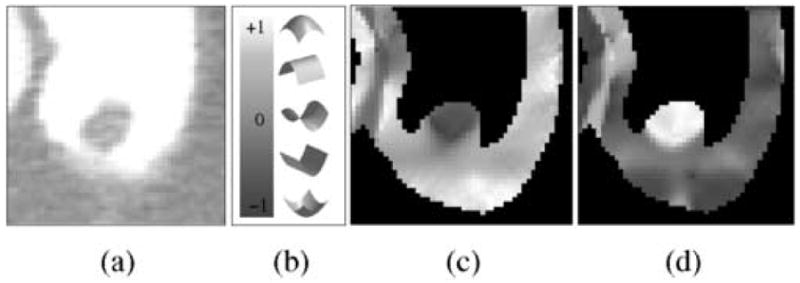
Example of the application of the ADM method in the correction of the measured shape of a 10-mm polyp covered by opacified fluid. (a) Axial view of the polyp with a -200±800 HU lung display window setting. (b) The vertical bar indicates the continuous mapping of five discrete local surface example shapes into shape index values. (c) Visualization of the values of the shape index within the extracted region of the colonic wall in (a). The shapes indicated by the shape index values are mostly opposite to the visually perceived soft-tissue shapes. (d) Visualization of the shape index values in the same region after the application of the ADM method. The indicated shapes now match the visually perceived shapes.
Straightforward application of Eq. (4) produces a ridge-like artifact at the interface between air and tagged regions (see Figure 3). Let A|T denote this interface. The interface A|T represents a transition between two materials (air and tagged materials), the CT attenuation ranges of which are not adjacent to each other on the Hounsfield scale. Therefore, because of the partial-volume effect and the limitations of CT image resolution, it is not obvious whether an observed region of A|T represents a direct transition between air and tagging, or whether A|T represents a transition between air, soft tissue, and tagging. Such a problem does not arise with the interface between air and soft tissue (A|S), or with the interface between soft tissue and tagging (S|T), because these represent a continuous transition between two materials whose CT attenuation ranges are adjacent on the Hounsfield scale. Because the interface A|T is typically composed of a variable mixture of air, tagged region, and soft-tissue structures such as polyps, folds, or poorly tagged residual materials, and because the interface is also affected by the PEH and partial-volume effects of the above materials, it is not obvious how to reconstruct precisely the actual CT attenuations at A|T. Furthermore, errors in such a reconstruction can easily produce polyp-like artifacts that increase the number of FP CAD detections.
Fig. 3.
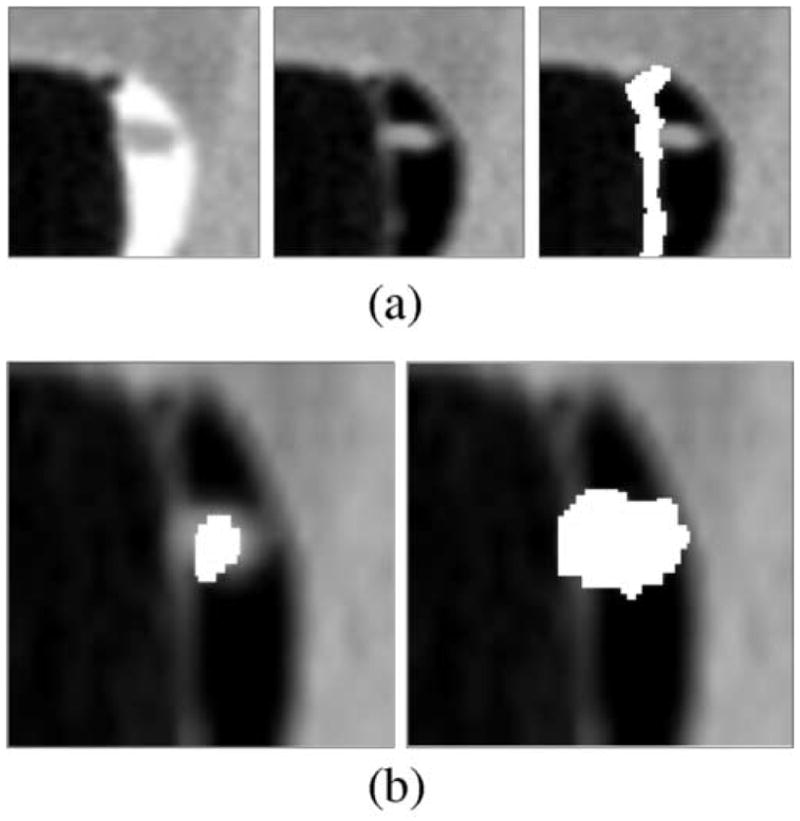
(a) Left: A 6-mm polyp located within the surface layer of tagged fluid (in the original CT data). Middle: Effect of the application of Eq. (4). Right: White region indicates the A|T interface identified by the application of the GIA method. (b) Left: White region indicates an initially detected region (in the CT data interpolated to isotropic resolution). Right: White region indicates the region of a polyp candidate extracted by conditional morphological dilation [18].
To avoid FPs from being introduced by the interface A|T during the detection of polyp candidates, we first identify A|T and then exclude the voxels within A|T from the detection. In particular, we do not modify A|T but keep the CT attenuations within A|T intact in order to avoid reconstruction artifacts and errors from being introduced in the calculation of volumetric shape features that are used for the detection [10,22]. However, after the step of the detection of the polyp candidates has been completed, we omit this constraint on the interface A|T. Thus, when the complete region of the polyp candidates is extracted by use of conditional morphological dilation [18], the extracted region is allowed to include voxels from A|T. Therefore, although any FP CAD detections that could originate from A|T will be excluded, the complete region of the detected polyp candidates will be extracted. The polyps that are of clinical interest are ≥6 mm, and they are large enough to remain detectable by CAD even if they are located at A|T.
To identify A|T, we first identify the regions of air (A), tagging (T), and soft tissue (S). Let denote the binary region obtained by thresholding I at a CT attenuation n:
| (5) |
Let denote the negation of : if , then . Let parameter tA denote the highest CT attenuation that represents air (tA = −700). Then, the region of air is represented by , the tagged region is represented by , and the soft-tissue region is represented by .
The interface regions are identified by use of a two-step gradient interface analysis (GIA) method. In the first step of the GIA, the CT attenuations of I are clipped according to v′(p) = min{vI(p), tT}. Let I′ denote the resulting clipped data, and let ∇I denote the gradient of the input data I. Then, the interfaces A|S and A|T can be determined by the calculation of , where t∇I′ is set to exceed the highest contrast of the CT attenuation within the interface S|T (see also Figure 6a). Therefore, S|T ∉ A|T ∪ A|S.
Fig. 6.
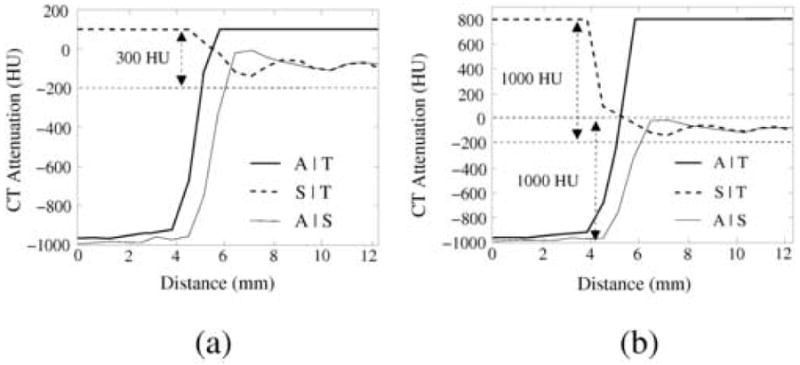
Line samples of three different interface types in the phantom data with 300 HU tagging during the (a) first and (b) second step of the GIA method. The data were preprocessed by the ADC method. Abbreviations: A|S = air and soft tissue; A|T = air and tagging; S|T = soft tissue and tagging. In (a), CT attenuations >100 HU have been clipped to 100 HU. The contrast between soft tissue and tagging is much lower than that between the other interfaces. In (b), CT attenuations >100 HU have been clipped to 800 HU. The contrast between air and soft tissue is much lower than that between air and tagging. Based on these data, the three interfaces may be differentiated as explained in the text.
In the second step of the GIA, we clip the CT attenuations of I according to
| (6) |
Let I″ denote the resulting data. The contrast between A and T in I″, and that between S and T, is now higher than the contrast between A and S (see also Figure 6b). Consequently, we can differentiate among the three interfaces as follows:
| (7) |
| (8) |
| (9) |
where t∇I″ is set to exceed the highest contrast of the CT attenuation within the interfaces A|S and S|T. Thus, we have obtained the region of the interface A|T which is then excluded from the detection of polyp candidates as explained earlier in this Section.
2.4 Colonic Lumen Tracking (CLT) method
To extract the region of colon from CTC data for the detection of polyps, the abdominal region is first extracted automatically by use of a series of thresholding, morphological, and region-growing operations [25,12]. The regions of soft tissue, tagging, and air are determined as described in Section 2.3. In particular, the colonic lumen is included in the region L = A∪T∪A|T, which may also include extra-colonic structures such as small bowel or stomach. To identify the precise region of the colonic lumen in L, a path is calculated automatically through the colonic lumen in L as described below. The calculated path is similar to a colon centerline, except that it does not need to be precisely centered in the lumen. The regions of the colonic lumen and colonic wall are then extracted automatically by use of region growing from the calculated path [12].
Let P = {Pi} (i = 1, .., n) denote a set of n paths for the n connected components of L, where the paths have been calculated automatically by use of a distance transform [26] on the region L. Three landmarks are established automatically by use of a rule-based method [19]: Lr (rectum), Ld (descending colon), and Lc (cecum). If there exists a path Prdc that connects Lr to Ld and Ld to Lc, in this order, then Prdc is considered as representing a complete colonic path, and any other paths in P are deleted.
If a single complete colonic path, Prdc, was not found, this indicates that the colonic lumen is collapsed at one or more regions. To reconnect the disconnected lumen paths automatically into a complete path over collapsed regions, we first determine the paths Pr, Pd and Pc which include Lr, Ld, and Lc, respectively. Suppose that Pr ≠ Pd (the case of Pc ≠ Pd is calculated similarly). Let Pre2 represent the endpoint of the rectal segment Pr which is closer to Ld, and let Pde1 represent the endpoint of the descending colon segment Pd which is closer to Lr. Let Pje1 (j = 1, .., m) represent the end-points of m candidate paths Pj ∉ {Pr, Pd, Pc} within Nc = 30 mm from Pre2, and let Pje2 (j = 1, .., m) represent the other endpoint of such paths Pj. If , where is the Euclidean distance between a and b, then Pre2 and Pde1 will be connected and Pr = Pd. Otherwise, the rectal segment Pr will be connected to a candidate path Pk which, for all k≠l, satisfies both of the following conditions:
| (10) |
and
| (11) |
If the new connected path does not include Pd, the above step is repeated by choosing Pke2 as the new endpoint Pre2 of the new Pr, and by searching for new suitable endpoints within Nc mm of the new Pre2.
If the above method fails to determine a single connected path which would connect the landmarks Lr, Ld, and Lc, in this order, then the set of all calculated paths in L, i.e., P, is used as the final lumen path. This ensures that all colonic regions will be examined during the polyp detection step.
If a single connected path Prdc was established, the location of the ileocecal valve (Licv) will be checked automatically to prevent the path from entering the small bowel through an open valve. Let D(Lc) denote the value of distance transform (which is used to characterize lumen distension) at the location of the cecum landmark Lc. In most cases, D(Lc) ≫ D(Licv). First, Prdc is tracked from Lc to a point p0 where . This indicates that the lumen is narrowing. Next, we continue tracking the path from p0 while comparing the distension between two successive points D(pi) and D(pi+1). If D(pi+1) > D(pi), then the lumen is expected to be widening at pi+1 because of entering the small bowel. Therefore, the colon path is terminated at pi = Licv.
The region-growing step for extracting the colonic lumen from the calculated path is performed in two steps to minimize any potential leakage into the small bowel or stomach. First, the lumen path Prdc is used as a seed for a fast-marching region-growing method [27], where the growing region is not allowed to expand closer than d mm to the colonic wall. This constraint on the grown region prevents leakage from the lumen path to structures outside the colon. Next, the region-growing continues not only from the colon path Prdc, but also from extra-colonic paths {P \ Prdc}. Whereas the former grown region will represent the colonic lumen, the latter grown region is simply used for preventing the former region from leaking into the small bowel or stomach, and it will be excluded from the final extracted region.
Figure 4 illustrates key steps of the CLT method. Figure 4a shows the stacking of the input CT images into a volume, and Figure 4b shows the labeling of the abdominal voxels. In Figure 4c, top figure shows a cut-plane view of a colon segment with air and tagged fluid. Middle figure shows the labeling of the segment: soft tissue is indicated by dark gray color, tagged fluid is indicated by white color, air is labeled by gray color, and the interface between the air and tagged fluid is indicated by light gray color. Bottom figure demonstrates how the binary conversion of the labels of air, tagged fluid, and their separating interface facilitates uniform tracking of the lumen. In figure 4d, top figure shows an endoscopic view of a tracked lumen path entering and exiting tagged fluid, and bottom figure shows a cut-plane view of the same region, where the tracked path has been projected onto the image. Figure 4e shows all tracked abdominal lumen paths. Figure 4f shows the initially established landmarks (1 = cecum (ascending colon), 2 = descending colon, 3 = rectum) and the primary colon segments tracked from these landmarks. Because the sigmoid colon is poorly distended and partially collapsed, there is no pathway from the rectal segment to the descending colon segment. Figure 4g demonstrates the first step of the reconstruction of a complete lumen path. The large white sphere indicates endpoint of the rectal segment, and the large grey sphere indicates endpoint of the descending segment. The rectal endpoint can be connected to four nearby endpoints, labeled 1 – 4 in the image, of which endpoint 4 will be chosen by the application of Eqs. (10) and (11). Figure 4h shows how the tracking continues with the new rectal segment. In top figure, a short isolated colonic segment provides both candidate points for the next connection of the rectal segment. In the bottom figure, the endpoints of the rectal and descending segment are now close enough to be connected directly. In Figure 4i, the final path is shown with adjusted landmark locations. In particular, the location of the landmark at cecum has been adjusted as explained earlier in this Section. Figure 4j shows the result of the region-growing steps. The extracted lumen can now be differentiated precisely from extra-colonic regions. Figure 4k demonstrates the result of shape-based interpolation, where the CT volume has been interpolated into isotropic resolution to minimize geometric distortions in polyp detection [12].
Fig. 4.
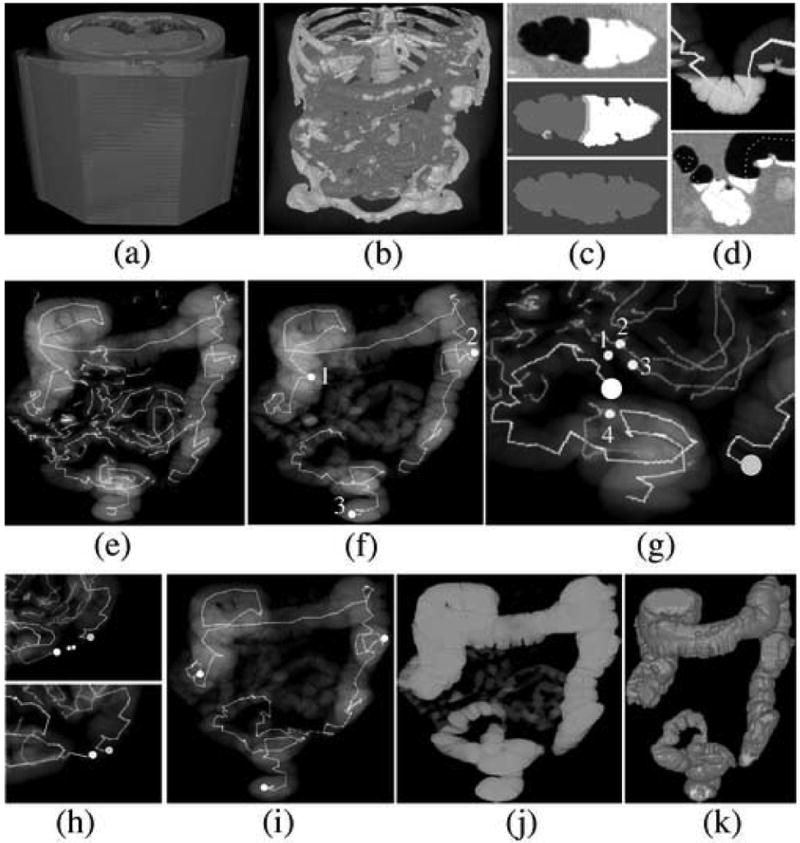
Illustration of the CLT method; see text for additional explanation. (a) Input CT images are stacked into a volume. (b) Labeling of the voxels. (c) Cut-plane views of the conversion of the CT volume into binary volume. (d) Visualization of a piece of tracked path entering and exiting tagged fluid within the colonic lumen. (e) All tracked abdominal lumen paths. (f) Three initially established landmarks and the tracking of their corresponding primary segments. (g) Lumen tracking in sigmoid colon. The endpoint of the rectal segment that is indicated by large white sphere can be connected to one of the four indicated candidate connections. (h) Further lumen tracking in sigmoid colon. (i) Completed lumen path with adjusted landmark locations. (j) Result of the region-growing steps. (k) Result of the final shape-based interpolation step.
2.5 Parameter estimation
For parameter optimization, an anthropomorphic human-colon phantom (Phantom Laboratory, Salem, NY, USA) was filled partially with three different concentrations of an iodine-based tagging agent (Oxilan, Guerbet, Bloomington, IN, USA). The materials of the phantom had been designed to resemble features observed in human CTC scans [28]. In particular, the CT attenuations of soft-tissue structures were <100 HU. The phantom was scanned by use of a four-channel CT scanner (LightSpeed, GE Medical Systems, Milwaukee, WI, USA) with CT parameters similar to those used routinely with clinical cases at our institution: 3.75 mm collimation, a 1.8 mm reconstruction interval, and a 50 mA current with 140 kVp voltage. The three resulting CT scans represented the phantom with uniform taggings of retained fluid at 300 HU, 600 HU, and 900 HU.
The ADC method was optimized to reduce the maximum CT attenuation within pseudo-enhanced soft-tissue regions to <100 HU simultaneously in all three phantom scans. The optimization of the ADC method has been described in detail in Ref. [23]. In particular, the optimization involves the estimation of the parameter function σ2 of Eq. (2). The resulting function generates a large correction (Gaussian spread) for high levels of residual energy, and a small correction for low levels of residual energy. Thus, when the ADC method is applied to a CT scan volume that has variable tagging density levels in different regions of the colon, the pseudo-enhancement is corrected adaptively at each local region.
The ADM method has two key parameters: tT and tU (see Eq. (4)). For compatibility with the ADC method, we set tT = 100 HU. This value is also in agreement with the range of the Hounsfield scale for soft-tissue structures. To determine a suitable value for tU, we observed that previous experimental clinical studies had indicated tagged regions by use of CT attenuation thresholds from 150 HU [29] to 200 HU [28]. To investigate the effect of tagging density in our CAD scheme, we preprocessed the phantom ftCTC data with the optimized ADC method and calculated line samples through 11 simulated polyps 8 – 18 mm that were fully covered by tagged fluid.
Figure 5 shows examples of the line-sample plots through simulated polyps. The solid lines indicate samples at the 300 HU tagging level, and the dotted lines indicate samples at the 600 HU tagging level. As can be seen from the plots, the CT attenuation within the polyps is mostly <100 HU after application of the ADC. The plots also indicate that CT attenuations >200 HU are generally associated with tagging, whereas CT attenuations within 100 – 200 HU represent a transition between soft tissue and tagged materials. Therefore, we set tU = 200 HU.
Fig. 5.
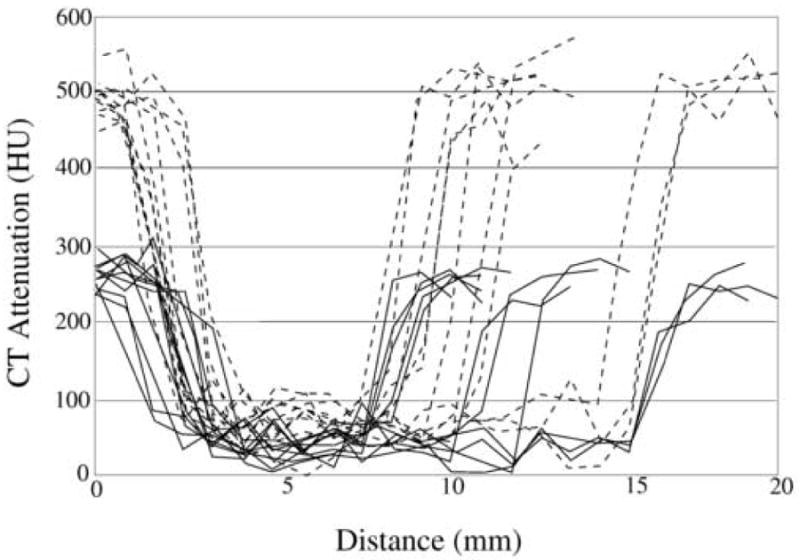
Examples of line samples of 11 polyps that were covered by low-density (300 HU; solid lines) and moderate-density (600 HU; dotted lines) tagging. The line samples were calculated after the application of the ADC method.
The parameter values of the GIA method were estimated similarly as above by use of the phantom data and the Hounsfield scale. We estimated the threshold t∇I′ = 300 for differentiating the interface S|T from the interfaces A|S and A|T by studying the line samples of these interface regions in the phantom (Figure 6a). Because the CT attenuations >100 HU were clipped to 100 HU, the gradient of the CT attenuation is <300 HU at S|T. The threshold t∇I″ = t∇I′ + 700 for differentiating between A|T and A|S was estimated similarly (Figure 6b): because the CT attenuations >100 HU were clipped to 800 HU, the interface A|T has a higher gradient than does interface A|S. Conservative threshold values were chosen to accommodate the limited image resolution and the structural and CT imaging noise of clinical cases.
The detection parameter values of the nCAD scheme were those that we have established previously [10,22,18]. The same parameter values were used with the ftCAD scheme, where applicable.
2.6 Evaluation of CAD performance
We evaluated the detection performance of a total of three CAD schemes: the nCAD scheme, the ftCAD scheme, and an ftCADb scheme. The ftCADb scheme was identical to the ftCAD scheme, except that the GIA method was not used for excluding detected polyp candidates. For each scheme, we used five polyp candidate features as input to the BNN: size, variance of CT attenuation, and the mean values of the SI, gradient concentration, and directional gradient concentration features [22,18], that are calculated from the automatically extracted polyp candidate regions [18]. These features have previously demonstrated a high differentiation performance between polyps and typical sources of FP detections in the nCAD scheme [22,16].
We used two different types of databases to evaluate the performance of the CAD schemes (Fig. 7). The first database (DB-I) included 32 ftCTC cases with full cathartic cleansing of the colon. The patients were prepared with oral administration of 90 mL sodium phosphate and 10 mg bisacodyl. Fecal tagging was performed with 500 mL barium and 120 mL diatrizoate meglumine and diatrizoate sodium [3]. The patients were scanned with two types of multi-channel CT scanners (GE LightSpeed and GE LightSpeed Ultra; GE Medical Systems, Milwaukee, WI, USA) with 1.25 – 2.5 mm collimation, a 1 mm reconstruction interval, and a 100 mA current with 120 kVp voltage. There were 40 polyps ≥6 mm: 24 polyps were 6 – 9 mm, and 16 polyps were ≥10 mm (including two 50-mm masses).
Fig. 7.
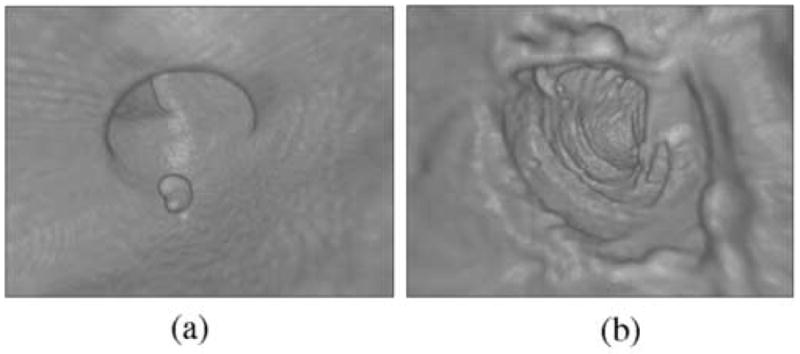
(a) In database I, the full cathartic preparation eliminated most residual materials. The remaining residual materials were clearly tagged because of the large dose of high-density tagging agent. This simplifies the detection of abnormalities such as the 12-mm polyp seen at the center of the image. (b) In database II, the reduced cathartic preparation could leave residual materials that imitate polyps in the colon. If tagged, these materials could be identified confidently. However, because of the experimental nature of the data, some of the cases included poorly tagged or untagged fecal materials that could be confused with true abnormalities.
The second database (DB-II) included 32 ftCTC cases with reduced cathartic cleansing of the colon. The patients were prepared with a low-residue diet and reduced colon cleansing by oral administration of 16.5 g magnesium citrate and a ducolax suppository (LoSo Prep, E-Z-EM, Lake Success, NY, USA). Fecal tagging was performed with 60 – 80 mL of Tagitol V (E-Z-EM). The patients were scanned with six types of multi-channel CT scanners (Light-Speed16, LightSpeed Ultra, Discovery ST; GE Medical Systems, Milwaukee, WI, USA; Volume Zoom, Sensation 64; Siemens Medical Solutions, Malvern, PA, USA; Brilliance 16P, Philips Medical Systems, Andover, MA, USA) with 0.6 – 3.0 mm collimation, a 0.3 – 1.5 mm reconstruction interval, and a 29 – 140 mA current with 120 kVp voltage. There were 44 polyps ≥6 mm: 23 polyps were 6 – 9 mm, and 21 polyps were ≥10 mm (including three 50 – 70-mm carcinomas).
To assess the detection performance, we recorded the location and size of each colonoscopy-confirmed polyp ≥6 mm in the CTC data. A CAD polyp candidate was considered a true-positive (TP) detection if the distance between the centers of the polyp candidate and a known polyp was within the specified size of the polyp. All other polyp candidates were considered as FP detections.
Because of the relatively small number of cases, we evaluated the performance of the CAD schemes by use of leave-one-patient-out (LOPO) evaluation. In a LOPO evaluation with n patients, a CAD scheme is trained at each iteration with n − 1 patients, and tested with the nth patient. Each patient is tested once in this manner. In our study, the training and testing of the CAD scheme involved the training and testing of the BNN for the reduction of FP polyp candidates based on polyp candidate features.
The by-polyp detection performance of the CAD schemes was characterized by use of free-response receiver operating characteristic (FROC) curves [30,31]. The FROC curves display the by-polyp detection sensitivity of a CAD scheme as a function of the average number of FP detections per scan. The average number of FP detections per scan was calculated by dividing the number of all FP detections from all scans by the number of all scans in the databases. Because an effective CAD scheme should display only a small number of FP detections, we analyzed the results only within the range of an average number of 0 – 5 FP detections per scan.
3 Results
Figures 8 and 9 represent the LOPO performance of the ftCAD and nCAD schemes in the detection of polyps ≥6 mm from databases DB-I and DB-II, respectively. The dotted line indicates the performance of the nCAD scheme, and the thick and thin solid lines indicate the performances of the ftCAD and ftCADb schemes, respectively. As shown in the Figures, the ftCAD and ftCADb schemes demonstrated a performance superior to that of the nCAD scheme in both databases DB-I and DB-II. The use of the GIA method in the ftCAD scheme provided marginal improvement of the detection result over that of the ftCADb scheme.
Fig. 8.
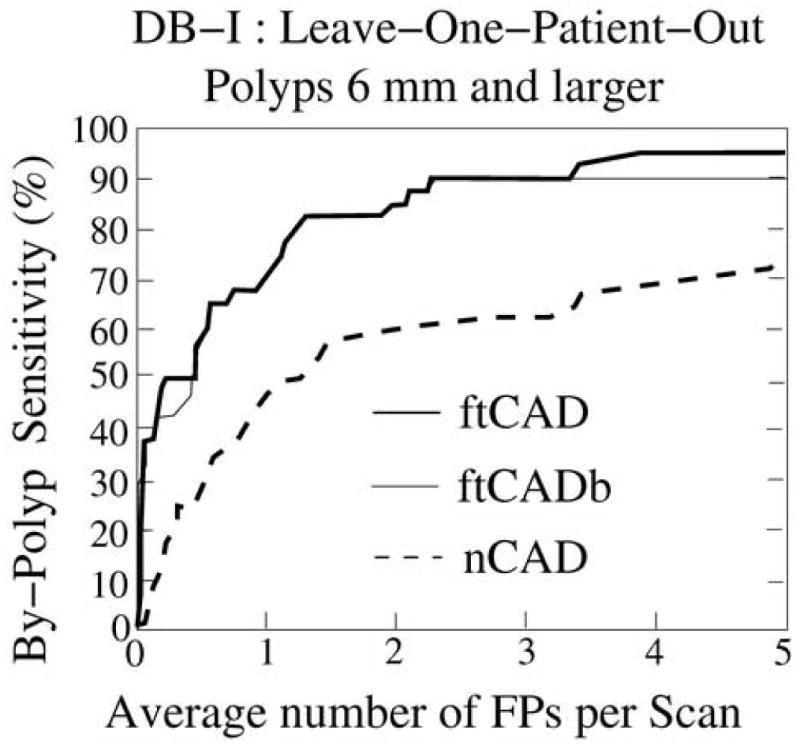
Leave-one-patient-out detection performance on database DB-I for the 40 polyps ≥6 mm. The thick and thin solid lines indicate the performance of the ftCAD and ftCADb schemes, respectively, and the dotted line indicates the performance of the nCAD scheme.
Fig. 9.
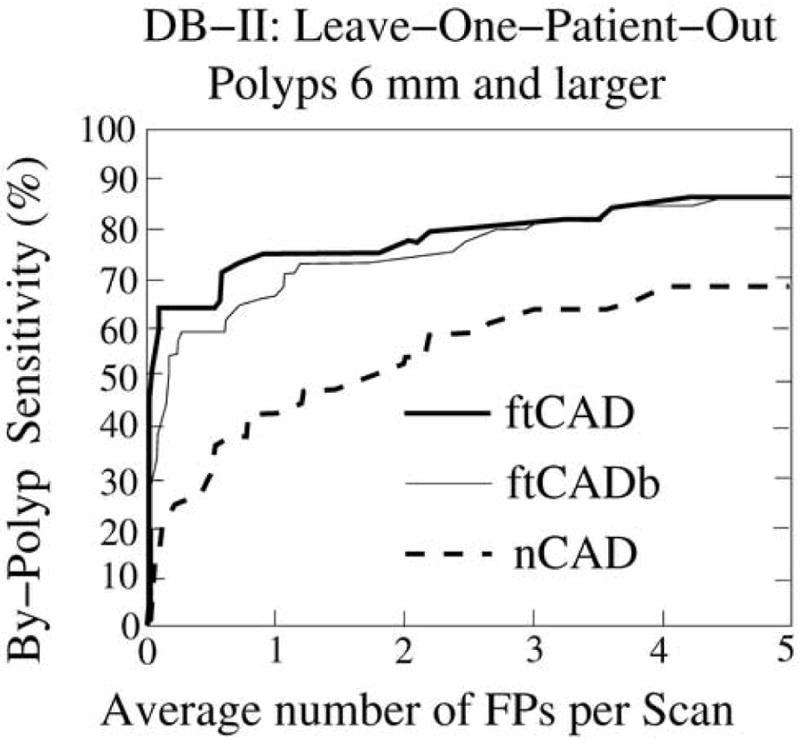
Leave-one-patient-out detection performance on database DB-II for the 44 polyps ≥6 mm. The thick and thin solid lines indicate the performance of the ftCAD and ftCADb schemes, respectively, and the dotted line indicates the performance of the nCAD scheme.
In database DB-I, the ftCAD scheme detected 95% of the polyps ≥6 mm with 3.6 FPs per scan on average. At a comparable FP rate of 4.1 FPs per scan, the nCAD scheme detected 70% of such polyps. In database DB-II, the ftCAD scheme detected 86% of the polyps ≥6 mm with 4.2 FPs per scan on average, whereas the nCAD scheme detected 66% of the polyps at 4.7 FPs per scan.
Polyps that are ≥10 mm are generally considered to be clinically significant and to require immediate removal. Thus, the detection of such polyps is of particular importance. The ftCAD scheme detected 15/16 (94%) and 21/21 (100%) of the polyps ≥10 mm in databases DB-I and DB-II, respectively. The polyp that was missed measured 1 cm in colonoscopy and had a benign hyperplastic pathology. This polyp could be detected by the ftCAD scheme by allowing the average number of FPs to increase to 7.5 FPs per scan. All five large masses ≥50 mm (two in DB-I and three in DB-II) were detected by both CAD schemes.
Figure 10 shows examples of the TP and FP detections in the nCAD and ftCAD schemes. The nCAD scheme missed most polyps that were covered by tagged materials, such as that shown in Figure 10a. On the other hand, it could detect polyp-shaped fecal material incorrectly as polyps even if these were clearly tagged, such as that shown by the arrow in Figure 10b. In contrast, the ftCAD scheme that analyzed both air-filled and tagged regions detected the lesion in Figure 10a correctly, and it also identified the fecal material shown in Figure 10b correctly as an FP. However, both CAD schemes detected the untagged stool indicated by the arrow in Figure 10c incorrectly as a polyp.
Fig. 10.
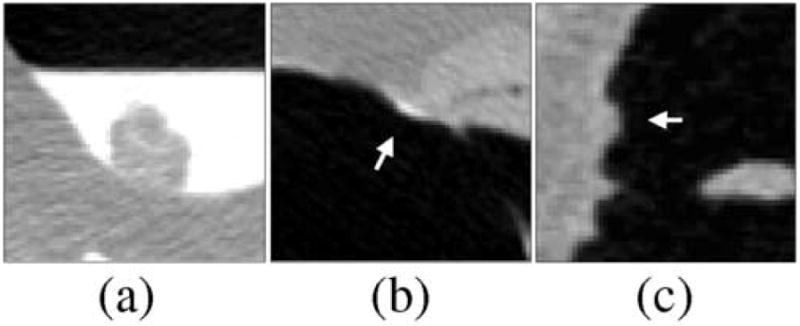
Comparison of typical FP and false-negative detections of the nCAD and ftCAD schemes. (a) The nCAD scheme missed this polyp covered by tagged fluid, whereas the ftCAD scheme detected the polyp correctly. (b) The nCAD scheme detected this stool (indicated by arrow) incorrectly as a flat lesion based upon its shape. The ftCAD scheme identified the lesion correctly as an FP based on the fecal tagging. (c) An example of untagged stool (indicated by arrow) that was detected incorrectly as a polyp by both CAD schemes.
Figure 11 shows examples of FP ftCAD detections in DB-I. Figure 11a shows thickening of fold. Because the surrounding structures of the fold are substantially thinner, such fold patterns can imitate a polypoid shape and density. In cathartically cleansed colons, folds are the single largest source of FP CAD detections. Figure 11b shows an ileocecal valve with a polypoid pattern that was not seen by unblinded optical colonoscopy. Such patterns represent <10% of FP CAD detections. Figure 11c shows untagged residual material in ascending colon. Such lesions are atypical to cathartically cleansed fecal-tagging CTC cases.
Fig. 11.
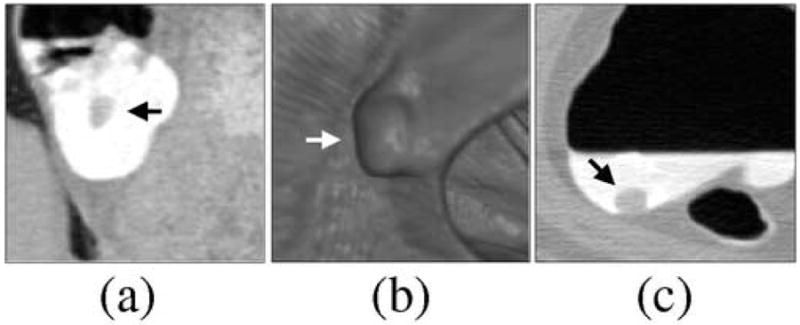
Examples of FP ftCAD detections in DB-I. (a) Thickened fold (indicated by arrow). Folds are the single major source of FP detections in cathartically cleansed cases. (b) Polypoid pattern (indicated by arrow) on an ileocecal valve. Up to 10% of CAD detections tend to be generated by ileocecal valves. (c) An example of untagged residual material detected by CAD. Such lesions are not common in cathartically cleansed fecal-tagging cases.
Figure 12 shows examples of FP ftCAD detections in DB-II. Figure 12a shows a small fold imitating a polyp. In lung display window setting (top figure), the lesion is hardly visible, whereas it can be seen clearly with the soft-tissue display window setting (bottom figure). As in the case of cathartically cleansed cases, folds are a major source of FP CAD detections in reduced cathartic preparations. Figure 12b shows an example of poorly tagged feces. Endoscopic visualization (top figure) demonstrates the polypoid shape of the lesion, but a cut-plane view (bottom figure) indicates a small air bubble at the center of the lesion, thereby confirming that the lesion is likely to be untagged stool. Poorly tagged feces are a second major source of FP CAD detections in non-cathartic preparations. Figure 12c shows an ileocecal valve with a mass-like appearance. The arrow indicates a polypoid pattern on the valve in endoscopic view (top figure) and cut-plane view (bottom figure). As in the case of cathartically cleansed cases, up to 10% of FP CAD detections are typically generated by ileocecal valves in non-cathartic cases.
Fig. 12.
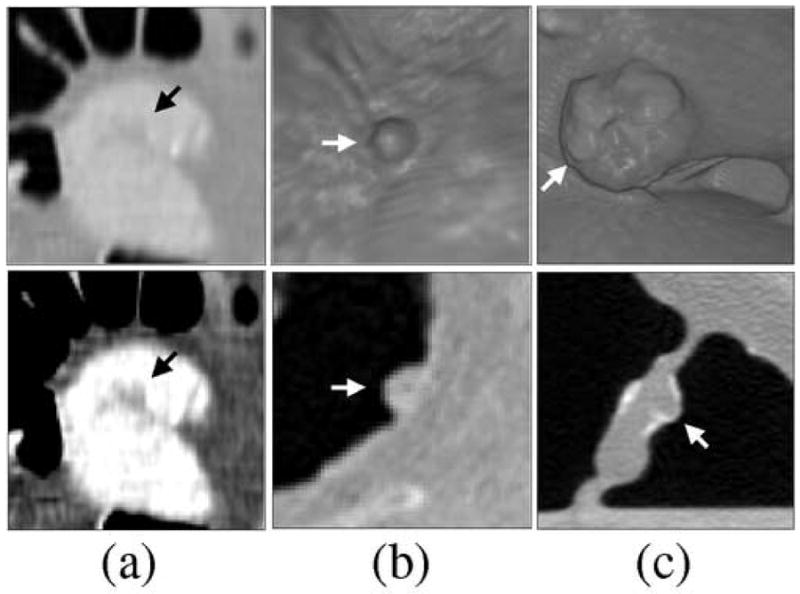
Examples of FP ftCAD detections in DB-II. (a) Small fold imitating a polyp (indicated by arrow). Top figure shows the lesion in lung display window, and bottom figure shows the lesion in soft-tissue display window setting. (b) Poorly tagged feces with polypoid appearance (indicated by arrow). Folds and poorly tagged feces are the two major sources of FP detections in reduced and non-cathartic colon preparations. (c) Ileocecal valve with a mass-like appearance. The arrow indicates a polypoid pattern that was detected by CAD.
4 Discussion
The fully automated ftCAD scheme that we developed in this study yielded a high by-polyp detection performance that was superior to that of a conventional nCAD scheme. The ftCAD scheme minimizes the PEH by high-density tagging agents by the application of an adaptive correction of CT attenuation values. The effects of tagging on shape and texture features are minimized by use of an adaptive mapping of the CT attenuations. The ftCAD scheme also includes a colon extraction method that facilitates the detection of polyps in both air-filled and tagged regions of the colon. Such components have traditionally been missing from conventional CAD schemes.
The methods developed in this study do not make any particular assumptions on the input CTC data. The input data may or may not include fecal tagging, and the tagged materials may appear in liquid, semi-liquid, and/or solid forms. Furthermore, the tagging agent does not need to be homogeneously distributed as long as the observed density of the tagged materials is >100–150 HU. In this study, we demonstrated the generalizability of our methods by evaluating the CAD scheme with two different types of clinical databases.
Although the cathartic cleansing of database DB-I may provide nearly optimal conditions for analysis of the colon, we hypothesize that CAD may be even more useful for radiologists in the kind of reduced cathartic colon regimens such as that of database DB-II. This is because reduced cathartic or non-cathartic preparations tend to result in a large spectrum of residual materials with heterogeneous tagging. The interpretation of such cases may be time-consuming, error-prone, and tedious, and it may require specialized visualization tools. Under such conditions, CAD could be invaluable in rapidly pointing out the most suspicious regions to the radiologist. However, as indicated by the lower performance of both CAD schemes in database II as compared to database I, reduced colon preparation schemes may need careful optimization to yield the best results.
In clinical cases, the observed CT attenuation of poorly or conservatively tagged regions can be less than the lowest 300 HU tagging density used in our phantom study. In such regions, tagged voxels may be indicated by CT attenuations <200 HU. In Callstrom et al. [29], a relatively low threshold of 150 HU was used to visualize tagged materials. The use of such a low threshold is feasible for indicating conservatively tagged materials, whereas higher thresholds may be required with large doses of a high-density tagging agent to compensate for the effects of the PEH. In our ftCAD scheme, the mapping of Eq. (4) converts the PEH-corrected CT attenuation of 150 HU to -450 HU, which is at the lower end of soft-tissue structure details that can be perceived in CTC. This mapping appears reasonable, because CT attenuations 100 – 150 HU that tend to be indistinguishable from soft-tissue structures are then converted to the CT attenuation range of soft tissue, whereas CT attenuations >150 HU that tend to be associated with tagged materials are mapped to the CT attenuation range of air.
The use of the GIA method provided only a marginal improvement in the detection performance of the ftCAD scheme. The GIA is expected to reduce FPs most effectively in cases where small pieces of untagged fecal material are floating at the surface of tagged fluid. However, the databases used in this study had few such cases. Practically all of the fecal materials and fluid were tagged clearly in database DB-I, and database DB-II had only small amounts of residual fluid. We expect that the application of the GIA method will be more effective in non-cathartic colon regimens [32]. Nevertheless, the GIA method appears to be a useful adjunct for the maximization of the polyp detection performance.
Although the number of cases used in our evaluation was relatively small, each case included one or more polyps, and the evaluation bias was minimized by use of the well-known LOPO method with few polyp features for FP reduction. The LOPO method allows the use of almost all available data in the evaluation while separating the training and testing data without sacrificing the statistical significance of the results [33]. Furthermore, unlike in most other studies, the ADC and ADM parameters were optimized by use of an anthropomorphic phantom independently from the clinical evaluation data. Similarly, the colon extraction and polyp detection parameters had been assigned previously based on a clinical database that was independent from the clinical evaluation data used in this study. Therefore, we expect that the optimization of the CAD scheme with a clinical training database and a larger number of polyp features will improve the CAD performance substantially in our future clinical large-scale trials.
5 Conclusion
We developed a fully automated CAD scheme for the detection of polyps in ftCTC cases. The parameter optimization was performed by use of an anthropomorphic colon phantom and by use of clinical databases that were independent from the clinical evaluation data used in this study. The CAD scheme was evaluated by use of two different types of clinical ftCTC databases with a leave-one-patient-out evaluation. The scheme yielded a high by-polyp detection performance with a low FP rate in both databases. The performance was shown to be superior to that of a conventional CAD scheme in ftCTC.
Acknowledgments
This study was supported by a grant no. CA095279 from the U.S. Public Health Service.
We thank Dr. Michael Zalis (Massachusetts General Hospital, Boston, MA, USA) for providing the phantom data for the study. We also thank Dr. Richard Choi (Virtual Colonoscopy Center, Walter Reed Army Medical Center, Washington DC, USA) and Dr. Philippe Lefere (Stedelijk Ziekenhuis, Roeselare, Belgium) for providing the CTC cases for this study. Finally, we thank the CT colonography research group of the Massachusetts General Hospital for useful discussions.
Footnotes
Publisher's Disclaimer: This is a PDF file of an unedited manuscript that has been accepted for publication. As a service to our customers we are providing this early version of the manuscript. The manuscript will undergo copyediting, typesetting, and review of the resulting proof before it is published in its final citable form. Please note that during the production process errors may be discovered which could affect the content, and all legal disclaimers that apply to the journal pertain.
References
- 1.Jemal A, Siegel R, Ward E, Murray T, Xu J, et al. Cancer statistics, 2006. CA Cancer J Clin. 2006;56:106–130. doi: 10.3322/canjclin.56.2.106. [DOI] [PubMed] [Google Scholar]
- 2.Glick S. Background and significance. In: Dachman A, editor. Atlas of Virtual Colonoscopy. Springer-Verlag; New York, USA: 2003. pp. 5–9. [Google Scholar]
- 3.Pickhardt P, Choi J, Hwang I, Butler J, Puckett M, Hildebrandt H, Wong R, Nugent P, Mysliwiec P, Schindler W. Computed tomographic virtual colonoscopy to screen for colorectal neoplasia in asymptomatic adults. N Engl J Med. 2003;349:2191–2200. doi: 10.1056/NEJMoa031618. [DOI] [PubMed] [Google Scholar]
- 4.Gluecker T, Johnson C, Harmsen W, Offord K, Harris A, et al. Colorectal cancer screening with CT colonography, colonoscopy, and double-contrast barium enema examination: prospective assessment of patient perceptions and preferences. Radiology. 2003;227:378–384. doi: 10.1148/radiol.2272020293. [DOI] [PubMed] [Google Scholar]
- 5.Lefere P, Gryspeerdt S, Dewyspelaere J, Baekelandt M, Van Holsbeeck B. Dietary fecal tagging as a cleansing method before CT colonography: initial results - polyp detection and patient acceptance. Radiology. 2002;24:393–403. doi: 10.1148/radiol.2241011222. [DOI] [PubMed] [Google Scholar]
- 6.Zalis M, Perumpillichira J, Del Frate C, Hahn P. CT colonography: digital subtraction bowel cleansing with mucosal reconstruction - initial observations. Radiology. 2003;226:911–917. doi: 10.1148/radiol.2263012059. [DOI] [PubMed] [Google Scholar]
- 7.Iannaccone R, Laghi A, Magniapane F, Lamazza A, Schillaci A, et al. Computed tomographic colonography without cathartic preparation for the detection of colorectal polyps. Gastroenterology. 2004;127:1300–1311. doi: 10.1053/j.gastro.2004.08.025. [DOI] [PubMed] [Google Scholar]
- 8.Lefere P, Gryspeerdt S. Virtual colonoscopy: a practical guide. Springer; 2006. [DOI] [PubMed] [Google Scholar]
- 9.Yoshida H. The future: computer-aided detection. In: Lefere P, Gryspeerdt S, editors. Virtual colonoscopy: a practical guide. Springer; 2006. pp. 137–152. [Google Scholar]
- 10.Yoshida H, Näppi J. Three-dimensional computer-aided diagnosis scheme for detection of colonic polyps. IEEE Trans Med Imaging. 2001;20:1261–1274. doi: 10.1109/42.974921. [DOI] [PubMed] [Google Scholar]
- 11.Yoshida H, Dachman A. CAD techniques, challenges and controversies in computed tomographic colonography. Abdom Imaging. 2004;30:26–41. doi: 10.1007/s00261-004-0244-x. [DOI] [PubMed] [Google Scholar]
- 12.Frimmel H, Näppi J, Yoshida H. Centerline-based colon segmentation for CT colonography. Med Phys. 2005;32:2665–2672. doi: 10.1118/1.1990288. [DOI] [PubMed] [Google Scholar]
- 13.Summers R, Franaszek M, Miller M, Pickhardt P, Choi J, et al. Computer-aided detection of polyps on oral contrast-enhanced CT colonography. Am J Roentgenol. 2005;184:105–108. doi: 10.2214/ajr.184.1.01840105. [DOI] [PubMed] [Google Scholar]
- 14.Summers R, Yao J, Pickhardt P, Franaszek M, Bitter I, et al. Computed tomographic virtual colonoscopy computer-aided polyp detection in a screening population. Gastroenterology. 2005;2005:1832–1844. doi: 10.1053/j.gastro.2005.08.054. [DOI] [PMC free article] [PubMed] [Google Scholar]
- 15.Zalis M, Yoshida H, Näppi J, Magee C, Hahn P. Evaluation of false positive detections in combined computer aided polyp detection and minimal preparation/digital subtraction CT colonography (CTC). Proc RSNA; Chicago, USA. 2004. p. 578. [Google Scholar]
- 16.Näppi J, Frimmel H, Dachman A, Yoshida H. A new high-performance CAD scheme for the detection of polyps in CT colonography. Fitzpatrick J, Sonka M, editors. SPIE Medical Imaging 2004. 2004;5370:839–848. [Google Scholar]
- 17.Yoshida H, Näppi J, MacEneaney P, Rubin D, Dachman A. Computer-aided diagnosis scheme for detection of polyps at CT colonography. Radiographics. 2002;22:963–979. doi: 10.1148/radiographics.22.4.g02jl16963. [DOI] [PubMed] [Google Scholar]
- 18.Näppi J, Yoshida H. Feature-guided analysis for reduction of false positives in CADof polyps for CT colonography. Med Phys. 2003;30:1592–1601. doi: 10.1118/1.1576393. [DOI] [PubMed] [Google Scholar]
- 19.Näppi J, Okamura A, Frimmel H, Dachman A, Yoshida H. Region-based supine-prone correspondence for the reduction of false-positive CAD polyp candidates in CT colonography. Acad Radiol. 2005;12:695–707. doi: 10.1016/j.acra.2004.12.026. [DOI] [PubMed] [Google Scholar]
- 20.Lefere P, Gryspeerdt S, Marrannes J, Baekelandt M, Van Holsbeeck B. CT colonography after fecal tagging with reduced cathartic cleansing and a reduced volume of barium. Am J Roentgenol. 2005;184:1836–1842. doi: 10.2214/ajr.184.6.01841836. [DOI] [PubMed] [Google Scholar]
- 21.Kupinski M, Edwards D, Giger M, Metz C. Ideal observer approximation using Bayesian classification neural networks. IEEE Trans Med Imaging. 2001;20:886–899. doi: 10.1109/42.952727. [DOI] [PubMed] [Google Scholar]
- 22.Näppi J, Yoshida H. Automated detection of polyps in CT colonography: evaluation of volumetric features for reduction of false positives. Acad Radiol. 2002;9:386–397. doi: 10.1016/s1076-6332(03)80184-8. [DOI] [PubMed] [Google Scholar]
- 23.Näppi J, Yoshida H. Adaptive correction of CT attenuation for computer-aided detection of polyps in fecal-tagging CT colonography. 2006 submitted. [Google Scholar]
- 24.Näppi J, Yoshida H. Adaptive normalization of fecal-tagging CT colonography images for computer-aided detection of polyps. Int J Comp Assisted Radiol Surg. 2006;1(S1):371–372. [Google Scholar]
- 25.Näppi J, MacEneaney P, Dachman A, Yoshida H. Knowledge-guided automated segmentation of colon for computer-aided detection of polyps in CT colonography. J Comput Assist Tomogr. 2002;26:493–504. doi: 10.1097/00004728-200207000-00003. [DOI] [PubMed] [Google Scholar]
- 26.Frimmel H, Näppi J, Yoshida H. Fast and robust computation of colon centerline in CT colonography. Med Phys. 2004;31:3046–3056. doi: 10.1118/1.1790111. [DOI] [PubMed] [Google Scholar]
- 27.Sethian J. Level Set Methods and Fast Marching Methods. Cambridge University Press; USA: 1999. [Google Scholar]
- 28.Zalis M, Perumpillichira J, Kim J, Del Frate C, Magee C, Hahn P. Polyp size at CT colonography after electronic subtraction cleansing in an anthropomorphic colon phantom. Radiology. 2005;236:118–124. doi: 10.1148/radiol.2361040231. [DOI] [PubMed] [Google Scholar]
- 29.Callstrom M, Johnson C, Fletcher J, Reed J, Ahlquist D, et al. CT colonography without cathartic preparation: feasibility study. Radiology. 2001;219:693–698. doi: 10.1148/radiology.219.3.r01jn22693. [DOI] [PubMed] [Google Scholar]
- 30.Bunch P, Hamilton J, Sanderson G, Simmons A. A free-response approach to the measurement and characterization of radiographic-observer performance. J Appl Photogr Eng. 1978;4:166–171. [Google Scholar]
- 31.Metz C. Evaluation of CAD methods. In: Doi K, editor. Computer-Aided Diagnosis in Medical Imaging. Elsevier Science; 1999. pp. 543–554. [Google Scholar]
- 32.Näppi J, Zalis M, Cai W, Yoshida H. CAD in minimal-preparation CT colonography: technical feasibility. Proc RSNA; Chicago, USA. 2005. p. 440. [Google Scholar]
- 33.Tourassi G, Floyd C. The effect of data sampling on the performance evaluation of artificial neural networks in medical diagnosis. Med Decis Making. 1997;17:186–192. doi: 10.1177/0272989X9701700209. [DOI] [PubMed] [Google Scholar]


