

Abstract
A theoretical analysis is presented with experimental confirmation to conclusively demonstrate the critical role that annealing plays in efficient PCR amplification of GC-rich templates. The analysis is focused on the annealing of primers at alternative binding sites (competitive annealing) and the main result is a quantitative expression of the efficiency (η) of annealing as a function of temperature (TA), annealing period tA) and template composition. The optimal efficiency lies in a narrow region of TA and tA for GC-rich templates and a much broader region for normal GC templates. To confirm the theoretical findings, the following genes have been PCR amplified from human cDNA template: ARX, and HBB (with 78.72% and 52.99% GC respectively). Theoretical results are in excellent agreement with the experimental findings. Optimum annealing times for GC-rich genes lie in the range of 3 to 6 seconds and depend on annealing temperature. Annealing times greater than 10 seconds yield smeared PCR amplified products. The non-GC-rich gene did not exhibit this sensitivity to annealing times. Theory and experimental results show that, shorter annealing times are not only sufficient but also necessary for efficient PCR amplification of GC-rich templates.
1. Introduction
PCR is widely used in either diagnostic or molecular analysis of DNA and RNA. However, amplification of templates with a high GC content using PCR is usually difficult compared to non-GC-rich targets (McDowell et al., 1998). Although only a small percentage (~3%) of the human DNA is GC-rich, important regulatory domains including promoters, enhancers, and control elements consist of GC-rich cis-elements (Wilson et al., 1997). Most housekeeping genes, tumor-suppressor genes, and approximately 40% of tissue-specific genes contain high GC sequences in their promoter region, making their DNA less amenable to amplification.
To overcome the problems associated with the amplification of GC-rich genes (and/or using GC-rich primers), several approaches have been developed. Organic molecules such as dimethyl sulfoxide (DMSO), glycerol, polyethylene glycol, formamide, betaine, 7-deaza-dGTP, and dUTP have been included in the reaction mixture and have been shown to improve the amplification of GC-rich DNA sequences (Baskaran et al., 1996; Chakrabarti and Schutt, 2001; Henke et al., 1997; Kang et al., 2005; Musso et al., 2006; Mutter and Boynton, 1995; Pomp and Medrano, 1991; Sidhu et al., 1996; Sun et al., 1993; Turner and Jenkins, 1995; Weissensteiner and Lanchbury, 1996). Recently, a combination of either two (betaine and DMSO) or three additives (betaine, dimethyl sulfoxide, and 7-deaza-dGTP) has been found to enhance amplification of long PCR products (Kang et al., 2005; Musso et al., 2006), to resolve the complex secondary structure formation at GC-rich regions (Henke et al., 1997; Musso et al., 2006; Ralser et al., 2006). It has been suggested that betaine affects the extension reaction either by binding to AT pairs in the major groove (Rees et al., 1993), or by increasing the hydration of GC pairs by binding within the minor groove and thus destabilizing GC-rich DNA (Mytelka and chamberlin, 1996). It was shown that the template denaturation with NaOH, hot start PCR, stepdown PCR, and primer modification can also improve PCR amplification of highly GC-rich regions of DNA (Agarwal and Perl, 1993; Sahdev et al., 2007). All the above efforts to amplify GC-rich regions are useful in some but not all cases and highlight the need to move from an empirical to a more fundamental approach to the problem.
This study was motivated by difficulties in amplifying the 660 bp human ARX gene from genomic DNA using conventional PCR protocols, with certain additives. It was decided to develop a theoretical model of the annealing step, in the hope that the model may provide some guidance. The theory, included in this study, is based on competitive binding of primers at incorrect sites. Ideally designed primers bind uniquely at the correct binding site. In practice, mispriming occurs and three contributing events are considered. First, primers may anneal at incorrect sites, the probability of such an occurrence depends on the difference between the melting rates of primers at correct vs. incorrect sites. Secondly, polymerase molecules may bind to annealed primers, including ones at incorrect sites, to further stabilize the complexes. Finally, the complexes begin to elongate, albeit at reduced rates (at the annealing temperature), and further stabilize the dsDNA. Therefore the formation of primer/template/polymerase complexes at incorrect sites must be minimized. The model results provided a possible solution – the use of shorter annealing times should minimize incorrect product yield.
It is well known that GC content influences both optimal annealing temperatures and primer specificity, and that annealing occurs quickly: “It is critical that the primers anneal stably to the template…For primers with high GC content, higher annealing temperatures may be necessary. [T]he time for this step is based mainly on the time it takes to reach the proper temperature, because the primers are in such excess that the annealing reaction occurs very quickly.” (Kramer and Coen, 2001) However, the terms of this general knowledge have not yet been defined theoretically. The theory developed here shows, and experimental results confirm, that shorter annealing times are not only sufficient but also necessary for efficient PCR amplification when GC-rich templates or primers are being used. The implementation of the theoretical solution and the experimental results are reported in this study.
2. Materials and Methods
2.1 Instrumentation
PCR was carried out in a PCRJet® thermocycler (Megabase Research Products, Lincoln, NE). With the PCRJet® thermocycler, there is a ~1s delay for heat to conduct through the entire PCR sample (unpublished results). Thus, actual hold times can be up to 1s less than the programmed hold times in the thermocycler. For example, with the PCRJet® set at 3s annealing time, the outer regions of the PCR sample will anneal for 3s while the inner PCR sample will anneal for ~2s. All hold times reported in this work are the programmed hold times.
2.2 PCR amplification of GC-rich ARX and normal GC β-globin (HBB)
All PCR amplifications were performed with KOD Hot Start polymerase (Novagen, Madison, WI). PCR was carried out in 25 μl reaction volumes containing 100 ng genomic DNA (Roche) templates, 200 μM of each dNTP, 4mM MgSO4, 400 μg/ml non-acetylated BSA, 0.75 μM of each primer for ARX, 0.25μM of each primer for HBB, 0.5 units KOD Hot-Start Polymerase and 1X manufacturer’s buffer (Novagen, Madison, WI) in presence (ARX) or absence (HBB) of 11% DMSO (v/v). The sequences of both forward and reverse primers, size of the amplified gene product and the GC content of the gene products amplified in this paper are listed in Table 1. The primers were designed based on the genomic sequence deposited in GenBank under accession number of NC_000023.
Table 1.
Forward and reverse primers for five different human genes
| Gene | Size | GC_content | 5′ forward primer | 3′ backward primer |
|---|---|---|---|---|
| ARX | 660 bp | 78.72% | 5-CCAAGGCGTCGAAGTCTG-3 | 5-TCATCTTCTTCGTCCTCCAG-3 |
| HBB | 536 bp | 52.99% | 5-GCTCACTCAGTGTGGCAAAG-3 | 5-GGTTGGCCAATCTACTCCCAGG-3 |
The PCR conditions were: 30s hot start at 94°C foll owed by 35 or 38 cycles of 94°C for 2s, 56–64°C for 3–20s, and 72°C for 4s, and final extension at 72°C f or 30s.
Remark
The KOD Hot-Start Polymerase has an average extension rate of near 200 nucleotides per second (Griep et al., 2006b) and the 4s extension time is more than sufficient to complete extension, as confirmed by experiments (results not shown).
3. Results and Discussion
3.1 Amplification of ARX gene
Human genomic DNA was used as initial template for the amplification of a 660 bp ARX gene fragment with a GC content of 78.72%. The theoretical model provided guidelines for annealing conditions. PCR reactions were optimized for two parameters: (1) the annealing times were varied in the range of 1s to 20s at constant temperature and (2) the annealing temperatures were varied whilst the annealing time remained constant.
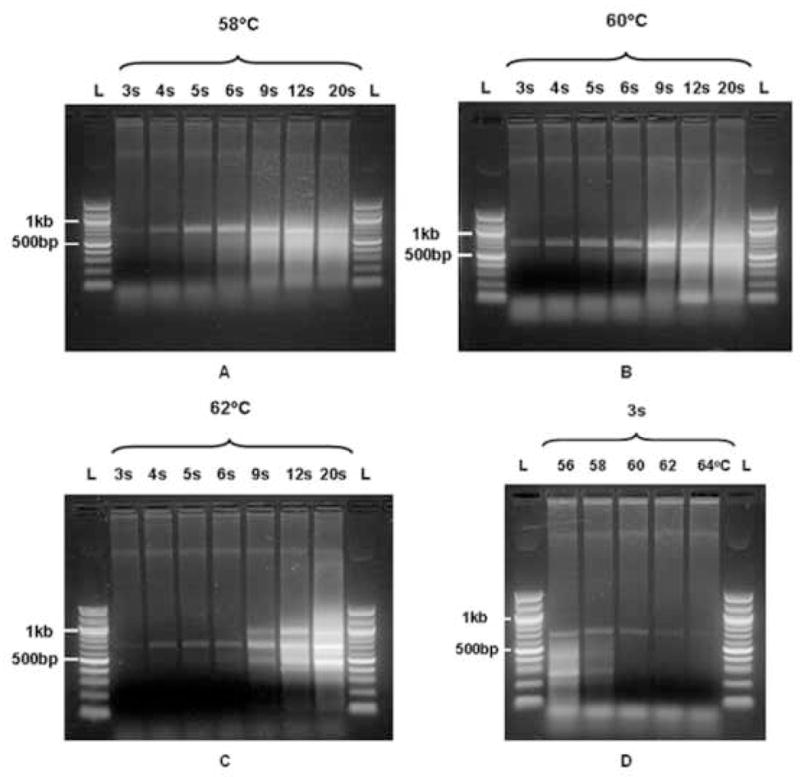
In Figures 1A–C electrophoresis gel results are shown for varying annealing times at constant temperatures (58, 60 and 62°C respectively). The following observations are made. Qualitatively, the outcomes at each of the temperatures are similar; at longer annealing times increasing smear occurs. Quantitatively, at an annealing temperature of 58°C (Figure 1A), the initial appearance of a smear, albeit it faint, occurs at annealing times as short at 5s. This observation should be compared to the results at an annealing temperature of 60°C (Figure 1B) and 62°C (Figure 1C), where the appearance of a distinguishable smear only starts at tA =6s and tA =9s respectively. Also note that at 60°C, the yield increases between tA =3s and tA =4s. At higher annealing temperatures (cf. Figure 1C), one notes the formation of fewer incorrect products (compare tA =9s at all three temperatures).
Figure 1.
The efficiency η (tA, TA) as a function of annealing temperature and time for (A) a case of low competition and (B) the ARX gene (high competition). The primer and polymerase binding rates are p = 72 s−1, and s = 2.4 s−1 respectively. Color bars indicate values of annealing efficiency, η
Figure 1D shows the results for amplification of the ARX gene at a constant annealing time of 3 s and varying annealing temperatures between 56°C-64°C. A unique, specific band with the expected size of 660 bp is present at 60°C annealing temperature and 3s annealing time. At temperatures below 60°C the gel products contain smears – typical of competitive binding. At temperatures above 60°C the yield of the 660 bp product decreases.
3.2 Amplification of β-globin gene
Figure 2 shows PCR amplification results of the 52.99% GC, 536bp, human β-globin gene. Compared to the ARX amplification results (Figures 1A–C), one notes the similar trend of increased smear with longer annealing times. The β-globin gene, however, appears less sensitive to annealing times – even at tA =20s the background smear is much less prominent than the cases shown in Figure 1. These observations are consistent with the theoretical predictions for low competitive binding (cf. Figure 3A in section 4.4 below).
Figure 2.

Electrophoresis gel results of the PCR amplification of the ARX gene. (A)–(C) Varying annealing times at a constant annealing temperatures of 58, 60, and 62°C respectively. (D) Varying annealing temperatures at constant annealing time of 3 seconds. DNA markers shown in L lanes are QuickLoad 100bp DNA ladders (Ipswich, MA).
Figure 3.

Gel electrophoresis of PCR product of β-globin gene. Lane 1 is 100bp QuickLoad DNA ladder. Lanes 2–6 show results of varying annealing times at 57°C.
4. Mathematical model of annealing
At the onset of the annealing stage in PCR, the target DNA molecules are separated into 3′–5′ and 5′–3′ single strands. Complementary forward and reverse primers are designed to bind uniquely to the respective single strands. The efficiency of annealing, and hence the overall PCR process, is compromised by competitive annealing events. Annealing is a dynamic process; primers bind and melt, but the average time a template site is annealed to a primer depends on the stability of the primer/template bond at the annealing temperature. Ideally the primer/template bonds at the target sites are very stable and all other binding sites are very unstable. GC-rich regions in either the primers and/or the DNA template increase the stability of undesirable binding sites; therefore, non-ideal primer/template bonds play a greater role in GC-rich PCR. If a primer is annealed to the template, DNA polymerase may bind to its 3′ end to form a ternary complex and further stabilize the complex.
4.1 Formulating the model
Let the fraction of templates which have primers annealed at the ith binding site be denoted by Xi. Also define Xpi as the fraction of the templates that have formed a ternary complex with the primer and DNA polymerase. Assuming excess primer and polymerase, the balancing equations for Xi and Xpi are:
| (1) |
| (2) |
The rate of primer annealing is p and the rate constant of melting at the ith binding site is mi. The ternary complex forms at a rate sXi. The ternary complex is stable at the annealing conditions; in other words, the reaction is assumed to be irreversible. The solution of eq.(1–2) is trivial, noting that the initial conditions are Xi (0) Xpi(0)=0:
| (3) |
where
Note: The rate constants n1i n2i depend on annealing temperature (TA) (see discussion on melting rates in section 4.1.3).
4.1.1 Annealing efficiency
Let i = 1 be the location of the intended primer binding site. If no competitive binding occurs, then the efficiency of annealing equals the fraction of templates which are annealed after an annealing period tA:
| (4) |
At constant annealing temperature, the yield increases monotonically with time (i.e. ). The belief that longer annealing times are better is widely held, regardless of competition from other possible annealing sites. However, it is only true if no competition is present. If there are k possible annealing sites where the primers may bind, with i = 2,3,…, k representing undesired competitive sites, then the efficiency of annealing is given by the following expression that is also our main theoretical result:
| (5) |
Thus the efficiency η is defined as the probability that the ternary complex has formed at the correct site and not at any competitive site. As in any serial process, the overall PCR efficiency is the product of the efficiency of each step. Hence the overall PCR efficiency is directly proportional toη. The annealing efficiency η is itself affected by many factors, and annealing temperatures and times are only two of them. For the definition of η (eq. (5)), it is tacitly assumed that the polymerase cannot process beyond ternary complexes that have formed downstream at competitive sites i > 1.
4.1.2 Arrival rates
In order to calculate the rate constants n1i and n2i, the primer arrival and melting rates, and polymerase arrival rate must be known. The primers (and polymerase) diffuse in the bulk medium towards the templates, and the average arrival time at the binding sites depends on a measure of the size (λ) of a primer (polymerase) and the bulk diffusion coefficient:
| (6) |
If there are R primers in the solution, then w = R N is the probability that a primer arrives at a binding site in time interval τ. The primer arrival frequency (rate constant) is
| (7) |
Similar arguments are used to estimate the polymerase binding rate constant:
| (8) |
A 20 bp primer has an estimated diffusion coefficient of D ≈ 10−10 m2 s−1 (Tirado et al., 1984; Lukacs et al., 2000). The polymerase diffusion coefficient is calculated from the Stokes-Einstein equation (Krouglova et al., 2004) as D ≈ 4×10⁻¹¹ m2 s−1.
If the amount of primer in a 25μl reaction volume is 10 picomoles, and the characteristic length of the primer is taken as λ = 5 × 10 −10 m, then τ ≈ 4.17 ×10⁻¹⁰ s, N ≈ 2 ×10²⁰, and w ≈ 3 ×10⁻⁸. The arrival rate is estimated to be
| (9) |
In this study 0.5 EU of KOD polymerase has been used per experiment. The supplier of KOD (Novagen, Madison, WI), uses the following definition: “1EU is the amount of enzyme that catalytically inserts 10 nanomoles of dNTPs in 30 minutes”. The amount of polymerase is calculated as 0.5EU ≡ 3.5 ×10⁻¹⁴ mole. The activity of Taq pol. has been used (Innis et al., 1988; Gelfand and White, 1990) although higher rates have been observed for KOD (Griep et al., 2006a, 2006b). The diffusion coefficient and characteristic length are calculated as D = 4 ×10⁻¹¹ m2/s and λ = 1.2 ×10⁻⁸ m. Based on these values, the arrival rate of the polymerase is:
| (10) |
4.1.3 Melting rates
The melting rate of a primer-template complex depends on its excess free energy (ΔGT) at a specific temperature T. SantaLucia and Hicks (2004) provide a comprehensive review of thermodynamic variables for nearest neighbors of base pairs. The nearest-neighbor method is used to calculate the melting probability θi of a primer at a specific template site as a function of temperature. The melting rates mi follow from the relationship:
| (11) |
4.2 Application of the model
Eq.(5) describes the efficiency of annealing when there are k−1competitive primer binding sites on the template. For the sake of simplicity, one might write eq. (5) for k = 2, representing a single competitive site:
| (12) |
In Figure 3A efficiency of annealing, η (tA, TA), is plotted as a function of annealing time and annealing temperature, for the case where competitive binding is low. This situation is expected to represent templates with average GC content (<50–60%). High efficiency exists over a wide range of annealing times and the efficiency is not adversely affected by the longer annealing times of typical PCR protocols - i.e. annealing times between 10 and 30 seconds.
In comparison, Figure 3B shows the efficiency of annealing, η (tA, TA), for the case where competitive binding is high. The figure represents the annealing efficiency profile for the ARX gene, with consideration of competition (defined by eq. (12)). The primer and polymerase arrival rates are taken to be 72s−1 and 2.4s−1 respectively. The most important difference between Figure 3A and Figure 3B is the appearance of a ridge of optimal temperature-time values, and a prominent local optimum – the optimum annealing times lie in a narrow region between 3 and 6 seconds at temperatures below 60°C. Low annealing efficiencies exist on both sides of the optimum. At tA ≪ toptimum the time is insufficient to form ternary complexes at the correct site. Neither the desired nor the undesired competitive PCR products are produced. At tA ≫ toptimum the efficiency is low because incorrect competitive binding (mispriming) becomes significant; the result is a smear of PCR products.
4.3 Connecting the experimental results with the theoretical model
In Figures 4A–C the efficiency of annealing η (zoomed in from Figure 3B) is plotted as a function of annealing temperature and annealing time. Figures 4A–C correspond to the experimental results of Figures 1A–C. In each figure the loci at constant temperature (58, 60 and 62°C) extends over ten seconds and traces the changes in efficiency of annealing (which is proportional to yield) as a function of annealing time. Three points are marked on each loci: point 1 shows lower efficiency than the optimum since insufficient time has passed to form any significant amount of the polymerase-stabilized complex at the correct site, point 2 lies at or near the optimum; sufficient time has passed to form ternary complexes at the correct site, but no significant amount of complexes have yet formed at the competitive sites, point 3 shows the reduction in efficiency due to too long annealing period - more competitive product has now formed.
Figure 4.

The efficiency of annealing η is shown as a function of annealing time and annealing temperature. Loci at constant time and constant temperature are shown in bold on the surface. (A) Loci at 3s and 58°C, (B) loci at 4s and 60°C, and (C) loci at 5s and 62°C. See text for discussion. Color scales correspond to color bars in Figures 1A and 1B.
Consider Figures 1A and 4A. The theory predicts a narrow optimal hold time of about 3s for annealing at 58°C (Point 2 in Figure 4A). This is consistent with the experimental results showing an increasing smear from as low as 5s annealing, with a considerable drop in efficiency by 9s (Figure 1A). Next, consider Figures 1B and 4B. The theory predicts an optimal tA of about 4s for annealing at 60°C (Point 2 in Figure 4B) that corresponds well with the experimental results. Although not shown, experimental results at an annealing time of 1s did not show any significant product – consistent with the theory, as indicated by point 1 in Figure 4B. Finally, consider Figures 1C and 4C. At 62°C annealing temperature, an optimal annealing time of 5s is predicted (Point 2 in Figure 4C), but the surface in the proximity of the optimum is flatter compared to the topography near the optima in the case of the lower annealing temperatures. The near-similar results at 4, 5 and 6s annealing times in Figure 1C are consistent with the model predictions.
If tA is prolonged beyond the optimum time, a decrease in efficiency occurs, as is evident from the increasing smear (Figure 1A–C). The decrease in efficiency beyond the optimal annealing times is less pronounced at higher temperatures (compare the slopes of the loci between points 2 and 3 in Figure 4A, B and C) – the experimental findings support this. The experimental results at 62°C show a less intense smear at 9s compared to the same annealing time at 58°C (Figures 1A and 1C). The gel results at 62°C for annealing times of 9s and longer for 62°C maintain a distinct band pattern, despite the increase in the background smear. However, no distinguishable bands are present at the lower annealing temperatures (Figures 1A and 1B). These results are consistent with the theory that the number of viable alternative primer binding sites becomes fewer at higher annealing temperatures. However, if the annealing times are extended beyond 20s at 62°C, one expects that smears will develop similar to those seen for 58 and 60°C.
Juxtapose the experimental results of Figure 1D with the theoretical results (the constant time locus) in Figure 4A. This locus traces the effect of different annealing temperatures on the efficiency – the annealing time is constant at tA = 3s. Theory predicts an optimum annealing temperature of around 59°C for 3s annealing times. Points which lie before the optimum, mark lower temperatures than 59°C and correspond to the lanes marked ‘56’ and ‘58’ in Figure 1D. These two lanes exhibit smears that are typical of competitive product formation. At temperatures above the optimum, a sharp reduction in efficiency is predicted by the model, and that is consistent with experimental results in the lanes marked ’62’ and ‘64’ in Figure 1D.
In conclusion, refer to Figure 3A, which is representative of minimal competition for binding. Note that the region near optimality is more flat compared to Figure 3B. In other words, the system is much less sensitive to annealing time if competitive binding is absent or minimal. The gel results in Figure 2 confirm that, for normal GC templates with minimal competitive primer binding sites, tA can be varied over a broad range without too much variation in yield.
5 Conclusions
The most important conclusions that can de drawn from the study are:
The theoretical model predicts that, in the absence of competitive binding the efficiency of annealing (definition - eq. 5) is a monotone function of annealing time. Thus the theory suggests that, in the complete absence of competitive binding, prolonged annealing improves yield.
In the case of low competitive binding (as is typical of genes with average GC content), theory predicts a very broad optimum in annealing times (Figure 3A). This relative insensitivity to annealing times is experimentally confirmed (Figure 2).
If there is strong competition to bind primers at alternative sites on the template (as is often the case for GC-rich templates), then the annealing time has a local optimum. The annealing time must be sufficiently long to form the ternary complexes at the correct template site, but too long annealing time creates the opportunity for ternary complexes to form at incorrect binding sites.
The model as applied to the ARX gene is consistent with the experimental results (cf. Figures 1 and 4).
Although it is a well-documented fact that the use of DMSO improves the PCR yield, its role in the context of competitive binding is worth mentioning again. DMSO ameliorates the inhibitive effect of competitive binding on the yield function by increasing the melting rates at those sites.
Footnotes
Publisher's Disclaimer: This is a PDF file of an unedited manuscript that has been accepted for publication. As a service to our customers we are providing this early version of the manuscript. The manuscript will undergo copyediting, typesetting, and review of the resulting proof before it is published in its final citable form. Please note that during the production process errors may be discovered which could affect the content, and all legal disclaimers that apply to the journal pertain.
References
- Agarwal RK, Perl A. PCR amplification of highly GC-rich DNA template after denaturation by NaOH. Nucl Acids Res. 1993;21:5283–5284. doi: 10.1093/nar/21.22.5283. [DOI] [PMC free article] [PubMed] [Google Scholar]
- Baskaran N, Kandpal RP, Bhargava AK, Glynn MW, Bale A, Weissman SM. Uniform amplification of a mixture of deoxyribonucleic acids with varying GC content. Genome Res. 1996;6:633–638. doi: 10.1101/gr.6.7.633. [DOI] [PubMed] [Google Scholar]
- Chakrabarti R, Schutt CE. The enhancement of PCR amplification by low molecular-weight sulfones. Nucleic Acids Res. 2001;29:2377–2381. doi: 10.1093/nar/29.11.2377. [DOI] [PMC free article] [PubMed] [Google Scholar]
- Gelfand DH, White TJ. Thermostable DNA Polymerases. In: Innis MA, Gelfand DH, Sninsky JJ, White TJ, editors. PCR Protocols: A Guide to Methods and Applications. Academic Press, Inc; San Diego: 1990. [Google Scholar]
- Griep MA, Whitney SE, Nelson RM, Viljoen HJ. DNA polymerase chain reaction: a model of error frequencies and extension rates. AIChE Journal. 2006a;52:384–392. [Google Scholar]
- Griep MA, Kotera CA, Nelson RM, Viljoen HJ. Kinetics of the DNA Polymerase Pyrococcus Kodakaraensis. Chem Eng Sci. 2006b;61:3885–3892. [Google Scholar]
- Henke W, Herdel K, Jung K, Schnorr D, Loening SA. Betaine improves the PCR amplification of GC-rich DNA sequences. Nucleic Acids Res. 1997;25:3957–3958. doi: 10.1093/nar/25.19.3957. [DOI] [PMC free article] [PubMed] [Google Scholar]
- Innis MA, Myambo KB, Gelfand DH, Brow MAD. DNA sequencing with Thermus aquaticus DNA polymerase and direct sequencing of polymerase chain-reaction amplified DNA. Proc Nat Acad Sciences USA. 1988;85:9436–9440. doi: 10.1073/pnas.85.24.9436. [DOI] [PMC free article] [PubMed] [Google Scholar]
- Kang J, Lee MS, Gorenstein DG. The enhancement of PCR amplification of a random sequence DNA library by DMSO and betaine: application to in vitro combinatorial selection of aptamers. J Biochem Biophys Methods. 2005;64:147–151. doi: 10.1016/j.jbbm.2005.06.003. [DOI] [PubMed] [Google Scholar]
- Kramer MF, Coen DM. Enzymatic amplification of DNA by PCR: standard procedures and optimization. Curr Protoc Mol Biol. 2001;Chapter 15(Unit 151) doi: 10.1002/0471142727.mb1501s56. [DOI] [PubMed] [Google Scholar]
- Krouglova T, Vercammen J, Engelborghs Y. Correct diffusion coefficients of proteins in fluorescence correlation spectroscopy. Application to tubulin oligomers induced by Mg2+ and Paclitaxel. Biophys J. 2004;87:2635–2646. doi: 10.1529/biophysj.104.040717. [DOI] [PMC free article] [PubMed] [Google Scholar]
- Lukacs GL, Haggie P, Seksek O, Lechardeur D, Freedman N, Verkmann AS. Size-dependent DNA mobility in cytoplasm and nucleus. J Biol Chem. 2000;275:1625–1629. doi: 10.1074/jbc.275.3.1625. [DOI] [PubMed] [Google Scholar]
- McDowell DG, Burns NA, Parkes HC. Localized sequence regions possessing high melting temperature prevent the amplification of a DNA mimic in competitive PCR. Nucleic Acids Res. 1998;26:3340–3347. doi: 10.1093/nar/26.14.3340. [DOI] [PMC free article] [PubMed] [Google Scholar]
- Musso M, Bocciardi R, Parodi S, Ravazzolo R, Ceccherini I. Betaine, dimethyl sulfoxide, and 7-deaza-dGTP, a powerful mixture for amplification of GC-rich DNA sequences. J Mol Diagn. 2006;8:544–550. doi: 10.2353/jmoldx.2006.060058. [DOI] [PMC free article] [PubMed] [Google Scholar]
- Mutter GL, Boynton KA. PCR bias in amplification of androgen receptor alleles a trinucleotide repeat marker used in clonality studies. Nucleic Acids Res. 1995;23:1411–1418. doi: 10.1093/nar/23.8.1411. [DOI] [PMC free article] [PubMed] [Google Scholar]
- Mytelka DS, Chamberlin MJ. Analysis and suppression of DNA polymerase pauses associated with a trinucleotide consensus. Nucleic Acids Res. 1996;24:2774–2781. doi: 10.1093/nar/24.14.2774. [DOI] [PMC free article] [PubMed] [Google Scholar]
- Pomp D, Medrano JF. Organic solvents as facilitators of polymerase chain reaction. Biotechniques. 1991;10:58–59. [PubMed] [Google Scholar]
- Ralser M, Querfurth R, Warnatz HJ, Lehrach H, Yaspo ML, Krobitsch S. An efficient and economic enhancer mix for PCR. Biochem Biophys Res Commun. 2006;347:747–751. doi: 10.1016/j.bbrc.2006.06.151. [DOI] [PubMed] [Google Scholar]
- Rees WA, Yager TD, Korte J, von Hippel PH. Betaine can eliminate the base pair composition dependence of DNA melting. Biochemistry. 1993;12:137–144. doi: 10.1021/bi00052a019. [DOI] [PubMed] [Google Scholar]
- Sahdev S, Saini S, Tiwari P, Saxena S, Singh Saini K. Amplification of GC-rich genes by following a combination strategy of primer design, enhancers and modified PCR cycle conditions. Mol Cell Probes. 2007;21:303–307. doi: 10.1016/j.mcp.2007.03.004. [DOI] [PubMed] [Google Scholar]
- Sidhu MK, Liao MJ, Rashidbaigi A. Dimethyl sulfoxide improves RNA amplification. Biotechniques. 1996;21:44–47. doi: 10.2144/96211bm08. [DOI] [PubMed] [Google Scholar]
- Sun Y, Hegamyer G, Colburn NH. PCR-direct sequencing of a GC-rich region by inclusion of 10% DMSO: application to c-jun. Biotechniques. 1993;15:372–374. [PubMed] [Google Scholar]
- Tirado MM, Martinez CL, de la Torte JG. Comparison of theories for translational and rotational diffusion coefficients of rod-like macromolecules. Application to short DNA fragments. J Chem Phys. 1984;81:2047–2052. [Google Scholar]
- Turner SL, Jenkins FJ. Use of deoxyinosine in PCR to improve amplification of GC-rich DNA. Biotechniques. 1995;19:48–52. [PubMed] [Google Scholar]
- Weissensteiner T, Lanchbury JS. Strategy for controlling preferential amplification and avoiding false negatives in PCR typing. Biotechniques. 1996;21:1102–1108. doi: 10.2144/96216rr03. [DOI] [PubMed] [Google Scholar]
- Wilson AG, Symons JA, McDowell TL, McDevitt HO, Duff GW. Effects of a polymorphism in the human tumor necrosis factor alpha promoter on transcriptional activation. Proc Nat Acad Sciences USA. 1997;94:3195–3199. doi: 10.1073/pnas.94.7.3195. [DOI] [PMC free article] [PubMed] [Google Scholar]