

Abstract
It is generally accepted that the translation rate depends on the availability of cognate aa-tRNAs. In this study it is shown that the key factor that determines translation rate is the competition between near-cognate and cognate aa-tRNAs. The transport mechanism in the cytoplasm is diffusion, thus the competition between cognate, near-cognate and non-cognate aa-tRNAs to bind to the ribosome is a stochastic process. Two competition measures are introduced; C(i) and R(i) (i = 1,64 ) are quotients of the arrival frequencies of near-cognates vs. cognates and non-cognates vs. cognates respectively. Furthermore, the reaction rates of bound cognates differ from those of bound near-cognates. If a near-cognate aa-tRNA binds to the A site of the ribosome, it may be rejected at the anti-codon recognition step or proofreading step or it may be accepted. Regardless of its fate, the near-cognates and non-cognates have caused delays of varying duration to the observed rate of translation. Rate constants have been measured at a temperature of 20°C by Gromadski and Rodnina (2004). These rate constants have been re-evaluated at 37°C, using experimental data at 24.5°C and 37°C (Varenne et al. (1984)). The key results of the study are: (i) the average time (at 37°C ) to add an amino acid, as defined by the ith codon, to the nascent peptide chain is: τ(i) = 9.06 + 1.445×[10.48C(i) 0.5R(i)] (in ms); (ii) the misreading frequency is directly proportional to the near-cognate competition, E(i) = 0.0009C(i); (iii) the competition from near-cognates, and not the availability of cognate aa-tRNAs, is the most important factor that determines the translation rate – the four codons with highest near-cognate competition (in the case of E. coli) are [GCC]> [CGG]> [AGG]> [GGA], which overlap only partially with the rarest codons: [AGG]< [CCA]< [GCC]< [CAC]; (iv) based on the kinetic rates at 37°C, the average time to insert a cognate amino acid is 9.06 ms and the average delay to process a near-cognate aa-tRNA is 10.45 ms; (vii) the model also provides estimates of the vacancy times of the A site of the ribosome – an important factor in frameshifting.
Keywords: ribosome kinetics, translation, tRNA availability, mistranslation frequencies
1. Introduction
Varenne et al. (1984) investigated the role of intracellular tRNA concentrations in the dynamics and regulation of protein synthesis. Their three major conclusions are: (1) the ribosome’s idling in the open A site in its stochastic search for a cognate or near-cognate aa-tRNA is the rate-limiting step in the peptidyl elongation cycle, since translation and translocation steps occur much faster; (2) imbalances in tRNA concentrations in the cytoplasm lead to variations in the translation rate; (3) the possible role of mRNA secondary structure in non-uniform translation rates is minor, at least for proteins they investigated. Another important point they raised is our incomplete knowledge of the decoding spectrum (cf. point (4) on p.569 of Varenne et al. (1984)). Table 4 (Varenne et al. 1984, p.570) summarizes average synthesis rates for various proteins in E. coli. The rates which have been measured at 24.5°C (Rate B in their Table 4) compare very closely with our theoretical results, which use the kinetic rates of Gromadski and Rodnina (2004) measured at 20°C. Heyd and Drew (2003), who also based their model on the mechanism proposed by Rodnina and co-workers, obtained an average translation rate of 2.24 amino acids/s. It is interesting to note their explanation of their low translation rates; they ascribe it to possible errors in the measured kinetic rates (cf. p.1105), but they did not consider the difference between the kinetic rates at 37°C and 20°C.
Table 4.
Rate constants for translocation transfer, at 20°C.
| Rate constant | k1μM−1s−1 | k−1s−1 | k2s−1 | k−2s−1 | k3s−1 | kGTPs−1 | k4s−1 | k5s−1 | k7s−1 | kpeps−1 |
|---|---|---|---|---|---|---|---|---|---|---|
| Cognate | 140 | 85 | 190 | 0.23 | 260 | 1,000 | 1,000 | 1,000 | 60 | 200 |
| Near-cognate | 140 | 85 | 190 | 80 | 0.4 | 1,000 | 1,000 | 60 | 1,000 | 200 |
Gilchrist and Wagner (2006) developed a model for single mRNA translation. They did include ribosome recycling in their model, but ribosome-ribosome interaction was not considered. Variation in elongation rates was assumed to be directly proportional to tRNA availability and scaled to give an average rate of 10 amino acids/s. They defined ‘nonsense errors’ as one of the following events: (i) ribosome release from the mRNA prior to completion of the translation process, (ii) frameshifting and (iii) false termination. However, their model did not consider the important issue of misreading errors. Furthermore, the same probabilities for these events were assigned to all codons. Farabaugh (1997) provided many examples of codon-dependent frameshifting. Sipley and Goldman (1993) found that extended pauses in translation, during which the A-site is vacant, increase the frequency of frameshifting. In addition, alleles that translate slowly are prone to frameshift more frequently. Conversely, if they increased the concentrations of cognate tRNA, then the A-site vacancy time was reduced and the frameshift frequency dropped. The aforementioned results are consistent with those of Rosenberg et al. (1993), who found that mRNA containing high numbers of the rare codon AGG caused its corresponding tRNA to be sequestered and the ribosome stalled at the first of two consecutive AGG codons. The stalled ribosome frameshifted, hopped, or terminated translation as an upstream translating ribosome approached.
Ribosome-ribosome interaction becomes a factor to consider if there are sections on the mRNA that translate sufficiently slowly to cause trailing ribosomes to stall behind the one in a slow mRNA section. Zouridis and Hatzimanikatis (2007) found that translation is initiation- or elongation-limited for low or intermediate polysome sizes, respectively, and termination-limited for high polysome sizes. After calculating an effective elongation rate constant which varies with the degree of ribosome crowding, they concluded that protein synthesis rates are maximized when polysome size corresponds to a set of effective elongation rate constants while avoiding crowding along the mRNA. Koontz et al. (1983) found that varying the concentration of Trp-tRNATrp in cells increased the polysome size distribution, supporting a model in which a translating ribosome stalls (and subsequent ribosomes are backed up behind it) at Trp codons when the concentration of the corresponding tRNA is low. Kremling (2006) derived a phenomenological model of translation of prokaryotes that also includes RNA transcription. The model provides expressions for the steady-state population of ribosomes on both nascent and complete mRNAs.
An interesting study was reported by Wahab et al. (1993). They observed that hypomodified tRNA led to a decrease in protein synthesis and growth rates in E. coli. But they also found that cells can tolerate a large increase in concentration of a single tRNA with little effect on growth. The single modified tRNA1Leu also did not markedly affect overall misreading errors. Sorensen et al. (1989) studied translation rates of some “frequent” and “infrequent” codons and found that the infrequent codons were translated slower than the frequent codons by a factor of six. They proposed that there might be individual codons which are translated twenty-fold slower than frequent codons. They also determined that “an extraordinary drain of the corresponding tRNAs” was not the cause of the infrequent codons’ slow translation. This result points to the competition between cognates and near-cognates as a plausible explanation of reduction in translation rate, instead of tRNA depletion.
2. Mathematical Model
The observed rate of translation is a combination of the rate of transport of aa-tRNA species to a ribosomal A site and the intrinsic kinetics of peptidyl transfer and ribosome translocation. The transport mechanism in the cytoplasm is diffusion, which is a stochastic process. The average arrival times of different species at a ribosome depend on their diffusion coefficients and numbers in a cell. The inverses of the arrival times are the arrival frequencies. If the arrival frequencies are multiplied by a brief time interval δt, one obtains the probabilities that different species will arrive at a ribosome during time interval δt. Based on this information the probability that a cognate, near-cognate or non-cognate aa-tRNA may bind, or attempt to bind, to the ribosome can be calculated. Whilst non-cognates do not bind (or are highly unlikely to do so), near-cognates enter the intrinsic kinetic process. Near-cognates may be rejected at the anti-codon recognition step or proofreading step or they may be accepted. Regardless of its fate, the near-cognate has caused a time delay of varying duration to the observed rate of translation. The average time to add an amino acid to the polypeptide chain depends on the competition between cognate and near-cognate aa-tRNAs. Thus it is not necessarily cognate aa-tRNAs of low abundance, but rather cognate aa-tRNAs with large near-cognate arrival frequencies that translate slower and exhibit higher error frequencies.
The mathematical model is based on the following five assumptions:
The tRNA pool is constant.
Translation is not affected by RNA transcription.
Interference from other ribosomes on the same mRNA is not considered.
The translation rates are derived for the kinetic rates as reported by Gromadski and Rodnina (2004).
Kinetic rate constants which have not been measured are assigned large values in order not to become rate determining.
To further explain the above-listed assumptions, we offer the following remarks. If the aa-tRNA pool changes, then the arrival frequencies of the model change. Since the link between arrival frequencies and the aa-tRNA pool composition is straightforward, pool changes are easily accommodated in the model. Assumptions (2) and (3) help us to focus on the dynamics of species transport and the translation process, without obscuration by other serial processes. The experimental kinetic parameters, which have been measured by Gromadski and Rodnina (2004) for the codon [CUC], its cognate Leu-tRNA and the near cognate Phe-tRNA, have been applied to all codons. Thus assumption (4) can be relaxed if additional kinetic data becomes available.
In section 2.1 the aa-tRNA transport to the ribosome is described and the arrival frequencies are derived. The competition measures are introduced in section 2.2. An overall rate expression based on the kinetics of peptidyl transfer and translocation is derived in section 2.3. The application of the model is discussed in section 2.4.
2.1 Transport of tRNA to A site of ribosome
The transport of aa-tRNAs throughout the cytoplasm occurs by diffusion. Thus the aa-tRNAs act as random walkers and the ribosomes on mRNAs with vacant A sites are the targets. The random walker set comprises of all aa-tRNAs and the release factors RF1 and RF2. The species are listed in Table 1 together with their average number/cell (Dong et al. (1996)). The values were measured at a growth rate of 0.4 doublings per hour. Elowitz et al. (1999) measured mobility of proteins of different sizes in the cytoplasm of E. coli (relative to the mobility of green fluorescent protein (GFP)) and found that a 2.6-fold increase in molecular weight of the protein resulted in a 3.1-fold decrease in its diffusion coefficient. Though molecular weight was shown not to be the only determining factor in the diffusion coefficient, we used the above relation to estimate the diffusion coefficients, which are also listed in Table 1.
Table 1.
tRNA pool composition, arrival times (s) and diffusion coefficients (m2/s).
| tRNA | Amino Acid | Label | Anti-codon | Codon recognized | molecules/cell | Fraction | Diffusion coefficients (×10^(−11)) | Average arrival time |
|---|---|---|---|---|---|---|---|---|
| Ala1 | A | 1 | UGC | GCU,GCA,GCG | 3250 | 4.55 | 0.2571 | 0.0014 |
| Ala2 | A | 2 | GGC | GCC | 617 | 0.86 | 0.2571 | 0.0073 |
| Arg2 | R | 3 | ACG | CGU,CGC,CGA | 4752 | 6.65 | 0.2568 | 0.0009 |
| Arg3 | R | 4 | CCG | CGG | 639 | 0.89 | 0.2568 | 0.007 |
| Arg4 | R | 5 | UCU | AGA | 867 | 1.21 | 0.2568 | 0.0052 |
| Arg5 | R | 6 | CCU | AGG | 420 | 0.59 | 0.2568 | 0.0107 |
| Asn | N | 7 | GUU | AAC,AAU | 1193 | 1.67 | 0.2570 | 0.0038 |
| Asp 1 | D | 8 | GUC | GAC,GAU | 2396 | 3.35 | 0.2570 | 0.0019 |
| Cys | C | 9 | GCA | UGC,UGU | 1587 | 2.22 | 0.2570 | 0.0028 |
| Gln1 | Q | 10 | UUG | CAA | 764 | 1.07 | 0.2569 | 0.0059 |
| Gln2 | Q | 11 | CUG | CAG | 881 | 1.23 | 0.2569 | 0.0051 |
| Glu2 | E | 12 | UUC | GAA,GAG | 4717 | 6.60 | 0.2569 | 0.0009 |
| Gly1 | G | 13 | CCC | GGG | 1068.5 | 1.49 | 0.2572 | 0.0042 |
| Gly2 | G | 14 | UCC | GGA,GGG | 1068.5 | 1.49 | 0.2572 | 0.0042 |
| Gly3 | G | 15 | GCC | GGC,GGU | 4359 | 6.10 | 0.2572 | 0.001 |
| His | H | 16 | GUG | CAC,CAU | 639 | 0.89 | 0.2569 | 0.007 |
| Ile1 | I | 17 | GAU | AUC,AUU | 1737 | 2.43 | 0.2570 | 0.0026 |
| Ile2 | I | 18 | CAU | AUA | 1737 | 2.43 | 0.2570 | 0.0026 |
| Leu 1 | L | 19 | CAG | CUG | 4470 | 6.25 | 0.2570 | 0.001 |
| Leu 2 | L | 20 | GAG | CUC,CUU | 943 | 1.32 | 0.2570 | 0.0048 |
| Leu 3 | L | 21 | UAG | CUA,CUG | 666 | 0.93 | 0.2570 | 0.0067 |
| Leu 4 | L | 22 | CAA | UUG | 1913 | 2.68 | 0.2570 | 0.0023 |
| Leu 5 | L | 23 | UAA | UUA,UUG | 1031 | 1.44 | 0.2570 | 0.0043 |
| Lys | K | 24 | UUU | AAA,AAG | 1924 | 2.69 | 0.2569 | 0.0023 |
| Met f1 | M | 25 | CAU | AUG | 1211 | 1.69 | 0.2569 | 0.0037 |
| Met f2 | M | 26 | CAU | AUG | 715 | 1.00 | 0.2569 | 0.0063 |
| Met m | M | 27 | CAU | AUG | 706 | 0.99 | 0.2569 | 0.0064 |
| Phe | F | 28 | GAA | UUC,UUU | 1037 | 1.45 | 0.2568 | 0.0043 |
| Pro1 | P | 29 | CGG | CCG | 900 | 1.26 | 0.2570 | 0.005 |
| Pro2 | P | 30 | GGG | CCC,CCU | 720 | 1.01 | 0.2570 | 0.0063 |
| Pro3 | P | 31 | UGG | CCA,CCU,CCG | 581 | 0.81 | 0.2570 | 0.0077 |
| Sec | X | 32 | UCA | UGA | 219 | 0.31 | 0.2575 | 0.0204 |
| Ser1 | S | 33 | UGA | UCA,UCU,UCG | 1296 | 1.81 | 0.2571 | 0.0035 |
| Ser2 | S | 34 | CGA | UCG | 344 | 0.48 | 0.2571 | 0.0131 |
| Ser3 | S | 35 | GCU | AGC,AGU | 1408 | 1.97 | 0.2571 | 0.0032 |
| Ser5 | S | 36 | GGA | UCC,UCU | 764 | 1.07 | 0.2571 | 0.0059 |
| Thr1 | T | 37 | GGU | ACC,ACU | 104 | 0.15 | 0.2570 | 0.0434 |
| Thr2 | T | 38 | CGU | ACG | 541 | 0.76 | 0.2570 | 0.0083 |
| Thr3 | T | 39 | GGU | ACC,ACU | 1095 | 1.53 | 0.2570 | 0.0041 |
| Thr4 | T | 40 | UGU | ACA,ACU,ACG | 916 | 1.28 | 0.2570 | 0.0049 |
| Trp | W | 41 | CCA | UGG | 943 | 1.32 | 0.2567 | 0.0046 |
| Tyr1 | Y | 42 | GUA | UAC,UAU | 769 | 1.08 | 0.2568 | 0.0058 |
| Tyr2 | Y | 43 | GUA | UAC,UAU | 1261 | 1.76 | 0.2568 | 0.0036 |
| Val1 | V | 44 | UAC | GUA,GUG,GUU | 3840 | 5.37 | 0.2570 | 0.0012 |
| Val2 A | V | 45 | GAC | GUC,GUU | 630 | 0.88 | 0.2570 | 0.0072 |
| Val2 B | V | 46 | GAC | GUC,GUU | 635 | 0.89 | 0.2570 | 0.0071 |
| RF1 | X | 47 | UAA,UAG | 1200 | 1.68 | 0.3947 | 0.0003 | |
| RF2 | X | 48 | UAA,UGA | 6000 | 8.39 | 0.3947 | 0.0001 |
The average arrival times are also included in Table 1. A brief description of the derivation follows. Consider the ith component of the random walker set. Define λi as a measure of the size of a walker of type i. Divide the cytoplasm volume V (estimated to be approximately 10−18 m3, Neidhardt et al. (1987)) into Ni walker occupation sites; each site has a characteristic length λi. The number of occupation sites is estimated to be . A random walker moves from one site to the other and the characteristic time that is associated with this transition is τi. The diffusion coefficient Di provides a relationship between λi and τi:
| (1) |
If there are Riwalkers of type i, the probability that a molecule of type i arrives at an open A site in time interval τi is
thus the average time that elapses before the arrival of a molecule of type i is
| (2) |
Example
In an average E. coli cell are 943 tryptophan cognate tRNAs. The characteristic length of the complex EF-Tu-GTP-Trp-tRNA is λ41 = 15×10−9m (Nissen et al. (1999)). The diffusion coefficient is calculated as D41 = 2.567×10⁻¹² m2 s.
The number of occupation sites is and the characteristic time is
The probability that an EF-Tu-GTP-Trp-tRNA complex arrives in the interval τ41 is . The average time that elapses before the arrival of this complex is
2.2 Competition between cognate and near-cognate aa-tRNAs
The 61 codons that code for 20 amino acids have one or more cognate aa-tRNAs and varying numbers of near-cognates. Define a near-cognate as a tRNA with an anti-codon that contains at most a single mismatch with the codon as prescribed by the Watson-Crick base-pairing. Since some cognate tRNAs have a mismatch in the 3rd position, these tRNAs are excluded from the set of near-cognates.
The vector C̄ = {C1;C2;…C64 }is introduced as a measure of competition between the arrival of cognate and near-cognate tRNAs. For each codon the ratio of arrival frequencies of near-cognates vs. arrival rates of cognates is calculated:
| (3a) |
The non-cognate aa-tRNAs may also attempt to bind and their competition measure R = {R1; R2;…R64 }is defined as:
| (3b) |
Table 2 lists the sets of cognates and near-cognates for all 64 codons. For the sake of brevity only the labels as per Table 1 are shown. To demonstrate the calculation and the interpretation of the competition measures, we consider the two codons [UUC] and [UCU ] which code for phenylalanine and serine respectively. In the case of codon[UUC], there are six near-cognate tRNAs and only one cognate tRNA. Eq. (3) is used to calculate the competition measures. The arrival time data are given in Table 1:
Table 2.
Cognate and near-cognate tRNAs, labeled as per Table 1.
| Codon | Cognate | Near-cognate | Codon | Cognate | Near-cognate |
|---|---|---|---|---|---|
| UUU | 28 | 22, 23 | GUU | 44, 45, 46 | |
| UUC | 28 | 9, 22, 23, 36, 42, 43 | GUC | 45, 46 | 2, 8, 15, 44 |
| UUG | 22,23 | 28, 34, 41 | GUG | 44 | 13, 45, 46 |
| UUA | 23 | 22, 28, 32, 33 | GUA | 44 | 1, 12, 14, 45, 46 |
| UCU | 33, 36 | 34 | GCU | 1 | 2 |
| UCC | 36 | 9, 28, 33, 34, 42, 43 | GCC | 2 | 1, 8, 15, 45, 46 |
| UCG | 33 | 22, 36, 41 | GCG | 1 | 2, 13 |
| UCA | 33 | 23, 32, 34, 36 | GCA | 1 | 2, 12, 14, 44 |
| UGU | 9 | 32, 41 | GGU | 15 | 13, 14 |
| UGC | 9 | 28, 32, 36, 41, 42, 43 | GGC | 15 | 2, 8, 13, 14, 45, 46 |
| UGG | 41 | 9, 22, 32, 34 | GGG | 13, 14 | 15 |
| UGA | 32, 48 | 9, 23, 33, 41 | GGA | 14 | 1, 12, 13, 15, 44 |
| UAU | 42, 43 | GAU | 8 | 12 | |
| UAC | 42, 43 | 9, 28, 36 | GAC | 8 | 2, 12, 15, 45, 46 |
| UAG | 47 | 22, 34, 41, 42, 43 | GAG | 12 | 8, 13 |
| UAA | 47, 48 | 23, 32, 33, 42, 43 | GAA | 12 | 1, 8, 14, 44 |
| CUU | 20 | 3, 19, 21 | AUU | 17 | 18, 25, 26, 27 |
| CUC | 20 | 16, 19, 21, 30 | AUC | 17 | 7, 18, 25, 26, 27, 35, 37, 39 |
| CUG | 19, 21 | 4, 11, 20, 29 | AUG | 27 | 6, 17, 18, 25, 26, 38 |
| CUA | 21 | 10, 19, 20, 31 | AUA | 18 | 5, 17, 24, 25, 26, 27, 40 |
| CCU | 30, 31 | 3, 29 | ACU | 37, 39, 40 | 38 |
| CCC | 22 | 16, 20, 29, 31 | ACC | 37, 39 | 7, 17, 35, 38, 40 |
| CCG | 29, 31 | 4, 11, 19, 30 | ACG | 38, 40 | 6, 18, 25, 26, 27, 37, 39 |
| CCA | 31 | 10, 21, 29, 30 | ACA | 40 | 5, 24, 37, 38, 39 |
| CGU | 3 | 4 | AGU | 35 | 5, 6 |
| CGC | 3 | 4, 16, 20, 30 | AGC | 35 | 5, 6, 7, 17, 37, 39 |
| CGG | 4 | 3, 11, 19, 29 | AGG | 6 | 5, 18, 25, 26, 27, 35, 38 |
| CGA | 3 | 4, 10, 21, 31 | AGA | 5 | 6, 24, 35, 40 |
| CAU | 16 | 3, 10, 11 | AAU | 7 | 24 |
| CAC | 16 | 10, 11, 20, 30 | AAC | 7 | 17, 24, 35, 37, 39 |
| CAG | 11 (5.1) | 4, 10, 16, 19, 29 | AAG | 24 (4.9) | 6, 7, 18, 25, 26, 27, 38 |
| CAA | 10 (5.9) | 11, 16, 21, 31 | AAA | 24 (4.9) | 5, 7, 40 |
There is a 7:1 chance that a near-cognate tRNA will enter the A site instead of a cognate tRNA. Every time a near-cognate binds to the A site, the possibility exists that its amino acid may be inserted into the peptide chain and even if the amino acid is not inserted, a delay occurs. Although [UUC] is not considered to be a rare codon, the analysis shows that it will be translated slowly.
The codon [UCU ] has two cognate and one near-cognate tRNAs. The competition measure is:
In this case there is a 6:1 chance that a cognate tRNA will enter the A site instead of a near-cognate tRNA. These statistics are favorable for high accuracy and fast translation.
In Figure 1 the competition vector C̄ is plotted. If the competition by near-cognates is strong, then one expects high error frequencies and slow translation rates, whilst small competition measures indicate more efficient and accurate translation. The top four competitive codons are [GCC]> [CGG]> [AGG]> [GGA]. This order list can be compared to the four codons with rarest cognates [AGG]< [CCA]< [GCC]< [CAC]. There is only partial overlap between the most competitive codons and the rarest codons.
Figure 1.

Competition measures of all 64 codons as calculated by eq. (3a).
In the following section the kinetic expressions for the two major steps of translation, peptidyl transfer and translocation, are derived.
2.3 Reaction rates based on pathway probabilities
Ninio (1987) described an alternative approach to derive kinetic expressions for enzymatic reactions. The principal idea of the Ninio approach is to track a single enzyme/template complex over time and determine its average behavior. The approach is applied to the peptidyl transfer and ribosome translocation reactions to arrive at general, but different, rate expressions for cognates and near-cognates
Peptidyl transfer
The reaction scheme in Figure 2 depicts the steps of peptidyl transfer, beginning with initial binding and codon recognition of the aa-tRNA and continuing until peptidyl transfer. Savelsbergh et al. (2003) and Gromadski and Rodnina (2004) have measured most of the kinetic rate constants for both cognates and near-cognates.
Figure 2.

Kinetic scheme of peptidyl transfer. The different states are labeled A1 through A9.
The initial binding step has similar rate constants for the cognate and near-cognate aa-tRNAs. The codon recognition step has similar forward rate constants for cognate and near-cognate aa-tRNA, but the reverse rate constant is much smaller in the case of the cognate aa-tRNA. If the near-cognate aa-tRNA is rejected, the ribosome returns to the initial “open” state and follows the same process again. The GTPase activation step is irreversible, but it occurs much faster for the cognate aa-tRNA than the near-cognate aa-tRNA. The GTP hydrolysis reaction is followed by an EF-Tu conformational change and an accommodation reaction. The aa-tRNA and GDP could be released during the accommodation step, which is considered a proofreading step. If rejection has not occurred, the peptidyl transfer step follows.
The different states of the reaction are labeled A1 through A9. Let Pij and tij be the probability and the time, respectively, to move from state Ai to state Aj. The average passage time T14 to go from A1 to A4 accounts for idling between states A2 and A3:
| (4) |
The exit time from a state is the inverse of the sum of rates out of the state. For example: . The probability to go from state A2 to state A3 is . Thus it is possible to express equation (4) in terms of rate constants, but it becomes a cumbersome expression. If a ribosome moves from state A2 to state A3 and back to state A2, then it has completed a loop. The remaining steps (GTP hydrolysis through peptidyl transfer) are completed without reversal, but the entire process may incorporate any number of loops. The average time to move from state A4 to state A5 is
Likewise, , and .
The probability of failure to bind is . Therefore the probability of progressing to state A4 on one attempt is 1 − q. The probability PS of a successful progression through both the initial binding and proofreading steps is
| (5) |
The successful passage time for the peptidyl transfer reaction is:
and the inverse of the successful passage time is the peptidyl transfer rate:
| (6) |
If the rate constants in Table 3 are used, the average time for peptidyl transfer of an amino acid of a cognate aa-tRNA is ~ 3ms. However, this time does not account for translocation.
Table 3.
Rate constants for peptidyl transfer, at 20°C.
| Rate constant | k1μM−1s−1 | k−1s−1 | k2s−1 | k−2s−1 | k3s−1 | kGTPs−1 | k4s−1 | k5s−1 | k7s−1 | kpeps−1 |
|---|---|---|---|---|---|---|---|---|---|---|
| Cognate | 140 | 85 | 190 | 0.23 | 260 | 1,000 | 1,000 | 1,000 | 60 | 200 |
| Near-cognate | 140 | 85 | 190 | 80 | 0.4 | 1,000 | 1,000 | 60 | 1,000 | 200 |
Translocation
The steps which involve translocation are shown in Figure 3. The states are labeled A8 through A17. T8,10 has a similar form to the expressions for T45 through T78, i.e.:
Figure 3.

Steps in the translocation of the ribosome. States are labeled A8 through A18.
At state A10 the reverse reaction to state A8 may occur. Thus the average time T10,11 may be written as:
where τ = t10,8 + t8,10 is the delay due to the reversible reaction between A10 and A8. The final form is:
The passage time from state A11 to state A12 is
At state A12 the tRNA movement and Pi release occur interchangeably. These two parallel pathways are denoted as states A13a and A13b in Figure 3. The time required to move into either intermediate state is , yielding an average time of
The average time to advance from the intermediate state to A14, then, is
The average times for the remaining steps (T14,15 through T17,18 ) have the familiar form
The total average time for peptidyl insertion and translocation is simply the sum of the average times of each step:
| (7) |
Overall rate
Eqns. (5) and (7) are used to obtain the combined rates of peptidyl transfer and translocation:
| (8) |
2.4 Application of the model
The transport of species to the ribosome, the competition between the different species and the kinetics form part of the overall translation model. The model is applied as follows:
Calculation of misreading frequencies
Choose the codon for which misreading frequencies must be calculated. Select the cognate, near-cognate and non-cognate sets for this codon (cf. Table 2).
Select the species that attempts to bind. A random number between 0 and 1 is compared to an arrangement of molar fractions of all aa-tRNAs between 0 and 1; the interval that contains the random number determines the species that is selected.
If the species belongs to the cognate or near-cognate sets, choose the kinetic parameters accordingly; otherwise add 0.5ms to the total time and return to step 2.
Advance from state A1 and update the time. At each state which has multiple exits, a value from a random number set determines which exit is selected and the transition time to the next state is added to the total time.
If an exit is selected that returns the aa-tRNA complex to its free state, return to step 2, with the provision that further attempts add to the current time.
If a near-cognate selected species advances to state A18, its appropriate amino acid is tabulated. Some near-cognates have the same amino acid as the cognate aa-tRNA in which case no misreading would be noted. In most cases of successful translation by a near-cognate aa-tRNA an incorrect amino acid is added to the nascent polypeptide chain. The total insertion time is recorded.
If a cognate species reaches state A18, the amino acid and total insertion time are recorded.
Steps 2 – 7 are repeated until averages stabilize. We have typically performed 105 – 106 Monte Carlo experiments.
Calculation of mRNA translation
Consider the translation of the ith codon.
Advance the time with the average insertion time listed in Table 5.
Record the misreading frequency of the ith codon, as per Table 5.
Advance to the next codon.
Table 5.
Average insertion times, insertion attempts by non-cognates, insertion attempts by near-cognates and error frequencies for all codons, evaluated at 37°C.
| Codon | Label | Error frequency (× 10−4) | Average insertion time (ms) | Average non-cognate insertion attempts | Average near-cognate insertion attempts |
|---|---|---|---|---|---|
| UUU | 1 | 25 | 136 | 166.93 | 4.15 |
| UUC | 2 | 67 | 195 | 159.24 | 10.11 |
| UUG | 3 | 7 | 50 | 57.47 | 1.12 |
| UUA | 4 | 38 | 157 | 164.72 | 6.22 |
| UCU | 5 | 1 | 55 | 86.25 | 0.24 |
| UCC | 6 | 68 | 246 | 222.92 | 11.92 |
| UCG | 7 | 20 | 96 | 106.01 | 3.23 |
| UCA | 8 | 16 | 106 | 137.39 | 2.69 |
| UGU | 9 | 7 | 75 | 110.21 | 1.05 |
| UGC | 10 | 24 | 109 | 106.44 | 4.50 |
| UGG | 11 | 37 | 168 | 184.61 | 6.35 |
| UGA | 12 | 1 | 12 | 2.416 | 0.16 |
| UAU | 13 | 0 | 53 | 87.61 | 0 |
| UAC | 14 | 16 | 77 | 85.47 | 2.44 |
| UAG | 15 | 4 | 19 | 10.09 | 0.50 |
| UAA | 16 | 1 | 11 | 1.46 | 0.11 |
| CUU | 17 | 100 | 260 | 174.71 | 15.61 |
| CUC | 18 | 64 | 204 | 180.04 | 10.00 |
| CUG | 19 | 5 | 35 | 32.50 | 0.95 |
| CUA | 20 | 90 | 286 | 250.41 | 14.47 |
| CCU | 21 | 39 | 143 | 130.55 | 6.55 |
| CCC | 22 | 39 | 197 | 245.56 | 6.21 |
| CCG | 23 | 41 | 134 | 113.35 | 6.54 |
| CCA | 24 | 46 | 237 | 298.40 | 7.52 |
| CGU | 25 | 1 | 28 | 34.31 | 0.18 |
| CGC | 26 | 4 | 35 | 33.86 | 0.85 |
| CGG | 27 | 147 | 397 | 250.94 | 25.06 |
| CGA | 28 | 5 | 34 | 33.98 | 0.77 |
| CAU | 29 | 92 | 296 | 262.75 | 14.85 |
| CAC | 30 | 48 | 222 | 270.84 | 7.37 |
| CAG | 31 | 83 | 231 | 190.00 | 12.15 |
| CAA | 32 | 36 | 179 | 229.44 | 5.25 |
| GUU | 33 | 0 | 26 | 34.74 | 0 |
| GUC | 34 | 75 | 208 | 128.78 | 12.85 |
| GUG | 35 | 5 | 42 | 45.94 | 0.91 |
| GUA | 36 | 27 | 73 | 42.528 | 4.05 |
| GCU | 37 | 3 | 39 | 54.52 | 0.28 |
| GCC | 38 | 163 | 415 | 261.61 | 26.24 |
| GCG | 39 | 6 | 44 | 54.07 | 0.76 |
| GCA | 40 | 28 | 83 | 50.02 | 4.69 |
| GGU | 41 | 3 | 35 | 37.94 | 0.69 |
| GGC | 42 | 12 | 49 | 36.70 | 2.06 |
| GGG | 43 | 19 | 81 | 79.54 | 3.03 |
| GGA | 44 | 147 | 324 | 141.67 | 23.36 |
| GAU | 45 | 19 | 77 | 71.92 | 3.07 |
| GAC | 46 | 40 | 116 | 68.03 | 6.97 |
| GAG | 47 | 7 | 36 | 33.81 | 1.00 |
| GAA | 48 | 21 | 57 | 31.79 | 3.02 |
| AUU | 49 | 23 | 97 | 98.90 | 3.63 |
| AUC | 50 | 42 | 128 | 95.55 | 6.76 |
| AUG | 51 | 80 | 266 | 240.81 | 12.98 |
| AUA | 52 | 48 | 128 | 95.95 | 6.75 |
| ACU | 53 | 2 | 55 | 83.62 | 0.37 |
| ACC | 54 | 43 | 153 | 141.75 | 6.94 |
| ACG | 55 | 34 | 129 | 115.91 | 5.90 |
| ACA | 56 | 45 | 178 | 187.73 | 7.17 |
| AGU | 57 | 7 | 85 | 125.24 | 1.31 |
| AGC | 58 | 34 | 127 | 120.39 | 5.50 |
| AGG | 59 | 151 | 461 | 396.17 | 24.24 |
| AGA | 60 | 48 | 190 | 198.37 | 7.81 |
| AAU | 61 | 15 | 109 | 149.22 | 2.40 |
| AAC | 62 | 50 | 161 | 143.34 | 7.69 |
| AAG | 63 | 29 | 102 | 85.48 | 4.78 |
| AAA | 64 | 14 | 76 | 88.20 | 2.18 |
3. Results and Discussion
If the rate constants for a cognate aa-tRNA, as listed in Tables 3 and 4 (note that the temperature is 20°C), are used in eq. (8), then the average time to add an amino acid to the nascent polypeptide chain is 40ms, or 25 amino acids per second, but this rate excludes any competition. Eq. (8) also applies to the translation rate of near-cognate aa-tRNAs, but the concept of average translation rate becomes meaningless in this case. To be specific, the average rate of amino acid insertion from near-cognate aa-tRNAs is v = 0.013 s−1. Instead, it is important to know the delay time which is caused by the binding of a near-cognate. The delay time is calculated by tracking a bound near-cognate along the reaction pathway, given in Figures 2 and 3. At each state (i.e. A1 to A18) which has multiple exits, a value from a random number set determines which exit is selected and the transition time to the next state is added to the total time. If this calculated is repeated many times, one determines the average value. The average delay time (which has absolutely no relation to the inverse of the rate v) is 46.3ms at 20°C. Varenne et al. (1984) listed synthesis rates of a number of different proteins in E. coli at 24.5°C and 37°C. The average rates at 24.5°C and 37°C are 4.4 amino acids/s and 12.9 amino acids/s respectively. If we assume that the activation energies for the various reactions do not vary much (information about activation energy is not available), the activation energy is estimated as:
The average delay due to the binding of near-cognates at 37° C is 46.3ms × e−E/R[1/293−1/310] = 10.48ms. The average time to insert an amino acid from a cognate aa-tRNA at 37°C is 9.06ms. There is also a time delay due to the binding attempt by a non-cognate aa-tRNA. The results of Wahab et al. (1993) clearly show the delay action that non-cognates impose on the translation process. We have estimated this delay to be 0.5 ms at 37°C. The following equation gives the translation time of the ith codon at 37°C:
| (9) |
The factor of 1.45 in eq. (9) is a consequence of the very first step of peptidyl transfer. In the first step the ribosome accepts an aa-tRNA, cognate or near-cognate, with a probability of . It requires attempts by a cognate aa-tRNA before acceptance; thus the associated number of near-cognate and non-cognate attempts also increases by 1.45.
The average insertion times and error frequencies of all 64 codons are listed in Table 5. In addition, the average number of attempts by non-cognate and near-cognate aa-tRNAs is also reported. The values in Table 5 have been calculated as described in section 2.4. Consider the codon [UUC], which has an average translation time of 195ms (Table 5, label 2). The average number of attempts by near-cognates before insertion of an amino acid (correct or wrong) is 10.11; the number of attempts by non-cognates is 159.24. The near-cognate attempts have caused a time delay of10.11×10.48 = 105.95ms, the non-cognate attempts add a further delay of159.24 × 0.5 = 79.62ms. In contrast, the codon [UCU ] has an average translation time of 55ms, since the attempts by near-cognates and non-cognates have caused delays of only 0.24 ×10.48 + 86.25 × 0.5 = 45.64ms. These results underscore the linear relation that exists between the competition measures and the average insertion time. The translation rates of individual codons vary widely; note that within the set of codons that code for arginine, the insertion rates vary from 29 amino acids/s to 2.2 amino acids/s.
Table 5 is useful to calculate the translation of genes of E. coli, following the method described in section 2.4. The genes rpsU and rpoD flank the dnaG gene on the 5′ and 3′ sides. All three genes belong to a single macromolecular synthesis operon. Konigsberg and Godson (1983) did amino acid sequences of the genes and found that the dnaG primase gene uses an unusually large number of rare codons. Typically the codons [AUA], [UCG], [CCC], [ACG], [CAA], [AAU] and [AGG] appear only 4% in the zero reading frame and 11% and 10% in the non-reading frames. In the case of dnaG, these rare codons appear 11% in the zero reading frame and 12% in the non-reading frames. Konigsberg and Godson suggested that translational modulation using iso-accepting tRNA availability may be part of the mechanism to keep dnaG gene expression low. In Figure 4 the translation time and accumulated errors of the rpsU gene are plotted with respect to codon position. There are 72 codons and the average translation rate is 13.3 amino acids/s. The accumulated error of 13% implies that 87 out of every 100 rpsU proteins will be error-free. The results for the dnaG gene are shown in Figure 5. There are 582 codons in the dnaG gene and the average translation rate lowers to 8.2 amino acids/s. The probability to synthesize an error-free protein is Π[1−E(i) ], where E(i) is the probability for a misreading error in the ith codon (cf. Table 5). There is a 14% chance to synthesize an error-free dnaG protein. That does not mean that only 14% of all proteins are functional, since not all errors lead to misfolded or non-functional proteins. If it is assumed that the part of the insertion timeτ(i) that consists of binding attempts by non-cognates, i.e. τ(i)idle = 0.5R(i) ×1.45, is directly proportional to the time the A site of the ribosome is idle, then we conjecture that the frameshifting probability at the ith codon would be proportional to τ(i)idle
Figure 4.

Translation time and accumulated errors during the translation of the rpsU gene.
Figure 5.
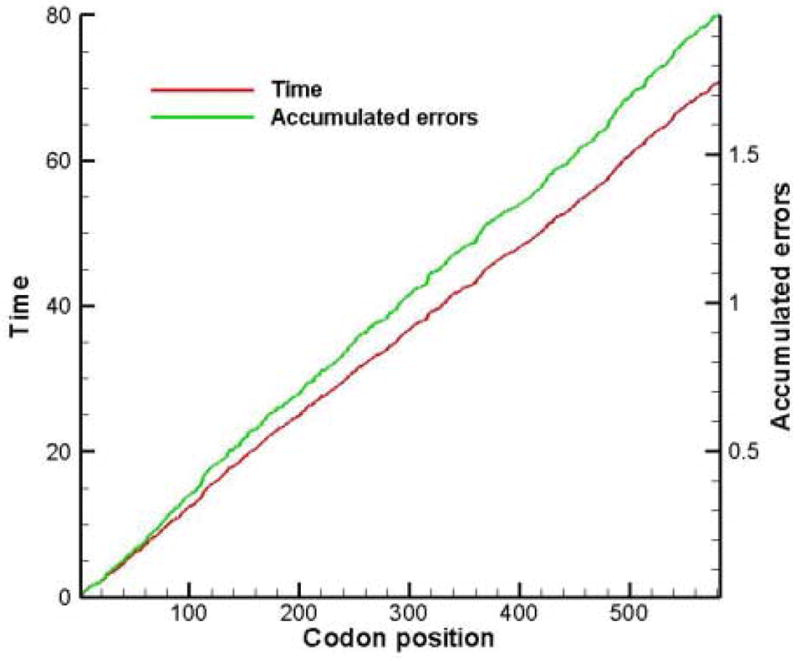
Translation time and accumulated errors during the translation of the rpsU gene.
The prfB gene of E. coli codes for release factor 2 (RF2). The protein is made under autogeneous control. Initiation takes place as usual at an AUG codon when a ribosome binds an mRNA molecule. Refer to the reading frame of the initiation codon as the zero reading frame – 0RF. This is a very short frame which terminates in a UGA stop codon at position 26. There is a second reading frame, shifted one position in the 3′ direction, which we will refer to as the +1RF. This second reading frame is 341 codons long, starts after position 26, terminates in another UGA codon, and contains the sequence for the rest of the RF2 protein. The ribosome must do a frameshift at position 26 in order to synthesize RF2 successfully. If little RF2 is available, the idling time is expected to increase and the probability to frameshift increases. In Figure 6 the idling times during the translation of the prfB gene are shown for the first 26 positions. The idling time at the 26th codon will increase if the availability of RF2 is reduced. However, an interesting result is the long pause four codon positions upstream from the programmed shift; it is the codon [AGG]that causes the advance delay.
Figure 6.
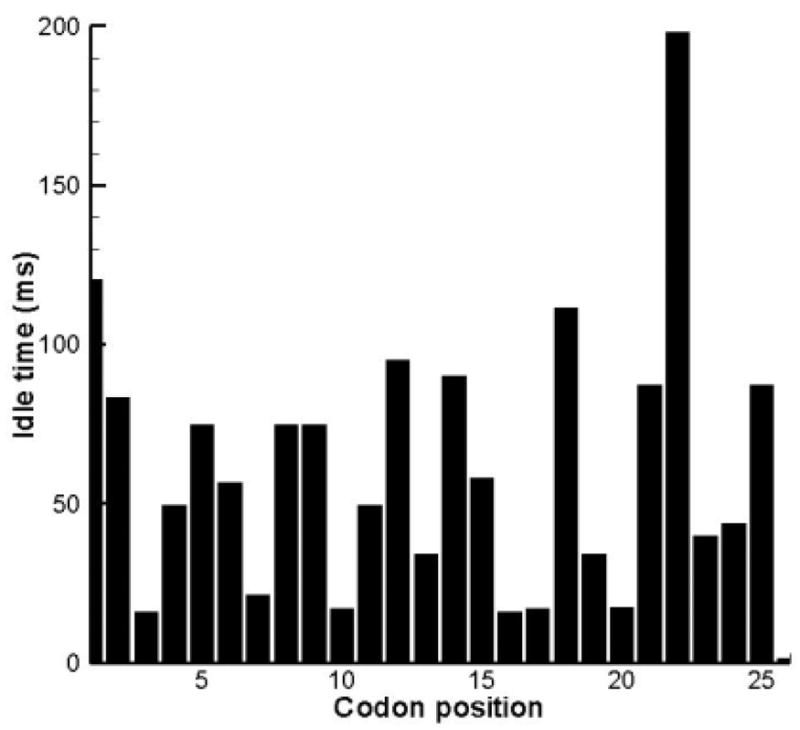
Idling times (ms) during the translation of the prfB gene; only the first 26 codons are shown.
The mathematical model provides strong evidence that codons with high competition measures are translated slower and they are prone to more misreading errors. The probability to insert an incorrect amino acid into the nascent peptide chain is directly proportional to the number of binding attempts by near-cognates. Eq. (10) describes the relation between misreading error frequency and competition by near-cognates:
| (10) |
Since there is a widely held belief that codons with rare iso-acceptors are also translated slower, it is instructive to compare the codons according to their near-cognate competition, availability and error frequencies. In Figure 7 the codons are ranked in increasing order of competition on the abscissa. On the ordinate the decreasing rank order of availability and increasing rank order of error are plotted. The correlation between misreading errors and competition is much stronger than between the availability of tRNA and the near-cognate competition. One concludes from the results in Figure 7 that codons with fewer iso-acceptors do not necessarily have longer translation times. However, the model shows that codons with higher competition measures usually correspond to higher frequencies of misreading errors and longer translation times.
Bonekamp et al. (1989) measured the relative rates of translation of 12 different codons. Their major conclusions are given below; our comments are added in italics:
Different codons are translated at different rates – this is consistent with our results.
Codons served by minor tRNA species, such as [UGU]and [AUA], are translated as rapidly as the abundant codons [CGU ], [AUU ]and [AUC] – juxtapose [UGU] and [CGU ]; our model predicts translation times of 75ms and 28ms. If we juxtapose [AUA] with [AUU ]and [AUC], then the translation times are 128ms vs. 97ms and 128ms.
The [CAU]codon of histidine is not avoided in highly expressed mRNAs; although it is served by an iso-acceptor of moderate concentration, it is translated as slowly as the minor tRNA codon [CUA] – the translation times according to the model (cf. Table 5) are 296ms (for [CAU]) and 286ms (for [CUA]), which are consistent with their finding.
For some synonymous codons the translation rates agree with tRNA abundances; [CGU ]and [AGG]belong to the arginine group, respectively have high and low tRNA availability and corresponding fast and slow translation rates, but there are exceptions as in the case of isoleucine. The two major codons [AUU ]and [AUC] are translated as fast as the minor codon [AUA] – according to our model, the translation times of [CGU ]and [AGG]are 28ms and 461ms; the two major codons of isoleucine [AUU ]and [AUC]have translation times of 97ms and128ms, and the translation time of the minor codon is 128ms.
Codon synonyms which use the same iso-accepting tRNA species, such as the histidine codons [CAU]and [CAC], or the cysteine codons [UGU]and [UGC], deviate in their translation times as much as synonymous codons which are served by different tRNAs of entirely different amounts – the model predicts translation times for the histidine codons [CAU]and [CAC]of 296ms and 222ms, which is a notable difference given the fact that they use the same tRNA iso-acceptor. In the case of cysteine the difference in the translation times is 75ms and 109ms for [UGU]and [UGC]respectively.
Kramer and Farabaugh (2007) did a detailed study to measure the frequency of misreading codons by . They mutated an essential Lys529 in the active site of firefly luciferase and measured changes in activity. Their premise is that activity is directly related to the misreading of the mutant at position 529 by . In Table 1 of Kramer and Farabaugh (2007), the three codons which are misread with the highest frequency by are AGA, AGG and AAU. The experimentally measured misreading frequencies are 36 ×10−4, 31×10−4 and 16 ×10−4 respectively. Since our model has the capability to calculate misreading frequencies, the theoretical frequencies with which the codons [AGA], [AGG] and [AAU ] have been misread by are 20×10−4, 37×10−4 and14×10−4. As Kramer and Farabaugh pointed out, the error rates in E. coli vary widely, but the experimental and theoretical values are quite similar. This comparison raises another question: what effect does temperature have on misreading frequencies? If the activation energies of the forward and reverse reactions were known, this question could be answered.
4. Conclusions
The following ten major conclusions follow from the analysis and the results of the mathematical modeling:
The arrival frequencies of tRNA species at a ribosome A site have been calculated on the basis of transport by diffusion.
The competition measure C(i) of the ith codon is the quotient of the arrival frequencies of its near-cognates and the arrival frequencies of its cognates.
An overall kinetic expression for translation has been derived and it includes the steps of peptidyl transfer and ribosome translocation.
There is a linear relationship between the average translation time of the ith codon and its competition measure: τ (i) = 9.06 + 1.445[10.48C(i) + 0.5R(i)]
Codons with high competition measures have high frequencies of misreading errors. The relation is given by: E(i) = 0.0009C(i).
The correlation between tRNA availability and translation time is not perfect. Codons which are served by minor tRNA species such as [UGU] can be translated as fast as codons which are served by abundant codons such as [CUG].
The average time to insert an amino acid from a cognate aa-tRNA is 9.06ms. The result is based on the kinetic parameters of Gromadski and Rodnina (2004), which have been measured at 20°C and adjusted to 37°C.
The average delay that is caused by the binding of a near-cognate aa-tRNA is 10.48ms.
There is great variability in the rates of translation. Rates vary between 2.2 amino acids/s and 29 amino acids/s within the same set of synonymous codons.
Codon optimization for recombinant DNA expression is not only the process to use the most abundant synonymous codons. A linear application of our theory suggests that synonymous codons be selected with minimum competition measure. If the objective is not to minimize the translation time, but to produce as many functional proteins as possible, one begins to question the role of codons with slow translation rates (i.e. high competition measures). If their role is primarily to slow down the translation process to allow time for a nascent polypeptide chain to fold, before the next domain is synthesized, then any substitution by codons with faster translation rates compromises the folding process. If this argument is correct, then it is unfortunately not possible to decouple the codon optimization from the protein folding process. However, it is conjectured (cf. Thadaraj and Argos (1996)) that one role of slow-translating codons is to allow time for an orderly, sequential folding of multi-domain proteins.
Acknowledgments
The authors are grateful for financial support by the National Institutes of Health.
Footnotes
Publisher's Disclaimer: This is a PDF file of an unedited manuscript that has been accepted for publication. As a service to our customers we are providing this early version of the manuscript. The manuscript will undergo copyediting, typesetting, and review of the resulting proof before it is published in its final citable form. Please note that during the production process errors may be discovered which could affect the content, and all legal disclaimers that apply to the journal pertain.
References
- Bonekamp F, Dalboge H, Christensen T, Jensen KF. Translation rates of individual codons are not correlated with tRNA abundances or with frequencies of utilization in Escherichia coli. J Bacteriol. 1989;171:5812–5816. doi: 10.1128/jb.171.11.5812-5816.1989. [DOI] [PMC free article] [PubMed] [Google Scholar]
- Dong H, Nilsson L, Kurland CG. Co-variation of tRNA abundance and codon usage in Escherichia coli at different growth rates. J Mol Biol. 1996;260:649–663. doi: 10.1006/jmbi.1996.0428. [DOI] [PubMed] [Google Scholar]
- Elowitz MB, Surette MG, Wolf P-E, Stock JB, Leibler S. Protein Mobility in the Cytoplasm of Escherichia coli. J Bacteriol. 1999;181:197–203. doi: 10.1128/jb.181.1.197-203.1999. [DOI] [PMC free article] [PubMed] [Google Scholar]
- Farabaugh PJ. Programmed Alternative Reading of the Genetic Code. Springer-Verlag; Heidelberg, Germany: 1997. [Google Scholar]
- Gilchrist MA, Wagner A. A model of protein translation including codon bias, nonsense errors, and ribosome recycling. J Theor Biol. 2006;239:417–434. doi: 10.1016/j.jtbi.2005.08.007. [DOI] [PubMed] [Google Scholar]
- Gromadski KB, Rodnina MV. Kinetic Determinants of High-Fidelity tRNA Discrimination on the Ribosome. Mol Cell. 2004;13:191–200. doi: 10.1016/s1097-2765(04)00005-x. [DOI] [PubMed] [Google Scholar]
- Heyd AW, Drew DA. A Mathematical Model for Elongation of a Peptide Chain. Bull Math Biol. 2003;65:1095–1109. doi: 10.1016/S0092-8240(03)00076-4. [DOI] [PubMed] [Google Scholar]
- Konigsberg W, Godson N. Evidence for use of rare codons in the dnaG gene and other regulatory genes of Escherichia coli. Proc Nat Acad Sci USA. 1983;80:687–691. doi: 10.1073/pnas.80.3.687. [DOI] [PMC free article] [PubMed] [Google Scholar]
- Koontz SW. Control of RNA and Protein Synthesis by the Concentration of Trp-tRNATrp in Escherichia coli Infected with Bacteriophage MS2. J Mol Biol. 1983;168:747–763. doi: 10.1016/s0022-2836(83)80073-4. [DOI] [PubMed] [Google Scholar]
- Kramer EB, Farabaugh PJ. The frequency of translational misreading errors in E. coli is largely determined by tRNA competition. RNA. 2007;13:87–96. doi: 10.1261/rna.294907. [DOI] [PMC free article] [PubMed] [Google Scholar]
- Kremling A. Comment on Mathematical Models Which Describe Transcription and Calculate the Relationship Between mRNA and Protein Expression Ratio. Biotech and Bioeng. 2006;96:815–819. doi: 10.1002/bit.21065. [DOI] [PubMed] [Google Scholar]
- Neidhardt FC, et al. Cellular and Molecular Biology. Vol. 1. American Society for Microbiology; 1987. Escherichia coli and Salmonella typhimurium. [Google Scholar]
- Ninio J. Alternative to the steady-state method: derivation of reaction rates from first-passage times and pathway probabilities. Proc Natl Acad Sci USA. 1987;84:663–7. doi: 10.1073/pnas.84.3.663. [DOI] [PMC free article] [PubMed] [Google Scholar]
- Nissen P, Thirup S, Kjeldgaard M, Nyborg J. The crystal structure of Cys-tRNACys-EF-Tu-GDPNP reveals general and specific features in the ternary complex and in tRNA. Structure Fold Des. 1999;7:143–156. doi: 10.1016/s0969-2126(99)80021-5. [DOI] [PubMed] [Google Scholar]
- Rosenberg AH, Goldman E, Dunn JJ, Studier FW, Zubay G. Effects of Consecutive AGG Codons on Translation in Escherichia coli, Demonstrated with a Versatile Codon Test System. J Bacteriol. 1993;175:716–722. doi: 10.1128/jb.175.3.716-722.1993. [DOI] [PMC free article] [PubMed] [Google Scholar]
- Savelsbergh A, Katunin V, Mohr D, Peske F, Rodnina M, Wintermeyer W. An Elongation Factor G-Induced Ribosome Rearrangement Precedes tRNA-mRNA Translocation. Mol Cell. 2003;11:1517–1523. doi: 10.1016/s1097-2765(03)00230-2. [DOI] [PubMed] [Google Scholar]
- Sipley J, Goldman E. Increased ribosomal accuracy increases a programmed translational frameshift in Escherichia coli. Proc Natl Acad Sci USA. 1993;90:2315–2319. doi: 10.1073/pnas.90.6.2315. [DOI] [PMC free article] [PubMed] [Google Scholar]
- Sorensen MA, Kurland CG, Pedersen S. Codon Usage Determines translation Rate in Escherichia coli. J Mol Biol. 1989;207:365–377. doi: 10.1016/0022-2836(89)90260-x. [DOI] [PubMed] [Google Scholar]
- Thanaraj TA, Argos P. Ribosome-mediated translational pause and protein domain organization. Protein Sci. 1996;5:1594–1612. doi: 10.1002/pro.5560050814. [DOI] [PMC free article] [PubMed] [Google Scholar]
- Varenne S, et al. Translation in a Non-uniform Process: Effect of tRNA Availability on the Rate of Elongation of Nascent Polypeptide Chains. J Mol Biol. 1984;180:549–576. doi: 10.1016/0022-2836(84)90027-5. [DOI] [PubMed] [Google Scholar]
- Wahab SZ, Rowley KO, Holmes WM. Effects of tRNA1Leu overproduction in Escherichia coli. Mol Microbiol. 1993;7:253–263. doi: 10.1111/j.1365-2958.1993.tb01116.x. [DOI] [PubMed] [Google Scholar]
- Zouridis H, Hatzimanikatis V. A model for protein translation: polysome self-organization leads to maximum synthesis rates. Biophysical J. 2007;92:717–730. doi: 10.1529/biophysj.106.087825. [DOI] [PMC free article] [PubMed] [Google Scholar]