

Abstract
The Hsp100/ClpB heat shock protein family is ancient and required for high temperature survival, but natural variation in expression and its phenotypic effects is unexplored in plants. In controlled environment experiments, we examined the effects of variation in the Arabidopsis cytosolic AtHsp101 (hereafter Hsp101). Ten wild-collected ecotypes differed in Hsp101 expression responses across a 22 to 40 °C gradient. Genotypes from low latitudes expressed the least Hsp101. We tested fitness and pleiotropic consequences of varying Hsp101 expression in ‘control’ vs. mild thermal stress treatments (15/25 °C D/N vs. 15/25° D/N plus 3 h at 35 °C 3 days/week). Comparing wild type and null mutants, wt Columbia (Col) produced ~33% more fruits compared to its Hsp101 homozygous null mutant. There was no difference between Landsberg erecta null mutant NIL (Ler) and wt Ler; wt Ler showed very low Hsp101 expression. In an assay of six genotypes, fecundity was a saturating function of Hsp101 content, in both experimental treatments. Thus, in addition to its essential role in acquired thermal tolerance, Hsp101 provides a substantial fitness benefit under normal growth conditions. Knocking out Hsp101 decreased fruit production, days to germination and days to bolting, total dry mass, and number of inflorescences; it increased transpiration rate and allocation to root mass. Root : total mass ratio decayed exponentially with Hsp101 content. This study shows that Hsp101 expression is evolvable in natural populations. Our results further suggest that Hsp101 is primarily an emergency high-temperature tolerance mechanism, since expression levels are lower in low-latitude populations from warmer climates. Hsp101 expression appears to carry an important trade-off in reduced root growth. This trade-off may select for suppressed expression under chronically high temperatures.
Keywords: Arabidopsis thaliana, fitness, heat shock, Hsp101, pleiotropy, root growth
Introduction
As the climate warms, mechanisms of thermal tolerance will become increasingly important for both crop and wild plants. Lobel & Asner (2003) demonstrate a 17% yield decline for each 1 °C growing season temperature increase for both corn and soybean, compared to historical long-term averages in North America. In natural populations, models of habitat shifts expected to accompany temperature increases suggest that the rate of movement of suitable habitat can exceed the maximum dispersal rate of many species (Malcolm et al. 2002, but see also Pearson & Dawson 2003). For many species of plants, adapting to higher temperatures rather than moving with shifting climate zones may be the only alternative to extirpation.
Heat shock proteins (HSPs), so named because their transcription is up-regulated upon exposure to elevated temperatures, are prime candidates for targets of selection as plants experience increasingly frequent episodes of stress-inducing high temperatures. In this study, we examine genetic variation in HSP expression, its fitness consequences and its pleiotropic effects in Arabidopsis thaliana, a species that grows in environments that are thermally moderate during its growing season (Hoffmann 2002). Our investigation of the functional significance of HSPs and the evolvability of HSP expression in this model organism is intended to provide insight for both crop breeders and those interested in the evolutionary ecology of natural populations in changing environments.
In response to high temperature, plants rapidly produce proteins belonging to five HSP families: Hsp100/ClpB (eukaryotic/Escherichia coli nomenclature), Hsp90, Hsp70/DnaK, Hsp60/GroEL and small HSPs. HSPs are proposed to act primarily as molecular chaperones, refolding misfolded proteins and/or preventing accumulation and/or aggregation of nonfunctional proteins in stressed cells.
Despite their up-regulation in response to elevated temperature, no direct role in survival at high temperature has been demonstrated for most HSPs. This may result in part from genetic redundancy and consequent limits on the utility of reverse genetics for elucidating gene function. The apparently essential nature of HSP function even in nonstressful environments can further complicate the description of function, since complete gene knockouts may be lethal. For three of the four large HSP families, this is the case. Fourteen Hsp70 genes have been identified in A. thaliana. It has proven difficult to alter expression levels and maintain viability (see Larkindale et al. 2005). Hsp90, found in four cytosolic copies, is up-regulated in response to heat, but no direct role in acquired thermal tolerance has been demonstrated (Larkindale et al. 2005). A null mutant of the chloroplast Hsp60β does show increased heat sensitivity, although expression does not appear to be heat induced (Ishikawa et al. 2003).
Here, we focus on the best-studied HSP in plants, AtHsp101 (ClpB1, At1g73410; hereafter Hsp101). This HSP, a member of the Hsp100/ClpB family of proteins, is thought to be involved in disaggregation of misfolded proteins and their hand-off for either refolding by Hsp90 or Hsp70, or degradation (Wang et al. 2004). Three additional ClpB proteins have been identified in A. thaliana: ClpB2 – ClpB4. ClpB2 has recently been re-annotated as encoding a 68.8-kDa protein. There is no evidence of expression of a ClpB-sized mRNA or protein from this locus (Lee et al. 2007). ClpB3 is localized in chloroplasts, while ClpB4 is associated with mitochondria (Rottgers et al. 2002; Lee et al. 2007). Thus Hsp101/ClpB1 is the only cytosolic ClpB in Arabidopsis. ClpB3 and ClpB4 apparently diverged from Hsp101 early in the evolution of life, since their gene sequences are derived from cyanobacterial ClpBs in an ancient split from the lineage leading to Arabidopsis Hsp101, and there appears to have been substantial divergence in function as well (Lee et al. 2007). Indeed, genetic analysis has shown that Hsp101 is absolutely essential for thermal tolerance in both Arabidopsis and maize (Hong & Vierling 2000; Queitsch et al. 2000; Nieto-Sotelo et al. 2002), while ClpB3 and ClpB4 null mutants are indistinguishable from wild type in their ability to acquire thermal tolerance.
Under optimal growth conditions, Hsp101 is present in vegetative tissues in such low-copy number that it is difficult to detect by standard biochemical technique. However, increased Hsp101 transcript and protein production begins essentially instantaneously on exposure of plants to temperatures 5–10 °C above optimal growth temperature and increases dramatically in heat-stressed plants (30 °C and above in Arabidopsis) (Hong et al. 2001; Young et al. 2001). Expression levels increase with the degree of thermal stress until lethal temperatures are reached (Chen et al. 1990). Hsp101 protein expression therefore acts as a virtual thermometer. Hong et al. (2001) show that a Hsp101 null mutant lacks thermal tolerance, but is visually normal under standard (non-heat-stressed) growth conditions. Quantitative analysis of growth and reproductive output were not performed.
Together, the rapid response of Hsp101 to temperature changes and its absolute requirement for survival in extreme heat stress suggest that Hsp101 will be an essential component of plant adaptation to thermal stress in future climates. Across all population studies of HSPs in animals, the evidence suggests that the HSP expression response to thermal stress evolves in natural populations (Krebs & Loeschke 1995; Otsuka et al. 1997; McColl & McKechnie 1999; Bettencourt et al. 2002; Frydenberg et al. 2003). However, the evolutionary responses in animals are not simple and suggest that there are both costs and benefits to HSP expression. These include effects on longevity and fecundity that result in the evolution of reduced HSP induction in populations that experience chronic thermal stress (reviewed in Sørensen et al. 2003). We know almost nothing about HSP adaptation in plants.
Whether or not Hsp101 contributes to an adaptive response to increased thermal stress clearly depends on how Hsp101 expression influences fitness. In addition, we need to know that Hsp101 expression is evolvable. Evolvability has been defined as the ability to acquire and maintain new, potentially adaptive phenotypes through genetic change (after Wagner 2005 and Hansen 2006). The conventional approach to assessing evolvability has been to measure heritability within populations, defined as the ratio of additive genetic variance to total genetic variance (Fisher 1930). However, heritability measures often depend strongly on environmental conditions, and response to selection depends on an interaction between the complexities of genetic effects (additive vs. interactive) and mating structure (Whitlock et al. 1995). In addition, genetic correlations between traits, caused by pleiotropy and linkage, can constrain or eliminate adaptive response despite high heritabilities (Roff 1997), and their values can change nonproportionally with selection (Roff & Mousseau 1999). Finally, the standing genetic variation underlying heritabilities may not be qualitatively similar to the variation that underlies adaptive evolution, consisting hypothetically of mildly deleterious mutations in mutation–selection balance that contribute little to adaptive evolution (Barton & Keightly 2002). Indeed, Nordborg et al. (2005) showed that much of the observed DNA sequence polymorphism in A. thaliana is best explained in this way. Therefore, we suggest assessing evolvability by examining extant genetic variation among populations. This approach is of particular value when a cline or contrast in environmental factors is of interest as an agent of natural selection across the geographical areas sampled. Used in this way, variation among populations quantifies a sort of realized evolvability. Furthermore, it tells us how much the evolvability, together with selection and drift, has been capable of producing genetic differentiation among populations, taking into account both the availability of mutationally derived trait variation and any negative pleiotropic constraints on its evolution. In this study, we assess evolvability of Hsp101 expression by comparing a set of wild-collected genotypes of A. thaliana from contrasting portions of the species’ range.
In plants, despite considerable progress at the biochemical and genetic levels, we know little about naturally occurring variation in HSP or any resulting phenotypic or fitness effects in any species. Barua & Heckathorn (2006) demonstrate an interaction between light and temperature in field Hsp70 induction responses in Solidago altissima (Asteraceae). Manitasevic et al. (2007) quantify Hsp70 and Hsp90 expression variation in response to season and habitat in Iris pumila (Iridaceae). Knight & Ackerly (2003) provide the only published support that HSP expression evolves in natural plant populations, showing differential responses of coastal and desert congeneric species in small HSP expression in field and controlled environments. Queitsch et al. (2002) used pharmacological suppression of Hsp90 function to uncover developmental abnormalities in A. thaliana. They suggest that dysfunction in Hsp90 expression can uncover hidden genetic variation on which selection might act in periods of high stress, hypothesizing that HSPs may serve as ‘evolutionary capacitors’. Despite the broad interest generated by this hypothesis, there is little information on among-population, within-species variation in HSP expression in plants.
Functionally, our understanding of the integrated phenotypic effects of HSP and their evolvability is limited. Functional genomic studies strongly suggest that pleiotropy links multiple plant functions, sometimes in surprising ways. That HSPs seem to be associated with stress responses in general provides a strong argument that we should expect pleiotropic effects for genes associated with HSP expression and function, since they are likely to influence multiple plant pathways and traits. Pleiotropic effects can include trade-offs and hence represent constraints on adaptive responses (Waxman & Peck 1998; Tonsor et al. 2005). In animal systems, chronic exposure to high temperature has been associated with reduced high temperature HSP response, implying a cost to chronic HSP expression (Bettancourt et al. 1999). Functional studies comparing HSP-functional wild types with HSP-knockout mutants can provide a direct estimate of the fitness effects of HSP functionality and benefit/cost. When such studies also measure multiple traits known to be of ecological importance, key pleiotropic effects can be described. Comparative studies of naturally occurring variation in HSP expression and correlated variation in ecologically important traits can elucidate the extent to which multiple plant functions covary and have co-evolved with HSP expression. The results can guide strategies for plant improvement, and provide increased understanding of the mechanistic basis of plant metabolism and development in a thermally varying world.
In this study, we addressed four hypotheses aimed at a broad characterization of evolvability in Hsp101 expression in the model plant A. thaliana. The hypotheses:
| H1 | Populations of diverse geographical origin vary in Hsp101 expression. We grew 10 genotypes from the ‘ecotypes’ collection at www.arabidopsis.org and quantified Hsp101 expression in each ecotype across a gradient of Hsp101 induction temperatures. We further characterized the geographical pattern by regressing Hsp101 expression on latitude of origin. |
| H2 | Hsp101 expression affects fitness. We first test for the effect of complete lack of Hsp101 expression on lifetime fecundity by comparing standard laboratory genotypes to their Hsp101 null mutants. We then test how the differences in quantity of Hsp101 expressed by six genotypes influences fecundity. |
| H3 | The fitness effects of Hsp101 depend on genetic background. We addressed this hypothesis by assessing the effects of the Hsp101 null mutation on fecundity in two different genetic backgrounds. |
| H4 | Hsp101 expression has pleiotropic effects on multiple plant traits. We examined the effect of varying Hsp101 expression on a suite of 12 plant traits, including fecundity. For this hypothesis, we measured all traits on the standard laboratory genotypes used in hypotheses 2 and 3. |
Materials and methods
Genotypes
H1: Testing natural genetic variation in Hsp101 expression
We compared Col, originally collected in northern Europe, and nine other wild-collected genotypes. These 10 genotypes were chosen to span nearly the entirety of Arabidopsis thaliana’s historical latitudinal range (Table 1). All are standard ‘ecotypes’ from the Arabidopsis Biological Resource Center at Ohio State University.
Table 1.
The genotypes used in this study, their locations of origin, by place name, latitude (N) and longitude (negative sign indicates W, positive E), and elevation in metres. ‘CS nos’ are standard ABRC stock numbers and ‘Accession’ names are from the stock list. Col-0 through Cvi-0 were used to assess natural genetic variation in temperature gradient Hsp101 expression response curves (experiment 1). Col-0, Ler-2 and the hot1-3 null mutants were used to assess fitness effects of Hsp101 functionality and, with Mt-0 and Sha, to assess effects of tissue Hsp101 content on fitness and phenotypic traits
| Accession | CS Nos | Country | Town/source | Latitude | Longitude | Altitude (m) |
|---|---|---|---|---|---|---|
| Col-0 | 1092 | Poland | Landsberg/Warthe | 53 | 16 | 100 |
| Est-1 | 6701 | Russia | Estland | 59 | 28 | 200 |
| Lc-0 | 6769 | Scotland | Loch Ness | 58 | −5 | 100 |
| PHW-24 | 6078 | United Kingdom | Sidmouth | 51 | −3 | 10 |
| Bay-0 | 57923 | Germany | Bayreuth | 49 | 16.5 | 150 |
| Co-1 | 6669 | Portugal | Coimbra | 41 | −9 | 100 |
| Sha | 6180 | Tadjikistan | Pamiro-Alay | 38 | 68 | 3400 |
| Ct-1 | 6674 | Italy | Catania, Sicily | 37 | 15 | 100 |
| Mt-0 | 6799 | Libya | Martuba/Cyrenaika | 33 | 23 | 312 |
| Cvi-0 | 8580 | Cape Verde | – | 16 | −24 | 1200 |
| Ler-2 | 8581 | Poland | Landsberg/Warthe | 53 | 16 | 100 |
| Colhot1-3 | – | Laboratory | Dr E. Vierling | – | – | – |
| Lerhot1-3 | – | Laboratory | Dr E. Vierling | – | – | – |
H2 and H3: Testing effects of Hsp101 functionality on fitness
We compared two genotypes that are standards in laboratory research, Columbia (Col-0) and Landsberg erecta (Ler-2), with functional Hsp101, to their null mutant homozygotes, hereafter referred as Colhot1-3 and Lerhot1-3, respectively. The hot1-3 null mutant was obtained from a T-DNA mutagenized population of the Col genotype (Mathur et al. 1998). The mutant allele carries a T-DNA insertion in the second exon (reported in GenBank; AF106743), which prevents protein expression (Hong et al. 2001). The Col hot1-3 allele was then introduced through three recurrent backcrosses into the Ler-2 ecotype; this backcross line therefore contains the hot1-3 allele and approximately 12.5% Col genome in a Ler genome background.
H4: Variation in Hsp101 content and its phenotypic effects
Along with the genotypes used for testing Hsp101 functionality effects, we included two genotypes from the southern extreme of the species distribution, Martuba (Mt-0, from low elevation in Libya) and Shakdara (Sha, from high elevation in Tajikistan; sometimes spelled ‘Shahdara’ or ‘Shadara’), all obtained from the Arabidopsis Biological Resource Center at the Ohio State University (see Table 1).
Experimental protocols
Two experiments were conducted. In the first, we assessed H1 and measured natural variation in Hsp101 temperature response curves. In the second, we tested H2–H4.
Experiment 1: natural variation in Hsp101 temperature response curves
The goal in this experiment was to grow plants in conditions that would minimize stress except for the heat stress used to induce Hsp101 expression. The experiment consisted of four replicate blocks. Each block contained two replicate plants of each of the 10 wild-collected genotypes (= 20 plants per block). Labelling was blind and location within a block was random. Each block consisted of one rack of 22 Ray Leach SC10 Supercell Cone-tainer 164 mL plastic pots (www.stuewe.com/products/rayleach.html) filled with washed Turface MVP (www.turface.com) fritted clay, placed in fiberglass trays. After 5 days of moist stratification at 4 °C (to break dormancy), racks and bins were placed in two Conviron PGW36 chambers. Light was supplied at 270-μm photons m2/s for 16 h/24-h period. Illumination was 100 μm m2/s for the first hour, then increased to 270 μm m2/s. Illumination was reduced to 100 μm m2/s for the final hour. Temperatures cycled between 15 and 22 °C night/day. Water was supplied daily with an automatic ebb-and-flood system with Dosatron nutrient apportioners. Nutrient supply ratio was approximately 1:1:1 N:P:K and the rate was maintained by calibrating the apportioners to supply 0.055 mg/g N supplied as KNO3, measured and recalibrated weekly with an ion-specific probe. This nutrient supply rate maximizes mass gain and thus minimizes stress in this growth system (S. J. Tonsor, unpublished). In addition, it is within the range of N supply rates measured for North American natural populations of A. thaliana (D. Byers, personal communication).
Individual leaves, each the most recently fully expanded, were collected from each replicate plant and exposed to one of four temperatures, 22, 28, 34 or 40 °C for 2 h on moist filter paper in the dark. There were thus two leaves from different replicate plants for each genotype at each temperature. The use of detached leaves for measurement of expression variation is a well-established approach (e.g. Knight & Ackerly 2003; Barua & Heckathorn 2006). Approximately 18 h after temperature exposure, Hsp101 expression was quantified for each leaf. In brief, 5 μg of total protein of each sample was resolved by sodium dodecyl sulfate polyacrylamide gel electrophoresis (SDS-PAGE) and transferred onto nitrocellulose. We used Western blots with anti-Hsp101 and anti-glyceraldehyde-3-phosphate dehydrogenase (GAPDH) to determine the presence of Hsp101 and GAPDH, a component of the glycolytic pathway. Western blots were developed using enhanced chemiluminescence. Images were obtained on a Kodak 440CF Image Station. The amounts of protein were quantified using kodak 1d (version 3.6) imaging software, normalizing the level of Hsp101 expression to the background as well as GAPDH levels.
Experiment 2: Hsp101 functionality, Hsp101 content, and phenotypic effects (H2–H4)
All plants were grown in the standard conditions detailed above, except that the temperature cycle ramped between 15 °C and 25 °C night/day. At day 21, post-stratification two thermal treatments were imposed. The control treatment was maintained at 15 °C and 25 °C night/day. An HSP-induction heat treatment was imposed by moving one rack containing three replicates of each genotype from each of the control chambers to a high-temperature chamber for ~3 h every Monday, Wednesday and Friday. This high-temperature chamber had identical conditions to the control chambers, but was maintained at a constant 35 °C. Relative humidity was observed regularly but not systematically recorded, and ranged between 40% and 70% (S. J. Tonsor, personal observation). After the 3-h heat treatment, all plants were returned to the control treatment chambers. Locations of the control and heat-treated replicate trays were switched within control chambers following each heat treatment to minimize location effects within the control chamber. However, individual plants were consistently given either the control treatment or the periodic HSP-induction treatment. This treatment of a short period of exposure to 35 °C is a standard method of Hsp101 induction (e.g. Hong & Vierling 2001). Based on previous studies, by exposing plants to this treatment 3 days per week, we expect that any plants capable of inducing HSP expression were induced and maintained elevated Hsp101 expression throughout the experiment. We expect that the direct effects of heat stress on plant performance should be slight, since the plants were well watered and spent less than 5% of each week (i.e. ~9/168 h/week) at elevated temperature. We refer to these two treatments hereafter as ‘control’ and ‘induction’, or ‘control’ and ‘35 °C’ thermal treatments.
At approximately day 29 of growth, the most recently fully expanded leaf from each plant was removed at mid-day and stored in a −80°C freezer. Hsp101 content of these leaves was assayed on equal amounts of total extracted leaf proteins by Western blot analysis (Hong & Vierling 2001) followed by quantification using Photoshop 7 and NIHimage. Three exposure times were tested to ensure that we achieved an approximately linear relationship between blot intensity and protein concentration. All Western blots for an experiment were performed in a single batch. Instead of normalizing samples across blots, we distributed the genotypes evenly across all blots and each genotype was represented by three replicates. We did not attempt to estimate Hsp101 protein content in grams or moles, rather we used differences in optical absorbance as linear measure of relative Hsp101 content per standardized aliquot of total protein. Thus, this process provides measures of the relative differences in Hsp101 content between plants, averaged across replicates and blots.
All plants were assayed for number and average length of siliques at day 70. Col, Ler, Colhot1-3 and Lerhot1-3 were additionally assayed for the following traits: days from end of stratification to germination, days from end of germination to bolting, number of leaves at bolting, total dry mass (day 70), ratio of root dry mass to total dry mass (day 70), number of basal inflorescences (day 70) and number of siliques (day 70). In addition, photosynthetic physiology was measured under control treatment conditions on day 29 of growth for all plants. Whole-plant CO2 assimilation rate and H2O transpiration rate were measured using a 4-cuvette whole plant gas exchange system on a Li-Cor 6400 infrared gas analyser as described in Tonsor & Scheiner (2007). Dark-adapted photosynthetic fluorescence yield was determined immediately following gas exchange measurement using a PAM 2000 fluorometer (Walz GmbH, www.walz.com; see Tonsor & Scheiner 2007). Protocols for each of these measurements are available at www.pitt.edu/~tonsor.
Analyses: experiment 1
Testing natural genetic variation in Hsp101 expression (H1)
We tested genetic variation among natural accessions through an analysis of covariance. Log transformation resulted in homogeneity of variances across induction temperatures. Nevertheless, plotting of the log-transformed Hsp101 content by temperature still revealed an increasing slope with temperature. Consequently, a quadratic temperature term was included. Because we chose the genotypes on the basis of their geographical origins, we included genotype as a fixed-effect class variable. Because of the variance-to-mean relationship and the exponential gain in Hsp101 leaf content observed across the temperature gradient, a linear regression on the log-transformed Hsp101 content on induction temperature was used. The (genotype–temperature) interaction was included as a fixed effect, as a test for heterogeneity of temperature response slopes among genotypes. In sas language: class genotype; model log(Hsp101 content) = temperature genotype temperature* genotype/ss3.
It was not possible to include latitude of origin in the same analysis used to test for genetic variation in Hsp101 induction response described above because latitude of origin and genotype are not independent. A separate linear regression using sas proc glm was therefore used to test for an effect of latitude on log-transformed leaf Hsp101 content. Initially, all interaction terms were included; nonsignificant interaction terms were then removed from the model. Type III sums of squares were used in hypothesis testing. In sas language, the final model was: class genotype; model log(Hsp101 content) = latitude temperature temperature* temperature/ss3.
Analyses: experiment 2
Testing effects of Hsp101 functionality on fitness in two genetic backgrounds
We used manova and anova to test phenotypic effects of Hsp101 inducibility by comparing null mutants to wild types. These analyses compare the effects of nonfunctional Hsp101 genotypes (i.e. null mutants where Hsp101 is not expressed) to their two corresponding functional wild types (i.e. Hsp inducible). We refer to this as a functionality treatment. In a three-way factorial multivariate analysis of variance (manova) and in univariate analyses of variance (anovas), functionality (hot1-3 null mutant vs. wild type) was a crossed factor with both genetic background (Col vs. Ler) and thermal treatment (control: 15/23 °C diurnal cycle vs. induction: control + ~3 h at 35 °C 3 days/week). All three factors are fixed effects. Because multiple traits are measured on the same individuals and included in these analyses, we can test both fitness effects and pleiotropic effects on physiological, morphological and life-history traits. The manova tests for an overall influence of Hsp101 function on the composite variance across all traits, including fruit production. The anova on fruit production is our test for Hsp101 functionality effects on fitness. The anovas on the other 11 traits test for pleiotropic effects of Hsp101 function.
(m)anovas were first run with all possible interaction effects included. Because the three-way interaction (inducibility × genetic background × thermal treatment) was never significant, it was removed from all manova and anova model statements. Other interactions were removed from individual anovas when not significant and anovas were run again without the nonsignificant interaction term(s). The sources included in each of the final models are indicated in the results (Table 2). All F-tests are based on type III sums of squares.
Table 2.
Mean squares (type III) from the partitioning of phenotypic variation in two standard laboratory genotypes (Col and Ler) and their Hsp101 knockout NILs, in control and Hsp101-inducing treatments. H*T indicates the Hsp101 function by temperature interaction, G*T indicates the genotype by temperature interaction, and G*H indicates the genotype by Hsp101 function interaction. Each of the sources of variance has a single degree of freedom, except the error (i.e. within-genotype, within-treatment-combination) variance, which has 32. Hypothesis testing was based on Wilk’s lambda in the manova, on F-ratios from type III mean squares for all anovas. Mean squares in bold typeface followed by asterisks were significant [*P(>F) ≤ 0.05; **P(>F) ≤ 0.009; ***P(>F) ≤ 0.0009]; bold typeface with no asterisk: P(>F) ≤ 0.10. Mean squares reported for nonsignificant interaction terms are those from the full model including all interactions. All nonsignificant interactions (indicated in normal typeface) are reported in this table, but were removed from the final model. The mean squares from the final reduced analyses are reported for whatever sources remained in the reduced models (i.e. for main effects, regardless of their significance, and for any significant interaction effects). Powers of 10 following trait names indicate that the mean square was multiplied by that power to give an easily readable number for this table
| Trait | Genotype (G) | Hsp101 function (H) | Temperature (T) | H*T | G*T | G*H | Model R2 | Model P(>F) |
|---|---|---|---|---|---|---|---|---|
| manova | 11.56*** | 3.16*** | 3.80*** | 0.52 | 1.48* | 1.45* | – | – |
| Number of fruits (10−4) | 4894*** | 310* | 306* | 5 | 23 | 530** | 0.75 | < 0.0001 |
| Days to germination | 0.09 | 4.27*** | 0.043 | 0.1 | 0.144 | 1.34* | 0.42 | 0.004 |
| Days to bolting | 0.03 | 0.05* | 0.005 | 0.01 | 0.10** | 0.04* | 0.43 | 0.003 |
| Number of leaves at bolting | 8.6** | 3.5 | 4.5* | 0.7 | 2.0 | 21.4*** | 0.48 | < 0.0001 |
| CO2 assimilation rate | 1952*** | 192 | 30 | 140 | 78 | 1 | 0.31 | 0.002 |
| H2O transpiration rate | 14.3* | 14.2* | 1.6 | 1 | 0.5 | 0 | 0.2 | 0.03 |
| Photosynthetic fluorescent yield (104) | 0.0 | 4.1 | 40.0* | 45 | 36.8 | 0.1 | 0.19 | 0.09 |
| Fv/Fm (104) | 14.8* | 1.3 | 14.1* | 1.4 | 1 | 0.4 | 0.29 | 0.02 |
| Total dry mass | 10.57*** | 2.06** | 4.36*** | 0.14 | 1.08* | 0.69 | 0.61 | < 0.0001 |
| Ratio of root mass to total mass (103) | 3.71*** | 0.52 | 6.06*** | 0.28 | 0.09* | 0.01 | 0.6 | < 0.0001 |
| Number of basal inflorescences | 179.4*** | 33.6* | 7.47 | 7.02 | 7.02 | 0.06 | 0.52 | < 0.0001 |
| Total inflorescence length (105) | 474*** | 0 | 17.7** | 0.4 | 4 | 1.5 | 0.87 | < 0.0001 |
Assessing the phenotypic effects of genetic variation in Hsp101 content
We tested for effects of Hsp101 content on phenotype by regressing genotypic trait means on the genotypic mean Hsp101 content. We tested H2 that Hsp101 content affects fitness using nonlinear regression since we expected a saturating function for the relationship. We modelled a saturating function using the relationship: N = Nmax(1 −e−αH), where N is the number of fruits produced, Nmax is the theoretical maximum number of fruits, at which further Hsp101 production will no longer increase fruit production, H is the tissue Hsp101 content, and α is a coefficient that determines the increase in fitness per unit increase in Hsp101 content (as α increases in magnitude, the exponent of e becomes more negative, and the initial slope of Nmax vs. Hsp101 content is steeper). We conducted the regression analyses using sas proc nlin and Levenberg–Marquardt estimation (Marquardt 1963). Levenberg–Marquardt is superior to the alternatives under a variety of conditions, including ill-conditioned Hessian matrices and correlated variables, and under most conditions produces a steeper iterative ascent in model likelihood (see ftp://ftp.sas.com/pub/neural/illcond/illcond.html, Moré 1978). A separate nonlinear regression was conducted for each of the two thermal treatments used in experiment 2 because the maximum fitnesses were different. Nmax was set at 4200 and 3100 for the control and 35 °C thermal treatments, respectively, coinciding with the maximum genotypic mean number of fruits observed in each treatment. Because proc nlin can be sensitive to initial parameter values, we tested a vector of possible initial values for α and allowed proc nlin to choose the initial value that found the global likelihood maximum. We were able to show that the estimated value of α at convergence was insensitive to the starting value (i.e. there is only one likelihood maximum; data not shown).
We conducted analyses to determine pleiotropic effects of Hsp101 content for any trait for which either the anova on Hsp101 functionality or previous work suggested that a relationship might be present. We looked for this relationship in the following traits: days to germination, days to bolting, transpiration rate, Fv/Fm, root : total mass ratio, and number of basal inflorescences. Only in the case of root : total mass ratio did we see evidence of a relationship. Consequently, for this trait only, we again used nonlinear regression to test for a relationship. We chose the following model for proc nlin: root : total ratio = κ + eα(Hsp content) where κ is a minimum value for root : total mass ratio, which is asymptotically approached with increasing leaf Hsp101 content. κ was fixed at the treatment minima for root : total mass ratio: 0.039 and 0.026 for the control and 35 °C treatments, respectively.
Results
Natural populations vary in Hsp101 expression H1
On a log-transformed scale, there is a significant relationship between induction temperature treatment and leaf Hsp101 content, with a highly significant quadratic term (Table 3). Hsp101 expression on an untransformed scale increases exponentially as temperature increases from 22 to 40 °C (Fig. 1). Genotypes differ significantly in their Hsp101 expression response, but lack of significance in the tests of slope heterogeneity (genotype by temperature interactions) indicate no detectable differences among genotypes in the rate of increase in Hsp101 content with increases in induction temperature. The regression model explains 82% of the variance in Hsp101 expression (Table 3). An example of the Western blots on which this analysis is based is provided in Fig. 2.
Table 3.
Means (standard errors) for each trait in experiment 1, by temperature treatment and genotype
| Trait |
|||||||||||||
|---|---|---|---|---|---|---|---|---|---|---|---|---|---|
| Genotype | Treatment | Days to germination |
Days to bolting |
Number of leaves at bolting |
CO2 assimilation rate μm/s |
H2O transpiration rate mm/s |
Quantum yield |
Fv/Fm | Total dry mass (g) |
Root:total mass |
Number of basal inflorescences |
Total Inflorescence length, cm. |
Number of sliques |
| Col | Control | 4.5 (1.4) | 30.0 (1.8) | 9.6 (0.5) | 44 (7) | 10.8 (09) | 0.74 (0.010) | 0.82 (0.005) | 1.78 (0.48) | 0.048 (0.004) | 11.00 (1.7) | 3169 (402) | 4093 (906) |
| Hsp101 induction | 6.1 (2.4) | 25.4 (2.2) | 8.3 (0.7) | 54 (7) | 12.7 (1.0) | 0.73 (0.020) | 0.81 (0.005) | 0.51 (0.25) | 0.059 (0.005) | 11.25 (1.9) | 2296 (277) | 3108 (524) | |
| Colhot | Control | 1.5 (0.1) | 24.3 (0.6) | 8.6 (0.5) | 53 (5) | 13.1 (0.8) | 0.78 (0.003) | 0.82 (0.004) | 2.05 (0.18) | 0.053 (0.005) | 13.00 (0.6) | 2724 (192) | 2560 (325) |
| Hsp101 induction | 1.6 (0.2) | 23.8 (0.4) | 7.6 (0.3) | 53 (5) | 12.7 (0.7) | 0.71 (0.020) | 0.81 (0.006) | 1.51 (0.20) | 0.070 (0.003) | 12.83 (1.6) | 2336 (285) | 2102 (236) | |
| Ler | Control | 2.5 (0.1) | 22.7 (0.2) | 6.4 (0.2) | 34 (5) | 10.6 (0.8) | 0.73 (0.011) | 0.81 (0.004) | 0.48 (0.09) | 0.060 (0.004) | 7.00 (0.3) | 430 (58) | 831 (184) |
| Hsp101 induction | 2.6 (0.1) | 26.6 (1.9) | 6.9 (0.3) | 36 (4) | 10.5 (0.7) | 0.74 (0.011) | 0.80 (0.004) | 0.33 (0.04) | 0.087 (0.011) | 6.83 (0.9) | 340 (34) | 534 (92) | |
| Lerhot | Control | 2.1 (0.2) | 23.9 (0.4) | 9.1 (0.6) | 41 (5) | 11.3 (1.1) | 0.75 (0.012) | 0.81 (0.006) | 0.81 (0.08) | 0.059 (0.006) | 10.40 (0.7) | 755 (70) | 1139 (119) |
| Hsp101 induction | 1.9 (0.1) | 24.8 (0.6) | 8.2 (0.5) | 38 (3) | 11.9 (0.7) | 0.74 (0.007) | 0.79 (0.012) | 0.35 (0.03) | 0.100 (0.013) | 7.33 (0.3) | 335 (16) | 588 (39) | |
| Martuba | Control | 2.7 (0.2) | 24.6 (0.5) | 9.7 (0.3) | 56 (4) | 13.6 (0.7) | 0.75 (0.003) | 0.81 (0.005) | 1.21 (0.23) | 0.046 (0.005) | 8.00 (1.0) | 2347 (441) | 3225 (775) |
| Hsp101 induction | 2.4 (0.5) | 23.7 (0.5) | 8.3 (0.4) | 54 (4) | 12.3 (0.8) | 0.72 (0.007) | 0.81 (0.002) | 0.64 (0.95) | 0.072 (0.002) | 8.67 (0.7) | 1568 (174) | 1689 (229) | |
| Shakdara | Control | 1.9 (0.4) | 24.4 (0.4) | 6.8 (0.5) | 33 (2) | 10.3 (0.4) | 0.72 (0.011) | 0.80 (0.004) | 1.27 (0.80) | 0.039 (0.003) | 8.33 (0.8) | 2338 (390) | 3598 (697) |
| Hsp101 induction | 2.0 (0.3) | 24.3 (0.5) | 5.8 (0.8) | 35 (3) | 9.8 (0.5) | 0.72 (0.011) | 0.79 (0.005) | 1.27 (1.20) | 0.026 (0.005) | 9.50 (1.2) | 1959 (532) | 2803 (801) | |
Fig. 1.
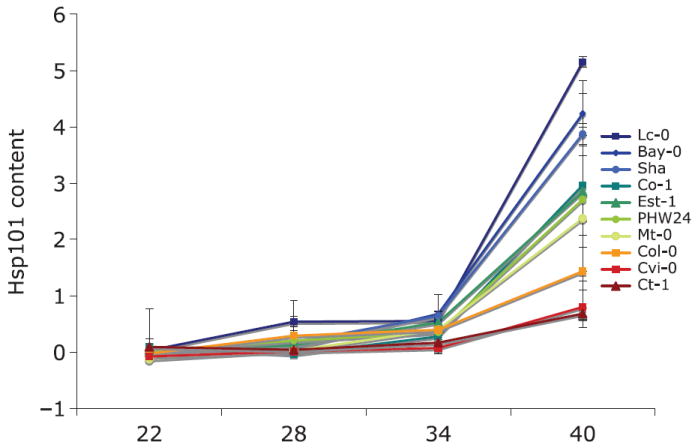
Norms of reaction for genotypic mean relative Hsp101 content in response to a gradient of Hsp101 induction temperatures for each of 10 genotypes from the Arabidopsis Biological Resource Center ‘ecotype’ collection. Vertical bars indicate standard errors for the mean of six replicates for each genotype. Genotypes differ significantly overall and differ significantly in response to induction temperature.
Fig. 2.
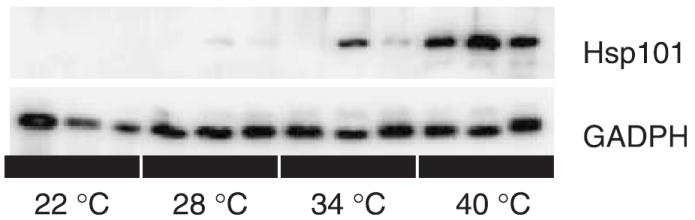
A Western blot illustrating the variation in band optical density between temperatures and genotypes. Top panel: comparison of Mt-0, Lc-0, and Est-1 at four induction temperatures probed with antibodies against Arabidopsis Hsp101. Bottom panel: the same blot probed with antibodies against GAPDH, used to normalize the data.
The natural variation in Hsp101 expression response follows a latitudinal gradient
Regression analyses revealed a significant relationship between latitude of origin and relative Hsp101 content regardless of induction temperature (Table 7). On average, genotypes from higher latitudes showed significantly greater Hsp101 induction than those from low latitudes (Table 4, Fig. 3).
Table 7.
Results of a sas proc glm linear regression of latitude and temperature on leaf Hsp101 content. Regression on temperature included both linear (temperature) and quadratic (temperature × temperature) terms, while the effect of latitude was strictly linear. Higher order interactions were tested and removed from the model, as they were nonsignificant. d.f. = degrees of freedom, r2 = percent variance explained
| Source | d.f. | Sum of squares type III | F | P > F | r2 |
|---|---|---|---|---|---|
| Model | 3 | 44.75 | 73.53 | < 0.0001 | 0.86 |
| Latitude | 1 | 2.35 | 11.58 | 0.002 | |
| Temperature | 1 | 0.87 | 4.3 | 0.045 | |
| Temp * temp | 1 | 2.21 | 10.9 | 0.002 | |
| Error | 36 | 7.29 | |||
| Total | 39 | 52.05 |
Table 4.
Results of nonlinear regression (sas proc nlin using the Marquardt estimation method) of fruit production on Hsp101 content, by thermal treatment, using the regression formula Nfruits = Nfruits(MAX)1 −e−α(Hsp Content). SSq = sum of squares, SE = standard error, d.f. = degrees of freedom. Data from experiment 1
| Temperature treatment | α (SE) | Total SSq (d.f. = 6) | Model SSq (d.f. = 1) | Error SSq (d.f. = 5) | F | P > F |
|---|---|---|---|---|---|---|
| Control | −2.23 (0.54) | 48 488 725 | 44 988 428 | 3 500 297 | 64.26 | 0.0005 |
| 35°C | −1.08 (0.45) | 25 429 163 | 22 734 262 | 2 694 901 | 42.18 | 0.001 |
Fig. 3.
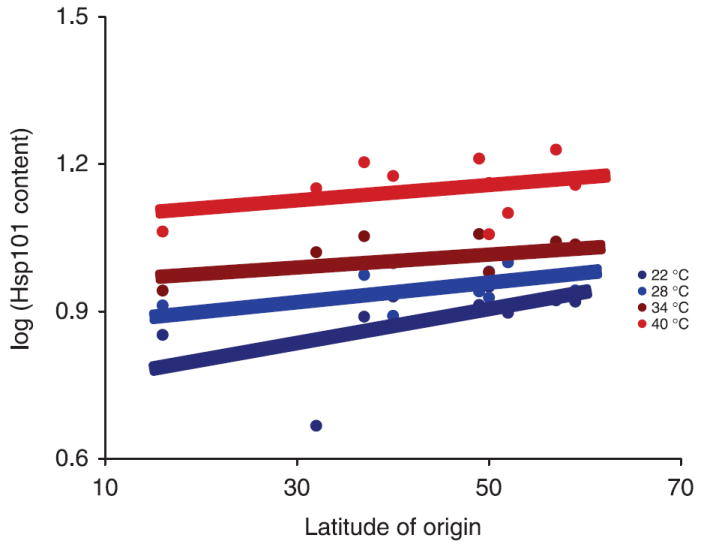
The effect of latitude of origin on Hsp101 content for four induction temperatures. Lines are the result of regression using sas proc nlin using this model: genotypic mean log(Hsp101 content) = αeθ(latitude of origin). (For regression analysis results see Table 6).
Hsp101 functionality increases fitness, measured as number of fruits produced, in the Col-0 background, but not in Ler-2
Although Hsp101 functionality was significant as a main effect on fitness, the magnitude of the effect depended on genotype (Table 2, second row, G*H column and Fig. 4). The significant main effect of Hsp101 is due to the large effect of a functional Hsp101 gene in the Col background. Ler has much lower fecundity than Col overall and replacing the functional Hsp101 gene with its null mutant has no discernable effect in the Ler background when analysed separately from Col (results not shown). This difference in effects of the genetic backgrounds accounts for the significant (genetic-background–functionality) interaction. The anova accounted for 87% of the variance in fruit production. Hsp101 functionality affects fitness regardless of temperature treatment and the decrease in fitness due absence of Hsp101 compared to wild type was not greater in the heat treatment. Therefore, the contribution of Hsp101 is apparently to overall fitness in the range of conditions explored in this study.
Fig. 4.
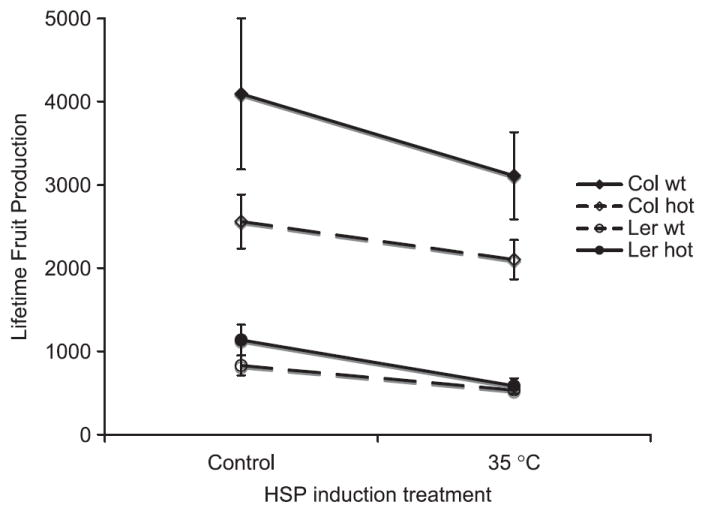
Lifetime fruit production compared for two standard laboratory genotypes of Arabidopsis thaliana (Colwt and Lerwt; solid lines) and those same genotypes but homozygous for hot1-3 null mutation of Hsp101 (Colhot and Lerhot; dashed lines), compared in a 15/23 °C control treatment vs. control treatment plus ~3 h 3 days/week at 35 °C. Vertical bars indicate standard errors of six replicates.
Hsp101 content affects fitness
In the 35°C treatment, a saturating function explained 90% of the variance in fruit production (P = 0.001; Fig. 4 and Table 4). Surprisingly, the relationship was even stronger in the control treatment, explaining 96% of the variance in fruit production (P = 0.0005; Fig. 1 and Table 4). In the control treatment only, since all plants express Hsp101 at levels in the approximately linear portion of the estimated saturation curve, a linear regression is statistically indistinguishable from the nonlinear saturating function in its fit (data not shown, but clear from inspection of Fig. 2).
Hsp101 expression has pleiotropic effects on multiple plant traits
The pattern of variation across all 12 traits resulted in a significant manova model (Table 2 first row). Hsp101 functionality had a highly significant effect on the multivariate phenotypic variance. There were also differences overall between background genotypes and temperature treatments. In addition, Hsp101 functionality effects on phenotype depended on genetic background (Col vs. Ler); we observed a significant (genetic-background−functionality) interaction (Table 2, row 1, column 7). There was also a significant (genetic-background × temperature treatment) interaction (Table 2, row 1, column 6).
On an individual trait basis, knocking out Hsp101 function significantly decreased the number of fruits produced, days to germination, days to bolting, allocation to root mass, and increased the transpiration rate, total dry mass, and the number of basal inflorescences, as well as marginally increasing the number of leaves at bolting (Table 3 for means and standard errors, Table 2 for manova, anova results). Genotypes differed significantly for all traits except days to germination, days to bolting and photosynthetic yield (Table 2, column 2). Exposure to Hsp101-inducing temperature affected all traits but days to germination and days to bolting, CO2 assimilation rate, transpiration rate and number of basal inflorescences (Table 2, column 3). The effects of Hsp101 functionality depended on genotype for days to germination, days to bolting, and number of leaves at bolting (Table 2, column 5). While lack of Hsp101 decreased germination time, days to bolting and leaves at bolting in Col, it had no effect on days to germination or days to bolting and increased the number of leaves at bolting in Ler. The phenotypic effects of Hsp101 function did not depend on thermal treatment for any of the traits (marginally for photosynthetic yield; Table 2, column 7). Genotypes responded differently to thermal treatment in their number of leaves at bolting, total dry mass, and ratio of root mass to total mass (Table 2, column 6).
The nonlinear regression of root : total mass ratio on Hsp101 content was significant in both temperature treatments (P = 0.001 and 0.01 for the control and 35 °C treatments, respectively; see Table 5, Fig. 6).
Table 5.
Result of nonlinear regression (sas proc nlin using the Marquardt estimation method) of root : total mass ratio by thermal treatment, using the regression formula root : total ratio = κ + eα(Hsp content). Data from experiment 1. κ was fixed at the treatment minima for root : total mass ratio: 0.039 and 0.026 for the control and 35 °C treatments, respectively. SSq = sum of squares, SE = standard error, d.f. = degrees of freedom
| Temperature treatment | α (SE) | Total SSq (d.f. = 6) | Model SSq (d.f. = 1) | Error SSq (d.f. = 5) | F | P > F |
|---|---|---|---|---|---|---|
| Control | −15.5 (1.6) | 0.047 | 0.041 | 0.006 | 77.93 | 0.001 |
| 35°C | −12.5 (2.0) | 0.031 | 0.024 | 0.008 | 15.49 | 0.01 |
Fig. 6.
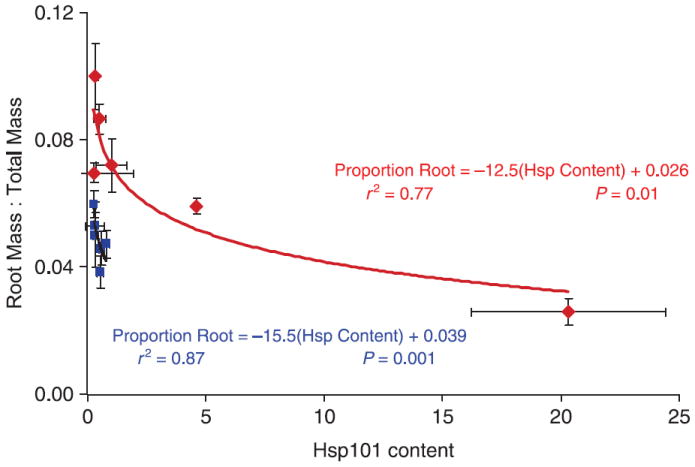
Mean root mass: total mass ratio as a function of Hsp101 content for six replicates of six genotypes of Arabidopsis thaliana (Col-0, Colhot1-3, Ler-2, Lerhot1-3, Mt-0 and Sha), contrasted for two growth conditions: a 15/23 °C control treatment (blue) vs. control treatment plus ~3 h 3 days/week at 35 °C (red). Curves are the Hsp101 exponential decay functions for the two treatments based on sas proc nlin using this model: root : total mass = κ + eα(Hsp content). κ = lowest mean root : total mass ratio observed. Values for the estimated parameters accompany the function curves; details of the analysis are presented in Table 5.
Discussion
This study clearly demonstrates that Hsp101 expression is evolvable. In 10 genotypes encompassing most of the latitudinal range of the species, from Libya to Scotland, significant variation in the leaf Hsp101 content was observed.
The adaptive nature of the observed genetic variation in Hsp101 expression is revealed by the observed relationship between latitude of origin and magnitude of leaf Hsp101 content. Interestingly, at low latitudes, where average annual temperatures are highest, leaf Hsp101 content is actually lowest. This seems at first counter-intuitive, given the observation that Hsp101 enhances survival at high temperature. It is unlikely that Hsp101 expression has direct negative effects on fitness at low latitudes. It is required for survival at high temperatures (Hong & Vierling 2000) and enhances fitness at cool temperatures and under mild thermal stress (this study). Together, these results suggest that adaptation of Hsp101 expression to the local thermal environment cannot be driven simply by the average annual temperature of the habitat, unless Hsp101 expression actually interferes with growth and reproduction in warmer low-latitude habitats. We suggest that it is more likely to be the pleiotropic effects of Hsp101 expression that drive the evolved relationship between latitude and Hsp101 expression. We observed two important pleiotropic effects of Hsp101 tissue content that support this idea.
First, we observed a highly significant exponentially decaying relationship between Hsp101 content and allocation to roots. As Hsp101 content increases, allocation to roots declines asymptotically to a level beyond which further increases in Hsp101 do not appear to further suppress root growth. Our results are corroborated in two additional studies. Nieto-Sotelo et al. (2002) showed this same suppressive effect on hypocotyl growth in corn seedlings by comparing a null Hsp100 mutant to wild type. More recently, McClellan et al. (2007) showed that increases in Hsp101 content mediated by a fungal endophyte decrease root growth in Arabidopsis thaliana. Thus, induction of high levels of Hsp101 may exacerbate the effects of drought stress by decreasing the plant’s water uptake capacity through root growth suppression. We suggest that this Hsp101–root growth relationship may represent an adaptive trade-off when the species is found in conditions where both high temperature and low water availability coincide. Exposure to high temperature is often accompanied by water stress (Moffat 2002), and their combined effects have been long known to be synergistically negative (Savage & Jacobson 1935; Rizhsky et al. 2004). Furthermore, our results imply a negative pleiotropic effect of Hsp101 on water use. Combined high thermal stress and drought stress result in lowered expression of loci associated with thermal tolerance alone, also suggesting negative pleiotropic effects of some elements of acquired thermal tolerance on drought tolerance (Rizhsky et al. 2004).
These experiments conducted either short-term measures of hypocotyl growth response (Nieto-Sotelo et al. 2002 and McClellan et al. 2007) or long-term up-regulation of Hsp101 expression and lifetime measures of root allocation (this study). The duration of root growth effects resulting from up-regulation of Hsp101 for short periods of time and the frequency, timing and duration of such high temperature effects in natural populations remain unclear. If this species experiences temperature extremes of short duration in the middle to the end of the growing season when the root system is well established, there may be little effect on root growth. However, if temperatures climb early in the plant’s life cycle and remain high, there could be substantial effects on the root : shoot ratio with consequent difficulty in maintaining water balance.
An additional pleiotropic effect related to plant water status was observed in the higher transpiration rates of the null mutant. This result further supports the hypothesis that chronically up-regulated Hsp101 expression influences the plant’s water uptake capacity. It also suggests a second fitness trade-off associated with Hsp101 expression: the increased thermal tolerance benefit associated with the Hsp101 biochemical function of remediating temperature-induced misfolding and aggregation of proteins likely comes at the cost of reduced ability to resist high temperature stress through evaporative cooling. This hypothesis deserves further investigation.
In addition to the potential negative plieotropic effects discussed above, our study provides considerable evidence indicating that the production of HSPs is costly. First, ecotypes from more northern or high-elevation habitats have steeper induction response curves across our experimental temperature gradient than ecotypes from southerly, lower elevation sites, suggesting that plants exposed to chronic high temperatures evolve other mechanisms for coping with thermal stress. This could be both because HSP synthesis and activity require energy and/or because of the considerable nitrogen demand imposed by HSP expression (Heckathorn et al. 1996; Feder & Hofman 1999). Together these results suggest HSPs are a costly ‘rapid response’ system, both energetically and in terms of fitness. Long-term exposure to elevated temperatures leads to the evolutionary adjustment of thermal tolerance through other, presumably less costly mechanisms in animals (Sørensen et al. 2001). Further studies in which precise measurement of the thermal and hydrological environment of multiple populations can be correlated with the induction response of Hsp101 will give valuable insight into the evolutionary engineering of optimal thermal tolerance responses.
Despite earlier work establishing that development and germination in a normal thermal environment occur regardless of the presence of a functional Hsp101 gene (Hong & Vierling 2001; Nieto-Sotelo et al. 2002), this study shows more subtle but biologically significant negative fitness effects of the loss of Hsp101 function. In the Columbia genotype, loss of Hsp101 function results in significantly reduced fitness. Since this is true whether the plants experience the control thermal regime (15/23 °C day/night) or the Hsp101 induction environment (15/23 °C day/night +2−3 h at 35 °C mid-day 3× per week), Hsp101 appears to have important functions both at high temperatures (Hong & Vierling 2001) and in normal growing conditions.
The thermal tolerance function of Hsp101 at high temperature has also been observed in yeast and bacteria. For example, Saccharomyces cerevisiae with deletion of the gene encoding the Hsp101 homologue, Hsp104, fail to grow when exposed to extreme stress conditions (e.g. high temperature or excessive concentrations of ethanol; Sanchez & Lindquist 1990; Sanchez et al. 1992). This phenotype is believed to arise from the fact that Hsp104 is required to re-activate unfolded, aggregated proteins, which may accumulate and become toxic under these conditions (Parsell et al. 1994).
The importance of Hsp101 to fitness in normal growth environments, as seen here, was not predicted. Previous studies using Hsp deletion genotypes in yeast and Escherichia coli homologues report no effect on cell growth in the normal growth environments (Sanchez & Lindquist 1990; Squires et al. 1991; Sanchez et al. 1992). In contrast, our results show that even the low amounts of Hsp101 in vegetative tissues detected under normal growth conditions have a significant impact on fitness in the Columbia background. The enhanced fitness effect seen in Columbia was not significant in the Landsberg erecta genomic background. ‘Wild type’ Ler does not appear to express much, if any, Hsp101 in the normal thermal environment (and has substantially lower fitness than wt Col). The difference in Hsp101 content between null mutant Lerhot1-3 and the wild-type Ler is therefore quite small. Landsberg erecta (Ler) was derived from the original Laibach Landsberg through mutagenesis, and is likely to contain multiple mutations. It is possible that one of these mutations affects Hsp101 expression.
Although thermal tolerance involves a number of systems besides HSPs, notably abscisic acid, salicylic acid and probably calcium (Larkindale et al. 2005), our use of the Hsp101 null mutants and corresponding wild types means that we can reject those elements of the thermal tolerance response as direct causes for the significant phenotypic differences between genotype pairs containing functional forms of Hsp101 vs. those that harbour mutant alleles. Nevertheless, genetic differences between Col and Ler in these additional pathways could, through genetic background specific pleiotropic effects, mediate the differences between Ler and Col in Hsp101 effects observed in this study.
The level of Hsp101 expression in the two laboratory lines, Columbia and Landsberg, differed significantly, both in a benign thermal environment, and when up-regulated upon repeated exposure to 35 °C. In the future, it will be valuable to clarify which gene(s) control(s) this differential expression. The effect may arise from genetic differences in the composition and activation of the Hsp101-promotor, by altered rates of protein turn-over, or through some other element(s) of the signal–response pathway. In summary, although the key regulatory agent or pathway remains unknown, it is likely that the differing effects in the two genetic backgrounds are the result of the very limited up-regulation of Hsp101 expression in the Ler background compared to the induction response seen in the Col background.
The results of our study point to Hsp101 as an important molecule for normal plant function and an important mediator of plant responses to both temperature stress and water stress. Our study provides information of value for agronomists in the further elucidation of Hsp101’s function in maintaining cellular function in both normal and stressful conditions for crop species. For evolutionary ecologists, our results indicate that progress in understanding the evolution of complex environmental adaptation could be made through the development of natural study populations in which the tools of genomics, biochemistry and physiology can be combined with the tools of physiological ecology and evolutionary genetics.
Fig. 5.
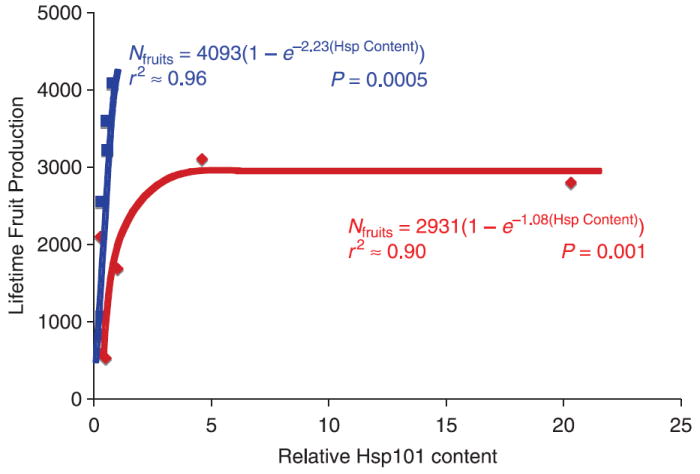
Mean lifetime fruit production as a function of Hsp101 content for six replicates of six genotypes of Arabidopsis thaliana (Col-0, Colhot1-3, Ler-2, Lerhot1-3, Mt-0 and Sha), contrasted for two growth conditions: a 15/23 °C control treatment (blue) vs. control treatment plus ~3 h 3 days/week at 35 °C (red). Curves are the Hsp101 saturation functions for the two treatments based on sas proc nlin using this model: N = Nmax(1 − e−αH). N, mean lifetime fruit production; H, relative tissue Hsp content. Values for the estimated parameters accompany the function curves; details of the analysis are presented in Table 4.
Table 6.
Results of a sas proc glm general linear models analysis of the log of leaf Hsp101 content on Hsp101 induction temperature and genotype across an induction temperature gradient from 22 to 40 °C for 10 wild-collected genotypes of Arabidopsis thaliana. Induction temperature is treated as a continuous variable with both linear and quadratic terms, while genotype is a discrete fixed effect. Data from experiment 2. Sum of squares (type III). d.f. = degrees of freedom, r2 = percent variance explained
| Source | d.f. | Sum of squares | F | P > F | r2 |
|---|---|---|---|---|---|
| Model | 11 | 91.80 | 27.36 | 0.0001 | 0.82 |
| Genotype | 9 | 9.50 | 3.46 | 0.0015 | |
| Temperature | 1 | 1.87 | 6.02 | 0.0159 | |
| Temperature × temperature | 1 | 4.57 | 14.99 | 0.0002 | |
| Error | 67 | 20.43 | |||
| Total | 78 |
Acknowledgments
We thank A. Boulé, J. Goeckeler, T. Harper and E. York for technical assistance and Dr Ung Lee for providing Col and Ler lines carrying the hot1-3 mutation. S.J.T. was supported by NSF 0130347, J.L.B. by NIH grant GM7506 and E.V. by DOE Energy Biosciences grant ER20338.
Biographies
Stephen J. Tonsor is an Associate Professor in Biological Sciences at the University of Pittsburgh. He is an evolutionary geneticist interested in plant adaptation to changing environments.
Craig Scott is an Assistant Professor at Clarion University. He is interested in the functioning of the proteosome in endoplasmic reticulum associated degradation.
Imene Boumaza was an undergraduate Biological Sciences major during this project. She has graduated and is currently conducting biomedical research at the University of Pittsburgh.
Toby R. Liss was an undergraduate honors college double major in Biological Sciences and Linguistics during this project. She is currently working for Teach For America.
Jeffrey L. Brodsky is a Professor and Avinoff Chair of Biological Sciences at the University of Pittsburgh. He is interested in molecular chaperones and their role in endoplasmic reticulum associated degradation.
Elizabeth Vierling is a Professor in Biochemistry and Molecular Biophysics and at the University of Arizona. She is interested in the mechanism of action and biological roles of molecular chaperones/heat shock proteins.
References
- Barton NH, Keightly PD. Understanding quantitative genetic variation. Nature Reviews Genetics. 2002;3:11–21. doi: 10.1038/nrg700. [DOI] [PubMed] [Google Scholar]
- Barua D, Heckathorn SA. The interactive effects of light and temperature on heat-shock protein accumulation in Solidago altissima (Asteracceae) in the field and laboratory. American Journal of Botany. 2006;93:102–109. [Google Scholar]
- Bettancourt BR, Feder ME, Cavicchi S. Experimental evolution of Hsp70 expression and thermotolerance in Drosophila melanogaster. Evolution. 1999;53:484–492. doi: 10.1111/j.1558-5646.1999.tb03783.x. [DOI] [PubMed] [Google Scholar]
- Bettencourt BR, Kim IY, Hoffmann AA, Feder ME. Response to natural and laboratory selection at the Drosophila hsp70 genes. Evolution. 2002;56:1796–1801. doi: 10.1111/j.0014-3820.2002.tb00193.x. [DOI] [PubMed] [Google Scholar]
- Chen Q, Lauzon LM, DeRocher AE, Vierling E. Accumulation, stability and localization of a major chloroplast heat-shock protein. Journal of Cell Biology. 1990;110:1873–1883. doi: 10.1083/jcb.110.6.1873. [DOI] [PMC free article] [PubMed] [Google Scholar]
- Feder ME, Hofman GE. Heat-shock proteins, molecular chaperones, and the stress response: evolutionary and ecological physiology. Annual Review of Physiology. 1999;61:243–282. doi: 10.1146/annurev.physiol.61.1.243. [DOI] [PubMed] [Google Scholar]
- Fisher RA. The Genetical Theory of Natural Selection. The Clarendon Press; Oxford, UK: 1930. [Google Scholar]
- Frydenberg J, Hoffmann AA, Loeschcke V. DNA sequence variation and latitudinal associations in hsp23, hsp26 and hsp27 from natural populations of Drosophila melanogaster. Molecular Ecology. 2003;12:2025–2032. doi: 10.1046/j.1365-294x.2002.01882.x. [DOI] [PubMed] [Google Scholar]
- Hansen TF. The evolution of genetic architecture. Annual Review of Ecology, Evolution and Systematics. 2006;37:123–157. [Google Scholar]
- Heckathorn SA, Poeller GJ, Coleman JS, Hallberg RL. Nitrogen availability alters patterns of accumulation of heat stress-induced proteins in plants. Oecologia. 1996;105:413–418. doi: 10.1007/BF00328745. [DOI] [PubMed] [Google Scholar]
- Hofmann MH. Biogeography of Arabidopsis thaliana Heynh (Brassicaceae) Journal of Biogeography. 2002;29:125–134. [Google Scholar]
- Hong SW, Vierling E. Mutants of Arabidopsis thaliana defective in the acquisition of tolerance to high temperature stress. Proceedings of National Academy of Sciences, USA. 2000;97:4392–4397. doi: 10.1073/pnas.97.8.4392. [DOI] [PMC free article] [PubMed] [Google Scholar]
- Hong SW, Lee U, Vierling E. Hsp101 is necessary for heat tolerance but dispensable for development and germination in the absence of stress. Plant Journal. 2001;27:25–35. doi: 10.1046/j.1365-313x.2001.01066.x. [DOI] [PubMed] [Google Scholar]
- Ishikawa A, Tanaka H, Nakai M, Asahi T. Deletion of a chaperonin 60 beta leads to cell death in the Arabidopsis lesion initiation 1 mutant. Plant and Cell Physiology. 2003;44:255–261. doi: 10.1093/pcp/pcg031. [DOI] [PubMed] [Google Scholar]
- Knight CA, Ackerly DD. Evolution and plasticity of photosynthetic thermal tolerance, specific leaf area and leaf size: congeneric species from desert and coastal environments. New Phytologist. 2003;160:337–347. doi: 10.1046/j.1469-8137.2003.00880.x. [DOI] [PubMed] [Google Scholar]
- Krebs RA, Loeschke V. Resistance to thermal stress in preadult Drosophila buzzatii: variation among populations and changes in relative resistance across life stages. Biological Journal of the Linnean Society. 1995;56:517–531. [Google Scholar]
- Larkindale J, Mishkind M, Vierling E. Plant responses to high temperature. In: Jenks MA, Hasegawa PM, editors. Plant Abiotic Stress. Blackwell Publishing; Oxford, UK: 2005. pp. 100–144. [Google Scholar]
- Lee U, Rioflorido I, Hong S-W, Larkindale J, Waters E, Vierling E. The Arabidopsis ClpB/Hsp100 family of proteins: chaperones for stress and chloroplast development. The Plant Journal. 2007;49:115–127. doi: 10.1111/j.1365-313X.2006.02940.x. [DOI] [PubMed] [Google Scholar]
- Lobell DB, Asner GP. Climate and management contributions to recent trends in U.S. agricultural yields. Science. 2003;299:1032. doi: 10.1126/science.1078475. [DOI] [PubMed] [Google Scholar]
- Malcolm JR, Markham A, Neilson RP, Garaci M. Estimated migration rates under scenarios of global climate change. Journal of Biogeography. 2002;29:835–849. [Google Scholar]
- Manitasevic S, Dunderski J, Matic G, Tucic B. Seasonal variatioin in heat shock proteins Hsp70 and Hsp90 expression in a an exposed and a shaded habitat of Iris pumila. Plant Cell and Environment. 2007;30:1–11. doi: 10.1111/j.1365-3040.2006.01596.x. [DOI] [PubMed] [Google Scholar]
- Marquardt DW. An algorithm for least squares estimation of non-linear parameters. Journal of the Society for Industrial and Applied Mathematics. 1963;2:431–441. [Google Scholar]
- Mathur J, Szabados L, Schaefer S, et al. Gene identification with sequenced T-DNA tags generated by transformation of Arabidopsis cell suspension. Plant Journal. 1998;13:707–716. doi: 10.1046/j.1365-313x.1998.00059.x. [DOI] [PubMed] [Google Scholar]
- McClellan CA, Turbyville TJ, Kithsiri Wijerantne EM, et al. A rhizosphere fungus enhances Arabidopsis thermotolerance through production of an HSP90 inhibitor. Plant Physiology. 2007;145:174–182. doi: 10.1104/pp.107.101808. [DOI] [PMC free article] [PubMed] [Google Scholar]
- McColl G, McKechnie SW. The Drosophila heat shock hsromega gene: An allele frequency cline detected by quantitative PCR. Molecular Biology and Evolution. 1999;16:1568–1574. doi: 10.1093/oxfordjournals.molbev.a026069. [DOI] [PubMed] [Google Scholar]
- Moffat AL. Plant genetics. Finding new ways to protect drought-stricken plants. Science. 2002;296:1226–1229. doi: 10.1126/science.296.5571.1226. [DOI] [PubMed] [Google Scholar]
- Moré JJ. Notes on optimization software. In: Powell MJD, editor. Nonlinear Optimization. Academic Press; New York: 1982. pp. 339–352. [Google Scholar]
- Nieto-Sotelo J, Martinez LM, Ponce G, et al. Maize HSP101 plays important roles in both induced and basal thermotolerance and primary root growth. Plant Cell. 2002;14:1621–1633. doi: 10.1105/tpc.010487. [DOI] [PMC free article] [PubMed] [Google Scholar]
- Nordborg M, Hu TT, Ishino Y, et al. The pattern of polymorphism in Arabidopsis thaliana. PLoS Biology. 2005;3:e196. doi: 10.1371/journal.pbio.0030196. [DOI] [PMC free article] [PubMed] [Google Scholar]
- Otsuka Y, Takano TS, Yamazaki T. Genetic variation in the expression of the six hsp genes in the presence of heat shock in Drosophila melanogaster. Genes and Genetic Systems. 1997;72:19–24. doi: 10.1266/ggs.72.19. [DOI] [PubMed] [Google Scholar]
- Parsell DA, Kowal AS, Singer MA, Lindquist S. Protein disaggregation mediated by heat-shock protein Hsp104. Nature. 1994;372:475–478. doi: 10.1038/372475a0. [DOI] [PubMed] [Google Scholar]
- Pearson RG, Dawson RP. Predicting the impacts of climate change on the distribution of species: are bioclimate envelope models useful? Global Ecology and Biogeography. 2003;12:361–371. [Google Scholar]
- Queitsch C, Hong SW, Vierling E, Lindquist S. Heat shock protein 101 plays a crucial role in thermotolerance in Arabidopsis. Plant Cell. 2000;12:479–492. doi: 10.1105/tpc.12.4.479. [DOI] [PMC free article] [PubMed] [Google Scholar]
- Queitsch C, Sangster TA, Lindquist S. Hsp90 as a capacitor of phenotypic variation. Nature. 2002;417:618–624. doi: 10.1038/nature749. [DOI] [PubMed] [Google Scholar]
- Rizhsky L, Liang H, Shuyman J, Shulaev V, Davletova S. When defense pathways collide. The response of Arabidopsis to combination of drought and heat stress. Plant Physiology. 2004;134:1683–1696. doi: 10.1104/pp.103.033431. [DOI] [PMC free article] [PubMed] [Google Scholar]
- Roff DA. Evolutionary Quantitative Genetics. Chapman & Hall; New York: 1997. [Google Scholar]
- Roff DA, Mousseau T. Does natural selection alter genetic architecture? An evaluation of quantitative genetic variation among populations of Allonemobius socius and A. fasciatus. Evolutionary Biology. 1999;12:361–369. [Google Scholar]
- Rottgers K, Zufall N, Guiard B, Voos W. The ClpB homolog Hsp78 is required for the efficient degradation of proteins in the mitochondrial matrix. Journal of Biological Chemistry. 2002;277:45829–45837. doi: 10.1074/jbc.M207152200. [DOI] [PubMed] [Google Scholar]
- Sanchez Y, Lindquist SL. HSP104 required for induced thermotolerance. Science. 1990;248:1112–1115. doi: 10.1126/science.2188365. [DOI] [PubMed] [Google Scholar]
- Sanchez Y, Taulien J, Borkovich KA, Lindquist S. Hsp104 is required for tolerance to many forms of stress. EMBO Journal. 1992;11:2357–2364. doi: 10.1002/j.1460-2075.1992.tb05295.x. [DOI] [PMC free article] [PubMed] [Google Scholar]
- Savage DA, Jacobson LA. The killing effect of heat and drought on Buffalo Grass and Blue Grama Grass at Hays, Kansas. Journal of the American Society of Agronomy. 1935;27:566–582. [Google Scholar]
- Sørensen JG, Dahlgaard J, Loseschcke V. Genetic variation in thermal tolerance among natural populations of Drosophila buzzatii: Down regulation of Hsp70 expression and variation in heat stress resistance traits. Functional Ecology. 2001;15:289–296. [Google Scholar]
- Sørensen JG, Kristensen TN, Loeschke V. The evolutionary and ecological role of heat shock proteins. Ecology Letters. 2003;6:1025–1037. [Google Scholar]
- Squires CL, Pedersen S, Ross BM, Squires C. ClpB is the Escherichia coli heat shock protein F84.1. Journal of Bacteriology. 1991;173:4254–4262. doi: 10.1128/jb.173.14.4254-4262.1991. [DOI] [PMC free article] [PubMed] [Google Scholar]
- Tonsor SJ, Scheiner SM. Plastic trait integration across a CO2 gradient in Arabidopsis thaliana. American Naturalist. 2007;169:E119–E140. doi: 10.1086/513493. [DOI] [PubMed] [Google Scholar]
- Tonsor SJ, Alonso-Blanco C, Koornneef M. Gene function beyond the single trait: the evolutionary ecology of genetic effects in Arabidopsis thaliana. Plant, Cell and Environment. 2005;28:2–20. [Google Scholar]
- Wagner A. Robustness evolvability and neutrality. FEBS Letters. 2005;579:1772–1778. doi: 10.1016/j.febslet.2005.01.063. [DOI] [PubMed] [Google Scholar]
- Wang W, Vinocur B, Shoseyov O, Altman A. Role of plant heat-shock proteins and molecular chaperones in the abiotic stress response. Trends in Plant Science. 2004;9:244–251. doi: 10.1016/j.tplants.2004.03.006. [DOI] [PubMed] [Google Scholar]
- Waxman D, Peck RR. Pleiotropy and the preservation of perfection. Science. 1998;279:1210–1213. [PubMed] [Google Scholar]
- Whitlock MC, Phillips PC, Moore FBG, Tonsor SJ. Epistasis and multiple fitness peaks. Annual Review of Ecology and Systematics. 1995;26:601–629. [Google Scholar]
- Young TE, Ling J, Geisler-Lee CJ, et al. Developmental and thermal regulation of the Maize heat shock protein, Hsp101. Plant Physiology. 2001;127:777–791. [PMC free article] [PubMed] [Google Scholar]