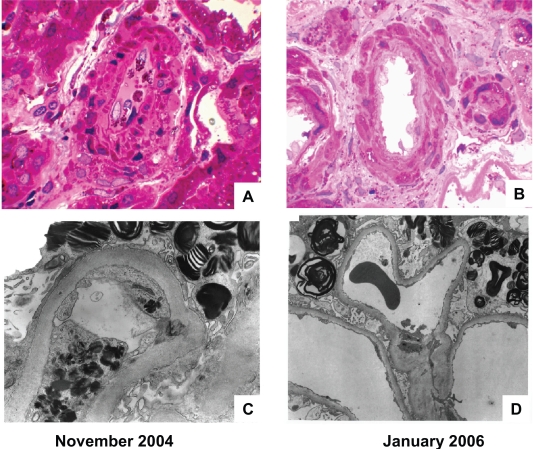
Figure 6.
Effects of agalsidase-beta on arteriolar intimal and medial, and glomerular capillary endothelial GL-3 deposits. The patient was a 33-year-old male who was diagnosed with Fabry disease on the basis of the kidney biopsy findings. At the time of the initial biopsy, his estimated glomerular filtration rate was 25 mL/min/1.73 m2, and his urine protein excretion was 3.3 g/24 h. His proteinuria was controlled to an average of 0.66 ± 0.44 (SD) g/24 h with 20 mg enalapril and 150 mg irbesartan, and agalsidase-beta treatment was started at 1.0 mg/kg every other week. The kidney biopsy was repeated after 15 months of ERT therapy. A) Renal cortical arteriole, before starting ERT (Masson-trichrome stain). B) Renal cortical arteriole, 15-months after starting ERT (Masson-trichrome stain); note clearing of endothelial and intimal GL-3 deposits. C) Glomerular capillary loop, before starting ERT (electron micrograph); note the dense endothelial deposits with substantial obliteration of the capillary lumen and the “Zebra bodies” in the podocytes. D) Glomerular capillary loop, 15 months after starting ERT (electron micrograph); note that the endothelial deposits have cleared, but “Zebra bodies” persist in the podocytes. The magnification is the same for A and B, but C and D have different magnification factors. For point of reference, the basement membrane thickness is the same for the electron micrographs before and after ERT. Courtesy of William Cook, MD PhD Department of Pathology, University of Alabama at Birmingham.

