

Abstract
Purpose
Using proteomic techniques, we sought to identify novel protein biomarkers in tissue and urine from patients with transitional cell carcinoma (TCC).
Experimental Design
Urinary and tissue proteomes were analyzed and differentially expressed proteins identified by mass spectrometry. One of the proteins, cystatin B, was further analyzed in TCC tissue by immunohistochemistry and in urine by semiquantitative western blot analysis.
Results
Cystatin B tissue staining intensity significantly increased concordantly with TCC grade (p=0.0008). Elevated urinary cystatin B levels correlated with increasing tumor grade (p=0.062) and stage (p=0.0047). Patients with elevated levels of cystatin B had a shorter mean time to disease recurrence (12 months, SE 1.82) compared to patients who had low levels (28.8 months, SE 2.26), p=0.0047. Similarly, patients with elevated cystatin B levels had a shorter time to grade/stage progression, compared to patients with low urinary cystatin B (p=0.0007). By multivariate Cox regression analysis, an elevated cystatin B level was the most significant variable predicting disease recurrence (HR 3.8, 95% CI 1.5–9.5, p=0.0049) and grade/stage progression (HR 10.4, 95% CI 1.6–201.5, p=0.0104).
Conclusions
Cystatin B is elevated in tissue and urine of bladder cancer patients. Cystatin B urine levels are positively correlated with tumor grade, stage, and with shorter time to disease recurrence and progression. Consequently cystatin B may be useful as a novel predictive biomarker in TCC of the bladder.
Keywords: cystatin, urinary bladder neoplasms, TCC, urine, proteomics
Introduction
Bladder cancer is the second most common genitourinary malignancy in the United States. In 2008, there were an estimated 68,810 newly diagnosed cases of bladder cancer and an estimated 14,100 deaths due to cancer of the bladder (1). Among all newly diagnosed cases, approximately 70% present as tumors without invasion into the muscularis propria (stages Ta, T1, or Tis), however, up to 50–70% of those cases will recur after resection and approximately 10–20% will progress to muscularis propria invasive disease (T2 or greater) (2). Pathologic data, including grade, stage, and associated carcinoma in-situ at initial presentation have provided some insight into the risk of disease progression to muscularis propria invasion (3, 4). Nevertheless, the ability to predict which patients will ultimately progress remains a significant challenge. An improved ability to accurately predict which patients will recur and ultimately progress to invasive and potentially metastatic disease would greatly enhance the ability to treat patients with bladder cancer. Such prognostic information could help tailor surveillance schedules or shift treatment algorithms to a more aggressive or conservative pathway, depending on the specific risk profile of each patient.
In the molecular era, there has been a concerted effort to identify new biomarkers of invasion or risk of progression to invasive disease. Chromosomal alterations in tumor tissue samples have been observed with transitional cell carcinoma (TCC) grade and stage, with loss of 9q an early phenomenon (5), whereas loss of 17p, 3p, 13q, 18q and 10q are found more frequently in higher grade and stage TCC (6). Tumor suppressor genes, such as p53 and Rb have been extensively studied in bladder cancer; however, both of these markers have demonstrated variable predictive value in assessing the risk for disease progression and survival (7). Cell cycle regulatory proteins p27 and Ki-67 may have some prognostic value for predicting recurrence and disease progression, however, further studies are necessary and these markers are not yet clinically applicable (8-10).
In this study we applied a proteomic approach to bladder cancer biomarker discovery. We report the identification of a cathepsin protease inhibitor, cystatin B (Stefin B) in bladder cancer tissue and show that cystatin B has potential as a bladder cancer biomarker in both patient tissue and urine.
Materials and Methods
Urine Specimen Collection and Protein Isolation
Under an IRB approved protocol, pre-cystoscopy voided urine specimens were collected from patients who had positive findings on initial diagnostic or surveillance office cystoscopy. All TCC patients had their upper tracts cleared via either a preoperative computed tomography (CT) urogram or intraoperative retrograde pyeloureterography. Voided control urine specimens were also obtained from patients within the same age range as TCC patients. The period of urine specimen collection was from March 2003 through October 2004.
Voided urine specimens were immediately cooled to 4 °C and then transferred for storage at − 80 °C within hours. For processing, samples were thawed on ice, diluted in 1 volume of 10mM ammonium bicarbonate buffer pH8, supplemented with protease inhibitors; 1mM PMSF, 5mM phenanthroline and 5mM benzamidine (Sigma-Aldrich), and centrifuged at 3000 × g to remove insoluble material. Samples were concentrated by centrifugation using Centricon Plus-20, 5000 MWCO devices (Millipore) and aliquots lyophilized.
Tissue Specimen Collection and Protein Isolation
Bladder tumor tissue and normal urothelium from the grossly normal contralateral bladder wall were harvested from the cystectomy specimen of individual patients with known stage T3 N1 M0 transitional cell carcinoma, under an IRB approved protocol. Tissue specimens were immediately frozen in liquid nitrogen. For processing, frozen tissue specimens were ground to powder and suspended in 10mM ammonium bicarbonate buffer/pH8, supplemented with protease inhibitors; 1mM PMSF, 5mM Phenanthroline and 5mM Benzamidine (Sigma-Aldrich). Samples were homogenized and fractionated into water-soluble and 2% CHAPS detergent-soluble fractions, concentrated as above, and aliquots lyophilized.
Proteomic Analysis by 2D-PAGE
Protein concentrations of all specimens were determined using the BCA protein assay (Pierce, Rockford, IL). Equivalent protein aliquots (10μg) from individual urine specimens were pooled into Ta, high-grade and normal control groups. Eight patients were included in each of the pooled groups. 40μg of protein from each of the pooled groups were resuspended in isoelectric focusing buffer and loaded onto isoelectric focusing gel-strips of pI 3-10 (Biorad Laboratories, Hercules, CA). 40μg of protein from each of the tissue specimens, tumor and normal urothelium were prepared for isoelectric focusing in a similar manner. Proteins were separated using a linear voltage ramp from 0-8000V. Gel strips were then loaded onto 10-20% gradient SDS-PAGE Criterion gels (Biorad Laboratories) and proteins separated by molecular weight at 185V for 90 minutes. Gels were fixed in 10% methanol + 7% acetic acid, stained with SyproRuby (Biorad Laboratories) overnight and destained with the 10% methanol + 7% acetic acid solution.
Gels were imaged using a 16-bit fluorescent imaging system (ProXPRESS 2D Proteomic Imaging System, PerkinElmer, Waltham, MA) and spectra of peptide spots were analyzed and compared. Several unique peptide spots were identified. Each of these spots of interest were isolated, digested in trypsin and prepared for analysis by liquid chromatography mass spectrometry/mass spectrometry (LCMS/MS) coupled with bioinformatic processing to permit peptide sequence matching and protein identification. LCMS/MS analysis was performed by the Dana Farber Harvard Cancer Center Cancer Proteomics Center.
Immunohistochemical staining
Immunohistochemical staining was performed using a commercially available bladder cancer tissue microarray BL801 (US Biomax Inc, Rockville, MD) consisting of 37 TCC specimens and 35 normal urothelial specimens. The patient population included 26 male and 11 female TCC specimens with a mean patient age of 59.4 years (range 37-88), and 27 male and 8 female normal control specimens from patients of mean age 61.4 years (range 40-88). Of the TCC specimens, 8 were grade 1, 17 were grade 2, and 12 were grade 3. Tumor grade data was provided by U.S Biomax and was determined according to the 1973 World Health Organization (WHO) Grading System. These grades were confirmed by our own pathologic review (C-L.W.) of the hematoxylin and eosin (H&E) images also provided by U.S. Biomax. No staging data was available. The tissues were deparaffinized, endogenous peroxide blocked in 3% hydrogen peroxide in methanol, and microwave antigen retrieval performed using Antigen Unmasking Solution. Blocking was performed using 5% normal horse serum and endogenous biotin blocked using Avidin/Biotin kit. Tissue was incubated with mouse monoclonal anti-cystatin B/Stefin B antibody, clone A6/2 (GeneTex, Inc, San Antonio, TX), followed by anti-mouse biotinylated secondary antibody, amplified using ABC kit, and developed using DAB. Tissue was counterstained using Gill’s Hematoxylin #3 (Sigma-Aldrich, St. Louis, MO), and enhanced using Tacha’s Bluing Solution (Biocare, Concord, CA). All reagents were purchased from Vector Laboratories, Burlingame, CA, except where noted.
The specificity of the cystatin B antibody was demonstrated with an immunohistochemistry peptide competition assay. The antibody was preincubated with either cystatin B or cystatin A peptides (R&D Systems, Inc., Minneapolis, MN), or bovine serum albumin (BSA) (Sigma-Aldrich). Serial sections of high-grade TCC specimens obtained under IRB approval were stained with the peptide-competed antibody. Immunostaining was also confirmed with a second cystatin B antibody, clone M2-F1 (ab54566) (Abcam Inc, Cambridge, MA).
Semi-quantitative Western Blot Analysis
Investigation of Cystatin B expression in urine was performed using semiquantitative Western blot analysis of isolated protein (20μg) from all individual urine specimens. In order to decrease the impact of potential variability between blots, each individual western blot contained a mix of age-matched controls and bladder cancer patient urines. Protein from the pooled specimens and original tumor tissue from which the protein was identified were used as positive controls. Protein isolated from the cell culture lysate of a previously described TCC cell line, MGH-U1 (11), was used as a second positive control. We had previously confirmed cystatin B expression by this cell line. The expression band from 20μg of the same preparation of MGH-U1 total cell lysate was used as a standard to normalize each band from individual patients. PVDF membranes (Immobilon-P, Millipore, Billerica, MA) were probed for Cystatin-B using monoclonal anti-human Cystatin B antibody, clone 225228 (R&D Systems, Inc). Chemiluminescent western blot output was captured using a 16-bit fluorescent imager (ProXPRESS 2D Proteomic Imaging System, PerkinElmer), which provides a linear range of 4 logs. Phoretix Total Lab software (Nonlinear USA, Inc., Durham, NC) was then used to quantify band intensity.
The specificity of this antibody for cystatin B was confirmed by comparative Western blot analysis of specimen reactivity with cystatin A and C antibodies, clones 224705 and 197807 (R&D Systems, Inc.) and antibody cross reactivity with cystatin A and cystatin C recombinant peptides (R&D Systems, Inc.).
Clinical Data Collection and Statistical Analysis
For each voided urine specimen obtained, patient clinical information included whether the patient had a new diagnosis of TCC or a prior history of disease, as well as a history of prior exposure to intravesical therapy (all Bacillus Calmette-Guérin [BCG] in this cohort). Tumor intraoperative and pathologic data were obtained following the subsequent tumor resection in that patient. These included tumor grade, tumor stage, and multifocality. Clinical data on each patient were then prospectively recorded for the entirety of our follow-up period. The period of urine specimen collection was March 2003 through October 2004. Our clinical follow-up was continued through January 2007. Clinical data included whether or not the patient received subsequent intravesical therapy, had eventual recurrent tumor, or had disease progression. Pathologic stage and grade were determined for all recurrent tumors. All specimens were reviewed by dedicated genitourinary pathologists.
Urinary cystatin B expression was first analyzed in a univariate fashion as continuous numeric data. To use urinary cystatin B level as a dichotomous variable, we performed serial testing of the urinary cystatin B mean, median, 65th percentile and 75th percentile with the presence of a bladder tumor and with the two outcomes, time to recurrence and progression. These data were reviewed to determine the optimal cystatin B level cutpoint for this dataset.
Grade, stage and cystatin B levels in urine and tissue were analyzed using contingency table analysis with Chi-Square Test and Cochrane-Armitage Test for trend across grade and stage. Kaplan-Meier time-to-event analysis was used to determine the predictive value of cystatin B for time to TCC recurrence and progression, with survival curves compared with the log-rank test (12). Univariate and multivariate Cox regression analysis was used to model risk for recurrence or grade/stage progression as a function of grade, stage and cystatin B. Likelihood ratio tests were used to determine the significance of the Cox regression models (13). Statistical significance was achieved with a two-sided p value <0.05. Statistical analyses were performed using SAS 9.1.3 and SAS JMP 7.0 software (SAS Institute Inc, Cary, NC).
Results
Proteomic profiling of Bladder Cancer
2D-PAGE proteomic profiles from high-grade TCC and normal control urine specimens were compared (Figure 1 A and B). Additionally, profiles from tissue isolated from an advanced transitional cell carcinoma (Stage T3 N1 M0) and from normal adjacent urothelium were compared (Fig 1 C and D). Multiple peptide spots were identified as differing between the TCC and normal control proteomes. Several of the most dramatically different proteins were excised, trypsinized, and identified by mass spectrometry. One protein of interest at approximately pI 8-9 MW 14kD in the bladder cancer tumor tissue was identified by LCMS/MS as cystatin B (stefin B), an inhibitor of cathepsin family proteases.
Figure 1. Proteomic analysis of bladder cancer patient urine and tissue.
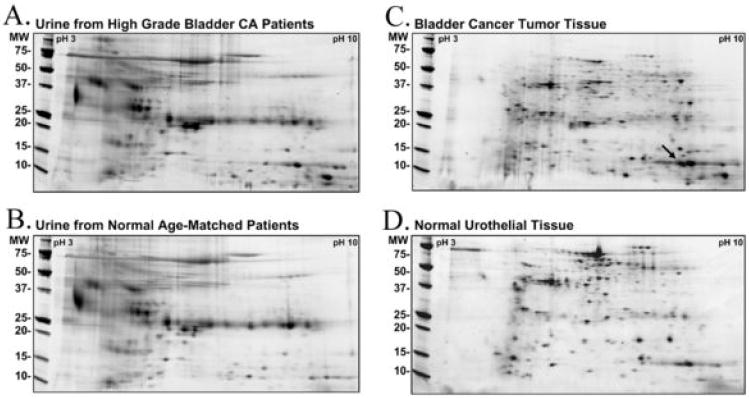
2D SDS-PAGE was used to separate proteins across a charge range of pI 3-10, and through a 4-20% acrylamide gradient. (A) High grade bladder cancer patients’ urine were compared to (B) urine from normal age-matched controls. (C) Bladder cancer tissue was compared to, (D) normal patient matched urothelial tissue. The arrow points to the peptide spot from which cystatin B was identified by LCMS/MS.
Cystatin B is increased in bladder cancer tissue
Increased IHC cystatin B staining intensity was observed in bladder cancer tissue compared to normal bladder, and this was most distinct in high grade TCC tissue (Fig 2A). Some staining was observed in normal bladder, but this was largely confined to the epithelial cell layer (Fig 2B). Immunostaining was analyzed by a pathologist blinded to the subgroups (C-LW). The percentage of specimens with high cystatin B intensity increased significantly with tumor grade (p=0.0077 Fisher’s Exact Test, p=0.008 Cochrane-Armitage Test for Trend) (Fig 2C). Cystatin B immunostaining images and clinicopathologic data for all specimens are shown in supplementary Figure S1 and in supplementary Table S1.
Figure 2. Immunohistochemical analysis of cystatin B expression in bladder cancer tissue.
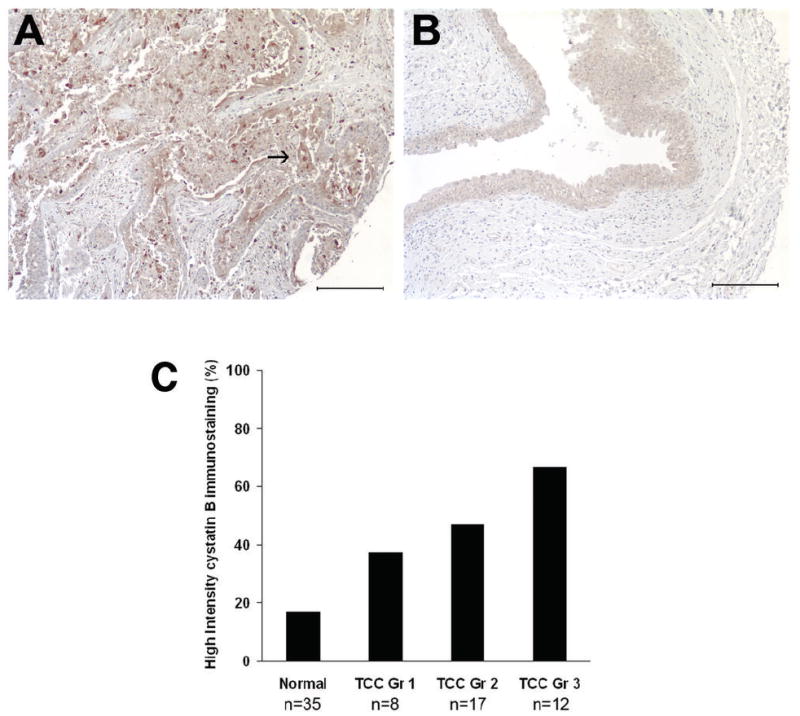
Immunohistochemical staining using cystatin B monoclonal antibody showed increased cystatin B levels in bladder cancer (A) compared to normal bladder tissue (B). The arrow in (A) indicates the high grade TCC cancer cells which are stained by the cystatin B antibody. Images acquired at 10× power. Scale bars indicate 200μm. (C) Percentage of specimens with high intensity cystatin B staining increases concordantly with TCC grade.
Specificity of cystatin B immunoreactivity was confirmed by peptide competition. Cystatin B peptide depleted cystatin B antibody staining, while cystatin A peptide or BSA control had no effect (Supplementary Figure S2).
Urinary cystatin B correlates with TCC grade and stage
Urinary analysis was performed on 51 TCC patients, with a mean age of 75 years (range 46-76) and 28 normal controls, mean age 71 years (range 47-87). Of the TCC patients, 42 (82%) had Ta disease, 4 (8%) T1, and 5 (10%) T2. 14 (28%) were grade 1, 18 (35%) grade 2, and 16 (31%) grade 3, with no grade data available for 3 (6%) patients. 83% of the TCC patients had a history of prior TCC at initial sample collection. Using semi-quantitative western blot analysis, we probed individual bladder cancer patient’s urine specimens to determine whether cystatin B was associated with TCC disease presence, tumor grade or stage. A representative urine western blot is shown in Figure 3A. Samples were categorized into high or low urinary cystatin B level based on a cutoff value of ≥0.54 normalized band intensity units, which was the 65th percentile of the entire population (normals + TCC). We determined that the 65th percentile was the optimal cutpoint for the outcomes recurrence and progression, compared with the mean, median, and 75th percentile (data not shown). High urinary cystatin B levels (≥0.54) were found to correlate with tumor grade. As grade increased so did the proportion of patients with elevated cystatin B (p=0.0242 Fisher’s Exact Test, p=0.0062 Cochrane-Armitage Test for Trend) (Fig 3B). Cystatin B levels were also significantly associated with tumor stage. With higher tumor stage, there were a greater percentage of patients with elevated cystatin B (p=0.0104 Fisher’s Exact Test, p=0.0047 Cochrane-Armitage Test for Trend) (Fig 3C).
Figure 3. Analysis of cystatin B levels in urine from bladder cancer patients and normal age-matched controls.
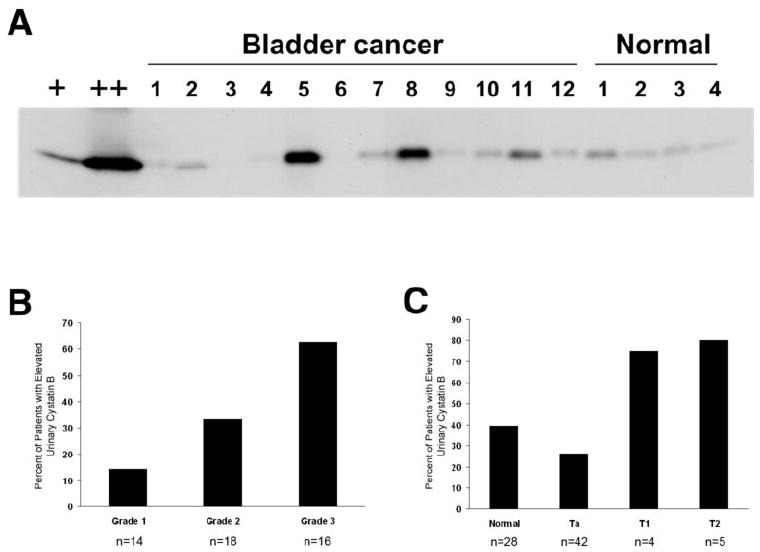
(A) Representative western blot of urine samples using monoclonal cystatin B antibody. Lane 1 (+) is MGH-U1 total cell lysate (positive control) used to normalize signals between individual western blots. Lane 2 (++) represents protein isolated from the pooled urine specimens and TCC tissue. Cystatin B levels in patient urines were quantified by chemiluminescence image scan using a ProXPRESS imaging system. It should be noted that an image acquisition artifact was present in all images obtained with this system, as seen in lane 7. Significantly higher levels of cystatin B were found in TCC with increasing tumor grade (B), and stage (C).
Antibody specificity was addressed using Western blots containing three normal and three TCC patient urine specimens, cystatin B and A peptides, and MGH-U1 cell lysate. Cystatin A was not detected in these urine samples, while cystatin C was found in both normal and TCC specimens. Elevated cystatin B levels in TCC patient urine specimens were confirmed with an additional monoclonal antibody (Supplementary Fig S3).
Urinary cystatin B as a marker for TCC recurrence and grade/stage progression
We next sought to determine whether cystatin B levels were indicative of disease recurrence and stage and/or grade progression. Follow-up identified 24 patients (47%) with subsequent TCC recurrence and 23 (45%) without. 4 (8%) patients had no follow-up information available. Of the 47 patients, 8 (17%) underwent grade or stage progression. Mean follow-up time for censored patients was 2.4 years, with maximum 3.6 years. 76.5% (13/17) of patients with elevated urinary cystatin B had recurrent disease compared with 40% (12/30) of those with low cystatin B in the urine (Fisher’s Exact Test, p=0.0318). Clinical and pathological data for these patients are summarized in Table 1.
Table 1.
Patient Characteristics by Urinary Cystatin B Level
| Low Cystatin B n = 30 | High Cystatin B n = 17 | p-value | |
|---|---|---|---|
| Mean Age in years (range) | 73.7 (60-89) | 74.5 (46-96) | *0.8322 |
| Gender | |||
| Male | 23 (77%) | 9 (53%) | |
| Female | 7 (23%) | 8 (47%) | **0.1144 |
| Previous TCC Bladder | 23 (77%) | 16 (94%) | **0.2276 |
| Prior Intravesical (BCG) Treatment | 4 (13%) | 5 (29%) | **0.2516 |
| Tumor Grade: | |||
| 1 | 12 (40%) | 2 (12%) | - |
| 2 | 12 (40%) | 5 (29%) | - |
| 3 | 6 (20%) | 10 (59%) | †0.0179 |
| Tumor Stage: | |||
| pTa | 28 (93.3%) | 10 (59%) | - |
| pT1 | 1 (3.3%) | 3 (18%) | - |
| pT2 | 1 (3.3%) | 4 (23%) | †0.0152 |
| Multifocality present tumor | 15 (50%) | 10 (59%) | **0.7617 |
| BCG Treatment of present tumor | 3 (10%) | 2 (12%) | **1.00 |
| Mean Follow-up (months) of Patients without Recurrence or Progression | |||
| Recurrence Analysis | 24.9 (SD 11.3) | 25.6 (SD 6.7) | *0.8962 |
| Progression Analysis | 32.1 (SD 10.5) | 28.6 (SD 9.0) | *0.9084 |
Column percents represent proportions of patients within low cystatin B (n=30) and high cystatin B (n=17) categories
T-test
Fisher’s Exact Test
Chi-Square test for differences across grade and stage.
For analysis of time to recurrence, survival curves were determined using Kaplan-Meier time-to-event analysis. Patients with high cystatin B levels had an earlier time to disease recurrence, compared to patients with low cystatin B levels. Patients with high cystatin B levels had a mean time to disease recurrence of 12.0 months compared to those with low cystatin B levels who had a mean time to recurrence of 28.8 months (Fig. 4A, p=0.0047 Log Rank Test).
Figure 4. Urinary cystatin B level is predictive of time to TCC disease recurrence and disease grade/stage progression.

Kaplan Meier analysis was used to estimate (A) disease recurrence-free survival, and (B) grade/stage progression-free survival, for patients with high (cutoff ≥0.54) or low urinary cystatin B levels. High cystatin B was significantly associated with earlier disease recurrence (p=0.0047) and stage or grade progression (p=0.0007, Log Rank test). Plus signs along plots indicate censored data.
We defined grade/stage progression as an increase in tumor grade or stage at the time of subsequent recurrence, or development of locally advanced disease (≥T3) or metastatic disease. Patients with high urinary cystatin B levels were more likely to undergo grade/stage progression than those with low urinary cystatin B. 3.3 % (1/30) of patients with low cystatin B progressed compared with 41% (7/17) of patients with elevated cystatin B (Fisher’s Exact Test, p=0.0019).
Kaplan Meyer analysis demonstrated that patients with high cystatin B levels had an earlier time to grade/stage progression, compared to patients with a low cystatin B level (Log Rank Test, p=0.0007). The mean time to grade/stage progression for patients with low levels of cystatin B was 34.9 months, compared to those with high levels of cystatin B with mean time to stage progression of only 18.1 months (Fig. 4B, p=0.0007 Log Rank Test).
Multivariate Cox regression analysis was used to model the time to disease recurrence and grade/stage progression using cystatin B, tumor grade, tumor stage, subsequent intravesical therapy and tumor multifocality as covariates. By univariate analysis, elevated cystatin B was the most statistically significant variable predicting time to disease recurrence, with a hazard ratio (HR) of 3.108 (95% CI [1.361, 7.098]). Tumor grade and stage were not found to be statistically significant predictors of disease recurrence in univariable and multivariable Cox regression analysis. When only Ta and T1 tumors were included in the model, we demonstrated a trend toward a relationship for stage (univariate HR 2.665, 95% CI [0.779, 9.117]; multivariate HR 2.686, 95% CI [0.67, 10.775]), yet less so for grade (univariate HR 0.986, 95% CI [0.574, 1.694]; multivariate HR 1.259, 95% CI [0.635, 2.496].
There was a trend toward an association of tumor multifocality with recurrence in both univariate and multivariate Cox proportional hazards models (univariate HR 1.887, 95% CI [0.805, 4.425]; multivariate HR 2.236, 95% CI [0.914, 5.467]). In the multivariable analysis, tumor multifocality was neither demonstrated to be a confounder nor an effect modifier of cystatin B level. History of prior BCG therapy was not significantly correlated with future development of additional tumor recurrence or progression. BCG therapy for this specific tumor occurrence, however, did demonstrate an apparent protective effect against tumor recurrence in the Ta and T1 population. This protective effect was statistically significant on multivariate analysis (HR 0.087, 95% CI [0.009, 0.859]).
High cystatin B remained a statistically significant predictor for TCC recurrence, (HR 3.558, 95% CI [1.378, 9.189]) when controlled for tumor grade, stage, multifocality, and treatment with intravesical BCG with multivariate Cox regression analysis. This relationship persisted when only those with Ta or T1 disease were included in the model (HR 3.455, 95% CI [1.279,9.331]) and continued to remain in the Ta population alone (HR 3.461, 95% CI [1.224,9.788]).
Cox regression analysis for grade/stage progression revealed that urinary cystatin B level (HR 15.165, 95% CI [1.859, 123.7]) and tumor stage (HR 2.894, 95% CI [1.375, 6.090]) were significant univariate predictors for progression. Although tumor grade was not a statistically significant univariate predictor of progression, there was a trend toward an association of the two (HR 2.352, 95% CI [0.856, 6.462]). Tumor multifocality and subsequent treatment with intravesical BCG were not significant predictors of progression by univariate or multivariate analyses. By multivariate analysis, elevated urinary cystatin B was the only covariate which remained significant, with a HR of 13.145 (95% CI [1.366, 126.5]). Thus, when controlling for tumor grade, stage, multifocality and subsequent BCG therapy, urinary cystatin B remains a significant predictor of disease grade/stage progression.
Discussion
In an effort to address the need for new prognostic biomarkers in bladder cancer, we used proteomic technology to identify protein changes in both TCC tissue and voided urine samples. Bladder cancer has a natural history of multifocality and recurrence, and the ability to identify those patients who are more likely to progress could significantly affect treatment and management strategies at the time of initial diagnosis. Protein biomarkers of disease progression may serve as indicators for earlier aggressive treatment of non-muscularis propria invasive disease, or alter the algorithm for surveillance of high-risk patients. Additionally, a dependable urinary biomarker of invasive disease could prove to be a valuable complementary or alternative test to cytology and cystoscopy in the surveillance for recurrent disease.
We have identified cystatin B (Stefin B) as a potential urinary and tissue biomarker for TCC of the bladder. Cystatin B is an inhibitor of cathepsin proteases (14). Many cathepsin proteases are increased in cancer (reviewed in (15)), and as their activity is controlled by cysteine protease inhibitors, such as cystatin B, the balance of the protease/inhibitor axis may be important. Cystatin B protein levels have been shown to correlate with tumor presence and stage in other types of cancer. In ovarian, lung, laryngeal and hepatocellular cancers, cystatin B is upregulated (16-19). In colorectal cancer, serum cystatin B correlates with Dukes Stage and with a significantly increased risk of colorectal cancer-associated death (20). Cystatin B level also correlates with disease stage in squamous cell carcinomas of the head and neck (21).
In bladder cancer, the loss of cathepsin D correlates with increased stage, grade and tumor morphology (22, 23). As loss of cathepsin protease activity may correspond with increased inhibitor (i.e. cystatin), these results are intriguing and may be consistent with our data showing increased cystatin B levels in bladder cancer. The balance of the cathepsin/cystatin axis may vary in different tissues and tumor types, and certainly cathepsin protease expression and secretion has been shown to be different in different cell lines (24). Even greater sensitivity as a biomarker of bladder cancer may come from further studies using a combination of both cathepsin and cystatin levels.
In this study, we introduce cystatin B as a novel tissue and urine biomarker for TCC of the bladder, associated with grade, stage, recurrence and progression. Interestingly, three TCC patients who had carcinoma in-situ (CIS) in addition to their primary tumor, also had elevated cystatin B levels in their voided urine. Clinically, associated CIS increases the likelihood of progression to high-grade invasive disease. CIS is also more genetically consistent with muscularis propria invasive TCC than with non-nvasive TCC (25, 26). The elevated expression of cystatin B in those with CIS further supports this protein as a marker associated with invasive TCC and risk of invasion. Our data indicate that although cystatin B may not have the specificity for TCC overall to serve as an individual diagnostic marker, it has potential as a clinically useful prognostic marker.
Elevated urinary cystatin B levels correlated with a shorter time to recurrence and a greater chance of recurring within our follow-up period. Furthermore, patients with elevated urinary cystatin B levels also had a greater risk of earlier grade/stage progression. Our multivariate analyses demonstrated that cystatin B was the most powerful independent predictive variable for disease recurrence and progression. Tumor multifocality has been demonstrated to be an important risk factor for disease recurrence and tumor grade has been shown to be an important predictor of disease progression (27). The precise relationships between cystatin B and tumor grade, stage and multifocality as predictors of disease recurrence and progression will be best determined by future validation studies on larger patient cohorts. Such predictive information regarding time to recurrence and risk of progression would greatly benefit the ability to effectively treat and monitor patients with TCC. Those patients with Ta TCC at risk for a more rapid recurrence and disease progression could be followed with a more frequent schedule of surveillance, whereas those with biomarker evidence of low risk could be surveyed less frequently. Other patients with high risk T1 disease and at greater risk of progression by validated biomarkers, may be more appropriately managed with aggressive surgical resection. In addition to altering surveillance and treatment algorithms, a predictive biomarker, such as cystatin B could be helpful in stratifying patients by risk for clinical trials of current or novel therapies for TCC.
In order to be adopted into clinical use, new biomarkers must significantly improve the predictive ability of current nomograms. In recent years, several other promising bladder cancer biomarkers have been identified (reviewed in (28)). It is possible that multiplexing cystatin B with cathepsins or other urinary biomarkers, such as calreticulin (29), NMP-22 (30, 31), BLCA-4 (32, 33) or matrix metalloproteinases (MMPs) (34), may add significant predictive power. If these markers involve independent mechanisms of tumor pathogenesis, combining them may contribute additional sensitivity and specificity to urine cytology.
In summary, using a proteomic discovery approach, we have identified and validated increased tissue and urinary cystatin B levels in bladder cancer. We have also demonstrated that elevated urinary cystatin B levels correlate with TCC grade and stage. Compared with conventional clinicopathologic data, elevated cystatin B is a highly significant predictor of early disease recurrence and progression.
Supplementary Material
Acknowledgments
We would like to thank Peter Forbes and Dr. Dionne Graham Manning from the Clinical Research Program, Children’s Hospital, Boston for statistical consultation. We would also like to thank Dr. Lloyd Hutchinson for his helpful guidance and Sandra Kirley for her technical assistance. This work was supported by grant CA37393 from the National Institutes of Health.
Footnotes
Statement of Clinical Relevance. The ability to predict which patients will experience disease recurrence or progression is critical to the management of bladder cancer. Our current best predictive tools remain pathologic parameters including tumor grade, stage, tumor multifocality, and the presence of carcinoma in situ.
This manuscript introduces cystatin B as a novel urinary and tissue biomarker in transitional cell carcinoma (TCC) of the bladder. Elevated urinary and tissue cystatin B correlated with tumor grade and stage, and elevated urinary cystatin B effectively predicted disease recurrence and grade or stage progression.
Cystatin B, which by multivariate analysis was an improvement upon our current pathologic prognostic factors, could potentially provide physicians more accurate data with which to make decisions about surveillance schedules, treatment with intravesical chemotherapy or immunotherapy, and early cystectomy in high-risk patients. The ability to appropriately and accurately tailor early aggressive treatment would result in a definite survival benefit in those high-risk patients who would have otherwise progressed to muscularis propria invasion. A dependable prognostic marker would also prevent unnecessary overtreatment of those who would have never progressed, likely resulting in an improved quality of life in those low-risk patients whose surveillance schedules could safely and confidently be made less frequent.
We present cystatin B as a urinary and tissue biomarker in bladder cancer and demonstrate its correlation with tumor grade, stage, disease recurrence, and grade or stage progression.
References
- 1.Jemal A, Siegel R, Ward E, et al. Cancer statistics, 2008. CA Cancer J Clin. 2008;58:71–96. doi: 10.3322/CA.2007.0010. [DOI] [PubMed] [Google Scholar]
- 2.Rubben H, Lutzeyer W, Fischer N, Deutz F, Lagrange W, Giani G. Natural history and treatment of low and high risk superficial bladder tumors. J Urol. 1988;139:283–5. doi: 10.1016/s0022-5347(17)42387-1. [DOI] [PubMed] [Google Scholar]
- 3.Althausen AF, Prout GR, Jr, Daly JJ. Non-invasive papillary carcinoma of the bladder associated with carcinoma in situ. J Urol. 1976;116:575–80. doi: 10.1016/s0022-5347(17)58916-8. [DOI] [PubMed] [Google Scholar]
- 4.Herr HW. Tumor progression and survival of patients with high grade, noninvasive papillary (TaG3) bladder tumors: 15-year outcome. J Urol. 2000;163:60–1. discussion 1-2. [PubMed] [Google Scholar]
- 5.Lindgren D, Liedberg F, Andersson A, et al. Molecular characterization of early-stage bladder carcinomas by expression profiles, FGFR3 mutation status, and loss of 9q. Oncogene. 2006;25:2685–96. doi: 10.1038/sj.onc.1209249. [DOI] [PubMed] [Google Scholar]
- 6.Knowles MA. What we could do now: molecular pathology of bladder cancer. Mol Pathol. 2001;54:215–21. doi: 10.1136/mp.54.4.215. [DOI] [PMC free article] [PubMed] [Google Scholar]
- 7.Habuchi T, Marberger M, Droller MJ, et al. Prognostic markers for bladder cancer: International Consensus Panel on bladder tumor markers. Urology. 2005;66:64–74. doi: 10.1016/j.urology.2005.08.065. [DOI] [PubMed] [Google Scholar]
- 8.Kamai T, Takagi K, Asami H, Ito Y, Oshima H, Yoshida KI. Decreasing of p27(Kip1)and cyclin E protein levels is associated with progression from superficial into invasive bladder cancer. Br J Cancer. 2001;84:1242–51. doi: 10.1054/bjoc.2000.1736. [DOI] [PMC free article] [PubMed] [Google Scholar]
- 9.Korkolopoulou P, Christodoulou P, Konstantinidou AE, Thomas-Tsagli E, Kapralos P, Davaris P. Cell cycle regulators in bladder cancer: a multivariate survival study with emphasis on p27Kip1. Hum Pathol. 2000;31:751–60. doi: 10.1053/hupa.2000.8227. [DOI] [PubMed] [Google Scholar]
- 10.Liukkonen T, Rajala P, Raitanen M, Rintala E, Kaasinen E, Lipponen P. Prognostic value of MIB-1 score, p53, EGFr, mitotic index and papillary status in primary superficial (Stage pTa/T1) bladder cancer: a prospective comparative study. The Finnbladder Group. Eur Urol. 1999;36:393–400. doi: 10.1159/000020039. [DOI] [PubMed] [Google Scholar]
- 11.Lin CW, Lin JC, Prout GR., Jr Establishment and characterization of four human bladder tumor cell lines and sublines with different degrees of malignancy. Cancer Res. 1985;45:5070–9. [PubMed] [Google Scholar]
- 12.Mantel N. Evaluation of survival data and two new rank order statistics arising in its consideration. Cancer Chemother Rep. 1967;50:163–70. [PubMed] [Google Scholar]
- 13.Katz MH. A practical guide for clinicians. 2. New York: Cambridge University Press; 2006. Multivariable Analysis. [Google Scholar]
- 14.Turk V, Bode W. The cystatins: protein inhibitors of cysteine proteinases. FEBS Lett. 1991;285:213–9. doi: 10.1016/0014-5793(91)80804-c. [DOI] [PubMed] [Google Scholar]
- 15.Kos J, Lah TT. Cysteine proteinases and their endogenous inhibitors: target proteins for prognosis, diagnosis and therapy in cancer (review) Oncol Rep. 1998;5:1349–61. doi: 10.3892/or.5.6.1349. [DOI] [PubMed] [Google Scholar]
- 16.Ebert E, Werle B, Julke B, et al. Expression of cysteine protease inhibitors stefin A, stefin B, and cystatin C in human lung tumor tissue. Adv Exp Med Biol. 1997;421:259–65. doi: 10.1007/978-1-4757-9613-1_34. [DOI] [PubMed] [Google Scholar]
- 17.Kastelic L, Turk B, Kopitar-Jerala N, et al. Stefin B, the major low molecular weight inhibitor in ovarian carcinoma. Cancer Lett. 1994;82:81–8. doi: 10.1016/0304-3835(94)90149-x. [DOI] [PubMed] [Google Scholar]
- 18.Smid L, Strojan P, Budihna M, et al. Prognostic value of cathepsins B, D and steffins A and B in laryngeal carcinoma. Eur Arch Otorhinolaryngol. 1997;254(Suppl 1):S150–3. doi: 10.1007/BF02439748. [DOI] [PubMed] [Google Scholar]
- 19.Lee MJ, Yu GR, Park SH, et al. Identification of cystatin B as a potential serum marker in hepatocellular carcinoma. Clin Cancer Res. 2008;14:1080–9. doi: 10.1158/1078-0432.CCR-07-1615. [DOI] [PubMed] [Google Scholar]
- 20.Kos J, Krasovec M, Cimerman N, Nielsen HJ, Christensen IJ, Brunner N. Cysteine proteinase inhibitors stefin A, stefin B, and cystatin C in sera from patients with colorectal cancer: relation to prognosis. Clin Cancer Res. 2000;6:505–11. [PubMed] [Google Scholar]
- 21.Strojan P, Budihna M, Smid L, et al. Prognostic significance of cysteine proteinases cathepsins B and L and their endogenous inhibitors stefins A and B in patients with squamous cell carcinoma of the head and neck. Clin Cancer Res. 2000;6:1052–62. [PubMed] [Google Scholar]
- 22.Dickinson AJ, Fox SB, Newcomb PV, Persad RA, Sibley GN, Harris AL. An immunohistochemical and prognostic evaluation of cathepsin D expression in 105 bladder carcinomas. J Urol. 1995;154:237–41. [PubMed] [Google Scholar]
- 23.Tokyol C, Koken T, Demirbas M, et al. Expression of cathepsin D in bladder carcinoma: correlation with pathological features and serum cystatin C levels. Tumori. 2006;92:230–5. doi: 10.1177/030089160609200308. [DOI] [PubMed] [Google Scholar]
- 24.Heidtmann HH, Salge U, Abrahamson M, et al. Cathepsin B and cysteine proteinase inhibitors in human lung cancer cell lines. Clin Exp Metastasis. 1997;15:368–81. doi: 10.1023/a:1018494020001. [DOI] [PubMed] [Google Scholar]
- 25.Rosin MP, Cairns P, Epstein JI, Schoenberg MP, Sidransky D. Partial allelotype of carcinoma in situ of the human bladder. Cancer Res. 1995;55:5213–6. [PubMed] [Google Scholar]
- 26.Spruck CH, 3rd, Ohneseit PF, Gonzalez-Zulueta M, et al. Two molecular pathways to transitional cell carcinoma of the bladder. Cancer Res. 1994;54:784–8. [PubMed] [Google Scholar]
- 27.Millan-Rodriguez F, Chechile-Toniolo G, Salvador-Bayarri J, et al. Multivariate analysis of the prognostic factors of primary superficial bladder cancer. J Urol. 2000;163:73–78. doi: 10.1016/s0022-5347(05)67975-x. [DOI] [PubMed] [Google Scholar]
- 28.Konety BR, Getzenberg RH. Urine based markers of urological malignancy. J Urol. 2001;165:600–11. doi: 10.1097/00005392-200102000-00081. [DOI] [PubMed] [Google Scholar]
- 29.Kageyama S, Isono T, Iwaki H, et al. Identification by proteomic analysis of calreticulin as a marker for bladder cancer and evaluation of the diagnostic accuracy of its detection in urine. Clin Chem. 2004;50:857–66. doi: 10.1373/clinchem.2003.027425. [DOI] [PubMed] [Google Scholar]
- 30.Gutierrez Banos JL, Rebollo Rodrigo MH, Antolin Juarez FM, Martin Garcia B. NMP 22, BTA stat test and cytology in the diagnosis of bladder cancer: a comparative study. Urol Int. 2001;66:185–90. doi: 10.1159/000056612. [DOI] [PubMed] [Google Scholar]
- 31.Landman J, Chang Y, Kavaler E, Droller MJ, Liu BC. Sensitivity and specificity of NMP-22, telomerase, and BTA in the detection of human bladder cancer. Urology. 1998;52:398–402. doi: 10.1016/s0090-4295(98)00219-2. [DOI] [PubMed] [Google Scholar]
- 32.Konety BR, Nguyen TS, Dhir R, et al. Detection of bladder cancer using a novel nuclear matrix protein, BLCA-4. Clin Cancer Res. 2000;6:2618–25. [PubMed] [Google Scholar]
- 33.Van Le TS, Miller R, Barder T, Babjuk M, Potter DM, Getzenberg RH. Highly specific urine-based marker of bladder cancer. Urology. 2005;66:1256–60. doi: 10.1016/j.urology.2005.07.010. [DOI] [PubMed] [Google Scholar]
- 34.Moses MA, Wiederschain D, Loughlin KR, Zurakowski D, Lamb CC, Freeman MR. Increased incidence of matrix metalloproteinases in urine of cancer patients. Cancer Res. 1998;58:1395–9. [PubMed] [Google Scholar]
Associated Data
This section collects any data citations, data availability statements, or supplementary materials included in this article.