Abstract
A fluorescence sandwich immunoassay using high affinity antibodies and quantum dot (QD) reporters has been developed for detection of botulinum neurotoxin serotype A (BoNT/A) using a nontoxic recombinant fragment of the holotoxin (BoNT/A-HC-fragment) as a structurally valid simulant for the full toxin molecule. The antibodies used, AR4 and RAZ1, bind to nonoverlapping epitopes present on both the full toxin and on the recombinant fragment. In one format, the immunoassay is carried out in a 96-well plate with detection in a standard plate reader using AR4 as the capture antibody and QD-coupled RAZ1 as the reporter. Detection to 31 pM with a total incubation time of 3 hours was demonstrated. In a second format, the AR4 capture antibody was coupled to Sepharose beads, and the reactions were carried out in microcentrifuge tubes with an incubation time of 1 hour. The beads were subsequently captured and concentrated in a rotating rod “renewable surface” flow cell equipped with a fiber optic system for fluorescence measurements. In PBS buffer, the BoNT/A-HC-fragment was detected to concentrations as low as 5 pM using the fluidic measurement approach.
Keywords: Quantum dot, immunoassay, botulinum toxin, fluorescence
1. Introduction
Botulinum neurotoxin (BoNT) is the most toxic substance known to man and is listed as one of the six highest-risk threat agents for bioterrorism (the “Class A agents”).(Arnon et al. 2001; Gill 1982; Lacy and Stevens 1999; Lacy et al. 1998) Cases of natural intoxication by BoNT occur by infections in the intestines of infants, infections of an open wound, and from consuming contaminated food. In addition, the toxin is used clinically to treat a variety of ailments.(Arnon et al. 2001; Gill 1982) Rapid and sensitive detection of botulinum toxin is needed.
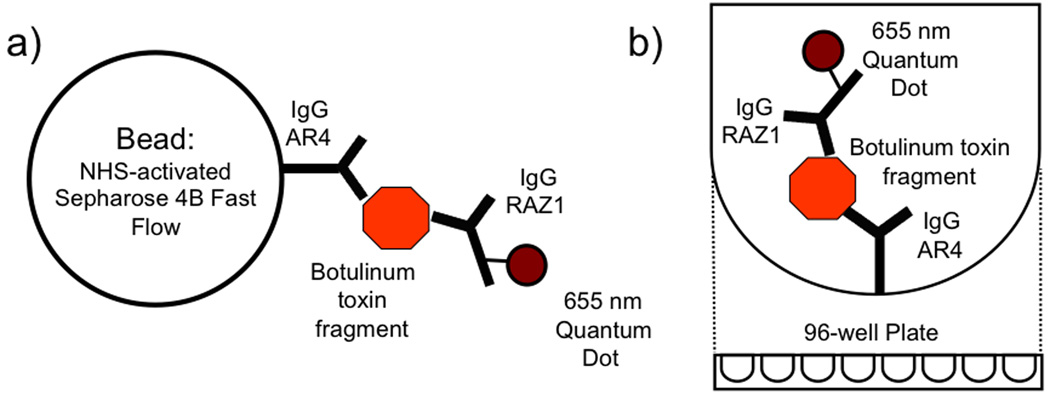
Our aim was to develop sensitive and rapid assays that can detect the presence of BoNT in environmental and complex sample matrices as well as provide a rapid confirmatory test for the diagnosis of BoNT intoxication in a clinical setting. To that end, we have developed two fluorescence sandwich immunoassays that use both 1) high-affinity anti-BoNT/A antibodies and 2) bright, photostable semiconductor quantum dots (QDs) as the optical reporter. These assays include a 96-well plate format where the signal is measured in a standard fluorescence plate-reader, and a bead-based assay using a renewable surface microcolumn sensor for fluorescence detection (shown in Figure 1).(Bruckner-Lea et al. 2000; Grate et al. 2003; Grate et al. 2009; Varnum et al. 2006) In the renewable surface approach,(Chandler et al. 2000; Miro et al. 2008; Ruzicka 1994; Ruzicka 1995; Ruzicka and Scampavia 1999) antibody coupled beads can be captured automatically in a flow cell and later automatically released.
Figure 1.
Diagram of the sandwich immunoassay. The AR4 primary antibody specific for BoNT is attached to a solid support such as a) the Sepharose bead and b) the surface of a 96-well plate. The toxin fragment is then bound in an incubation step lasting between 30 min to 4 hours depending on the format. A secondary antibody, RAZ1, attached to the reporter 655 nm quantum dot is then bound to the toxin fragment-primary antibody complex. The fluorescence signal from the complete sandwich complex is collected after wash steps to remove any unbound reporter.
The use of QDs in biological applications such as fluorescence immunoassays, DNA array technology, fluorescence labeling of cells and tissues, and the detection of chemical and biological agents has recently received an enormous amount of attention due to the unique optical properties of the materials.(Costa-Fernandez et al. 2006; Michalet et al. 2005; Somers et al. 2007). These include high extinction coefficients over a wide wavelength range, size-dependent optical emission (due to quantum confinement effects on the electronic structure of the QDs) and relatively high quantum yields in aqueous media that have been reported to be as high as 25–30 %.(Michalet et al. 2005)
The gold standard method for BoNT detection is the mouse bioassay; it has very high sensitivity with detection limits down to 10–20 pg mL-1of BoNT but can take as long as 4 days to complete.(Kautter and Solomon 1977; Schantz and Kautter 1978) Other assay approaches can be carried out in hours instead of days including enzyme-linked immunosorbent assays (ELISAs),(Ekong et al. 1995; Ferreira et al. 2003; Moorthy et al. 2004; Poli et al. 2002) and activity-based tests that assay the protein cleavage products of the toxin’s zinc endoprotease enzyme.(Wictome et al. 1999a; Wictome et al. 1999b) A fluorescence resonance energy transfer (FRET) assay has also been described.(Dong et al. 2004) Rapid biosensor approaches have also been developed,(Ligler et al. 2003; Shriver-Lake et al. 1993) using evanescent wave optical fibers or planar fluidic array chips. Assays for BoNT were reviewed in two articles in 2005,(Scarlatos et al. 2005; Sharma and Whiting 2005) and a number of new assay methods have appeared since.(Attree et al. 2007; Bagramyan et al. 2008; Frisk et al. 2008; Gessler et al. 2006; Gessler et al. 2007; Grate et al. 2009; Guglielmo-Viret et al. 2005; Han et al. 2007; Mason et al. 2007; Rivera et al. 2006; Sharma et al. 2006; Varnum et al. 2006) A variety of labeling and amplification schemes are employed in these BoNT assays, but thus far none use QD labels. QDs have been used in a multiplexing scheme for detecting other toxins such as ricin, cholera toxin, shiga-like toxin 1, and staphylococcus enterotoxin B.(Goldman et al. 2004)
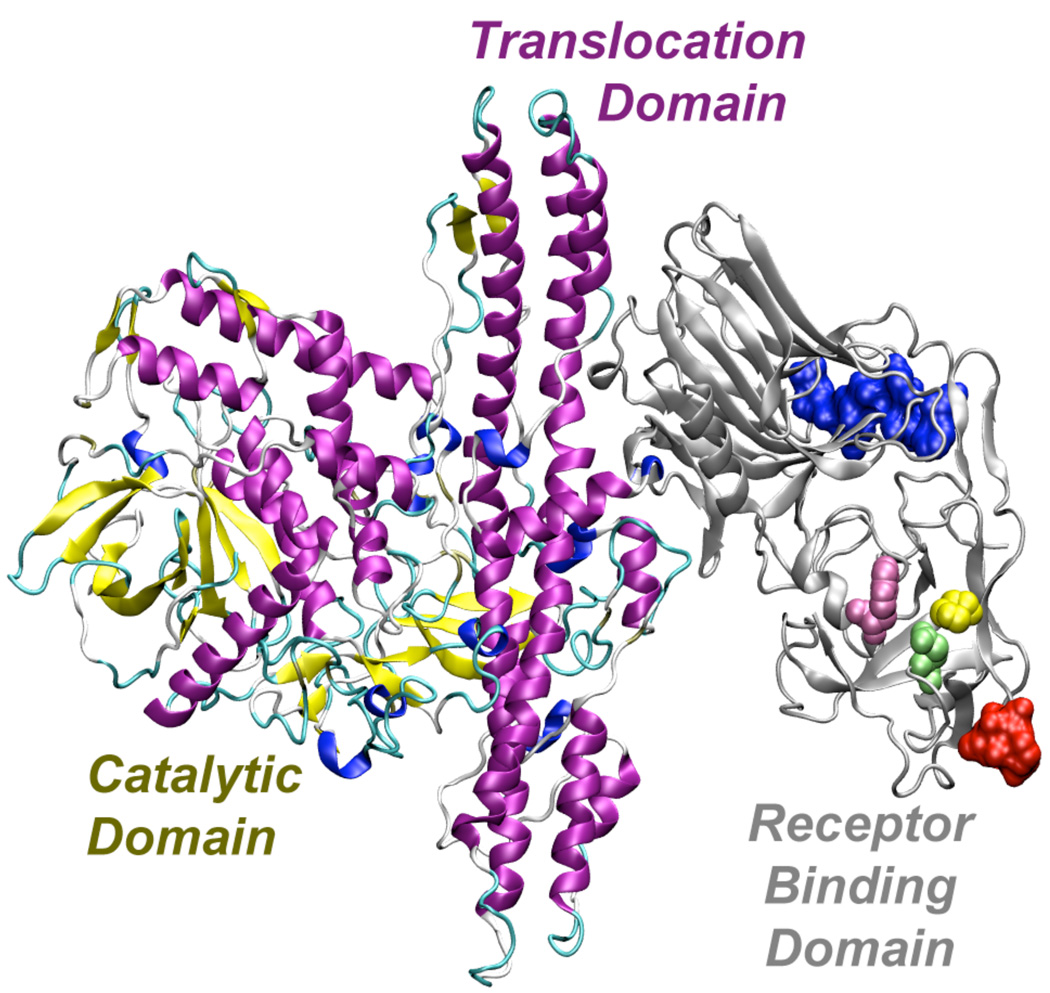
The toxin consists of a catalytic domain in the light chain (~50 kDa) and a heavy chain (~ 100 kDa) containing the translocation domain and receptor-binding domain (see Figure 2).(Arnon et al. 2001)
Figure 2.
Three-dimensional structure of BoNT showing the catalytic, transloaction, and receptor binding domains. The space-filling surfaces on the receptor-binding domain represent the epitope sequences that are targeted by the AR4 (Garcia-Rodriguez et al. 2007) (blue portion) and RAZ1 (Mullaney et al. 2001) (red portion) antibodies. The structure (Lacy et al. 1998) was rendered using POV-Ray rendering software. This image was made with VMD (http://www.ks.uiuc.edu/Research/vmd/). VMD is developed with NIH support by the Theoretical and Computational Biophysics group at the Beckman Institute, University of Illinois at Urbana-Champaign.
Several serotypes of BoNT exist, with type A (BoNT/A) causing the vast majority of foodborne outbreaks. BoNT/A has also been observed to cause more severe symptoms and higher mortality.(Woodruff et al. 1992)
In our assays, we use high affinity antibodies that interact with the receptor binding domain of BoNT/A.(Amersdorfer et al. 1997; Amersdorfer et al. 2002; Garcia-Rodriguez et al. 2007; Mullaney et al. 2001; Nowakowski et al. 2002; Razai et al. 2005; Smith et al. 2005; Varnum et al. 2006) These reagents were developed using display technologies, generating two separate families known to bind different epitopes on BoNT/A.(Levy et al. 2007) Antibodies AR4 and RAZ1 are affinity matured members of these two families.(Nowakowski et al. 2002; Razai et al. 2005) Further, it has been shown that these antibodies bind to epitopes on a recombinantly produced fragment of the heavy chain BoNT/A (BoNT/A-HC-fragment) corresponding to the BoNT/A binding domain (labeled in Figure 2) with affinities similar to those observed when binding to the full-length holotoxin.(Byrne et al. 1998; Clayton et al. 1995;Levy et al. 2007; Smith et al. 2005)
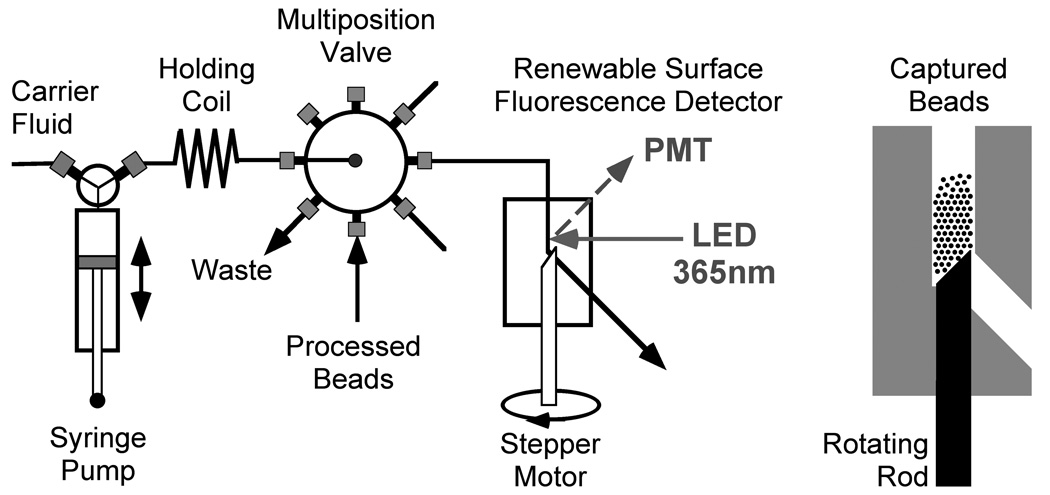
For this study, we used a large-scale production system of recombinant BoNT/A-HC-fragment in order to provide adequate quantities of this safer nontoxic simulant. Importantly, this 50 kDa recombinant fragment contains the same nonoverlapping epitopes as the receptor-binding domain of the full toxin to which the AR4 and RAZ1 antibodies are known to bind as shown in Figure 2.(Levy et al. 2007) Using this recombinant fragment as a model antigen, we developed a fluorescence sandwich immunoassay for BoNT and demonstrated its application in both 96 well plate- and bead-based assay formats. In the 96 well plate format, we demonstrated detection to 31 pM with a total of 3 hours of incubation time for capture and labeling. In the bead-based assay, using flow cell fluorescence detection (see Figure 3), we achieved a detection limit of 5 pM in PBS buffer matrix with just 1 hour of incubation time.
Figure 3.
A schematic diagram of the sequential injection system with the rotating rod flow cell (constructed from chlorotrifluoroethylene (CTFE)) used as the renewable surface microcolumn equipped with an on-column detector (shown at the left).
2. Experimental
2.1. Materials and Reagents
Dialyzed fetal bovine serum was purchased from Invitrogen (La Jolla, CA). Quick start Bradford dye reagent was purchased from Biorad Laboratories (Hercules, CA). Phosphate buffered saline 1X (PBS), bovine serum albumin (BSA), and sodium bicarbonate were purchased from Sigma (St. Louis, MO) NHS-Activated Sepharose 4 Fast Flow beads were purchased from Amersham Biosciences (Piscataway, NJ). Superblock Buffer and bovine gamma globulin protein standards were purchased from Pierce (Rockford, IL). Nunc 96-well polystyrene Maxisorp plates were purchased from Fisher Scientific (Pittsburgh, PA). QDs were purchased from Invitrogen (La Jolla, CA). The AR4 and RAZ1 anti-BoNT/A IgG antibodies used in study were developed as described previously (see Supporting Information).(Amersdorfer et al. 1997; Amersdorfer et al. 2002; Garcia-Rodriguez et al. 2007; Mullaney et al. 2001; Nowakowski et al. 2002; Razai et al. 2005; Smith et al. 2005; Varnum et al. 2006)
2.2. Preparation of BoNT/A-Hc-fragment antigen and assay reagents
The details of the production of the Bot NT/A-HC-fragment, Sepharose beads, and antibody-QD conjugates are given in the Supporting Information. (Byrne et al. 1998; Clayton et al. 1995)
2.3. Fluidics System
The fluidic system is shown in Figure 3 and described elsewhere.(Bruckner-Lea et al. 2000; Grate et al. 2009; Grate et al. 2003; Varnum et al. 2006)
2.4. Plate-Based Assay
Maxisorp plates were prepared using the procedure supplied by the manufacturer and details are given in the Supporting Information. Each assay was performed on a TECAN Safire plate reader operating in bottom-read and the measurements were made in triplicate at each concentration and the difference in response from the mean to the blank was reported.
2.5. Bead-Based Assay
Bench top assays for detection in the fluorescence flow cell were performed using RAZ1 labeled 655 nm QD and AR4 labeled 90 µm Sepharose beads in 1.5 mL microcentrifuge tubes. A 1 mL solution was made containing 25 µL of packed beads, 0.4 nM antibody-labeled QDs, and a known concentration of the BotNT/A-HC-fragment and incubated in the tube for 1 hour at 4°C with mixing prior to analysis in the flow cell. The beads were then loaded into the fluorescence flow cell and washed three times with PBS buffer containing 0.05% Tween 20 at 10 µL s-1 before detection. Controls run to account for the effects of non-specific binding included measuring the response from unfunctionalized beads as well as samples containing beads and QDs but no toxin.
For plate detection, 100 µL of the washed bead solution was pipetted into wells in a 96-well plate and read using the TECAN Safire plate reader in bottom-read mode with the same settings described in the Supporting Information. In the fluidics detection system beads were aspirated and packed in a microcolumn. In each assay, 200 µL of a dilute bead solution was perfused into the flow cell (12 µL) where liquid was able to pass by while the beads were trapped in the flow cell forming a 6 µL column. The fiber-coupled 365 nm LED was used to excite the column, which was washed continually at 10 µL s-1 with up to 5 mL of PBS buffer. An average response over 50 seconds was recorded from the PMT. All samples were run in triplicate.
3. Results and discussion
3.1. Assay reagents
The two sandwich immunoassay formats to be described (Figure 1) both involve a solid substrate (either a polymer bead or 96-well plate) to which the AR4 was bound as the capture antibody. QDs were conjugated to RAZ1 antibody to serve as the reporter. AR4 and RAZ1 bind to different nonoverlapping epitopes on the BoNT/A-HC-fragment.
In the bead-based approach, AR4 was coupled to N-hydroxysuccinimidyl ester (NHS)-activated Sepharose 4B Fast flow beads; coupling efficiencies varied from batch to batch but were between 93–99 % resulting in a loading of 0.0003 µg of antibody per bead. In the case of the 96-well plate assays, coupling efficiencies were not determined since the solution of antibody used to load the plate was at a concentration below the limit of detection of the Bradford assay.
QDs were coupled to RAZ1 using the kit and procedure provided by Invitrogen and as described in the Supporting Information. This coupling procedure is straightforward and easy to follow leading to a high level of coupling efficiency (typically determined to be about 95%). It is important to note that the resulting QD-antibody conjugate does not remain stable for extended periods. Based on our observations, after a few weeks of cold storage at 4 °C, the conjugate tends to aggregate and precipitate out of solution. Resuspension through light heating or vortexing of the precipitated and presumably aggregated QD results in an inferior material (e.g. poorer limit of detection and longer assay times).
3.2. Detection of BoNT/A-HC-fragment with a 96-well plate-based immunoassay
Initially, we investigated the QD-based sandwich assay in a 96-well plate format, using the QD-coupled RAZ1 antibody as the reporter. The AR4 capture antibody was attached to a Maxisorp 96-well plate (1 µg antibody provided per well, see Supporting Information), which has a theoretical loading density of ~ 400 ng/cm2 of antibody.(Esser 2003) At this loading density a closely packed layer of antibody should form on the surface of the well with the majority of the antibody’s active sites pointing away from the surface making them available to bind antigen from solution.(Esser 2003) Initially plates were blocked using a 1% solution of bovine serum albumin (BSA), but better assay results were obtained using Superblock buffer, a commercially available blocking mixture which uses a smaller protein (~ 5 kDa) to effectively block the plate binding sites.
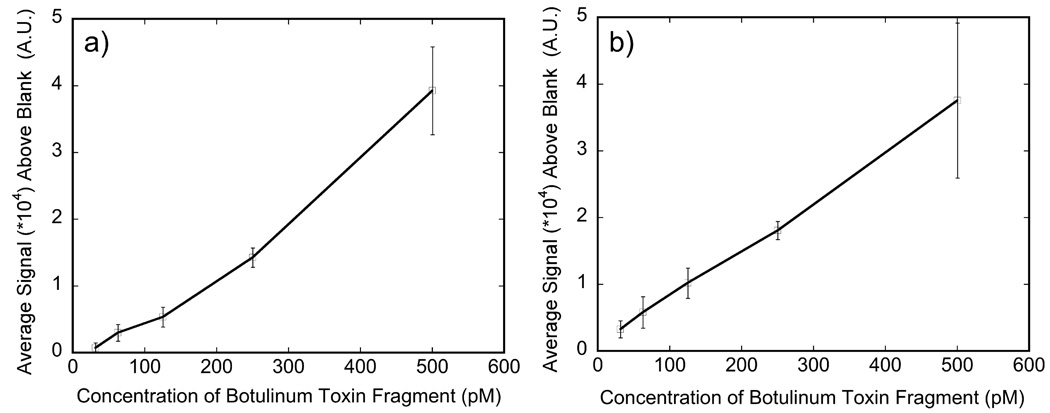
This assay was calibrated against a range of BoNT/A-HC-fragment concentrations in buffer and FBS sample matrices, using a 2 hour incubation time for antigen capture and a 1 hour incubation time for labeling. The calibration curves are shown in Figure 4, plotting the average of 3 replicates at each concentration after subtracting the blank signal. Detectable background subtracted signals on the fluorescent plate reader greater than 3 times the standard deviation of the blank were observed starting at about 31 pM in both PBS buffer and FBS.(Robinson et al., 2005)
Figure 4.
Calibration curve for the detection of BoNT/A-Hc fragment in a) PBS buffer and b) FBS using a plate based sandwich immunoassay and 655 nm quantum dot coupled RAZ1 antibodies as a reporter. Each point represents the average of the difference in response between the sample and the blank of three replicates at that concentration. The standard deviation of the blank (not shown) was determined to be a) ± 224 A.U. for PBS and b) ± 401 A.U. for FBS.
3.3. Detection of BoNT/A-HC-fragment with bead-based immunoassay
In an effort to speed up the analysis, bead-based assays were carried out using a plate reader for the initial measurements, followed by detection experiments in the renewable surface flow cell. In the bead-based assays, the AR-4 coupled Sepharose beads, sample, and RAZ1-coupled QDs were all incubated together for one hour with mixing. The 25 µL of settled bead volume provided to each assay could contain up to ca. 16 µg of antibody. Thus, this approach used more antibodies and mixing, compared to the plate-based assay. Incubation times in this approach were reduced to 1 hour from 3 hours, and detection limits were 50 pM in either PBS buffer or FBS using the plate reader. With beads in the plate, the standard deviation of the blank values were twice as great as those in the conventional plate approach, where the detection limit was 31 pM.
We were able to significantly lower the detection limit by using the rotating rod flow cell in the fluidic system to capture the beads in a small volume and use fiber optics for the fluorescence measurement. The beads are trapped as liquid flows through them and around the rod through a “leaky tolerance” between the rod and the flow cell body (Figure 3). This tolerance (usually ~ 10 – 20 µm) is smaller than the bead diameter. When the measurement is complete, the rod can be rotated to release the beads and propel them out of the flow cell.
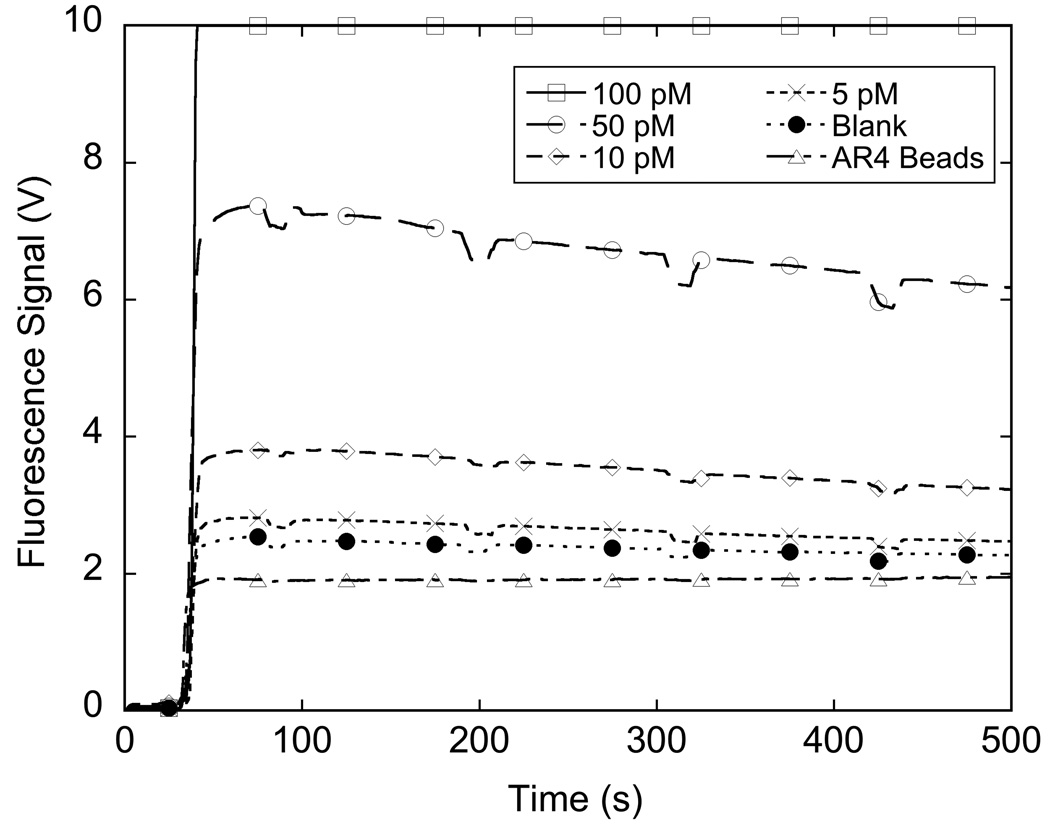
Figure 5 shows the response of the system when measuring different concentrations of BoNT/A-HC-fragment.
Figure 5.
Signal from detection of BoNT/A-Hc fragment in buffer using a bead based sandwich immunoassay with 655 nm quantum dots and detection on an in house flow system. Each line represents the mean of the signal from three samples at that concentration.
The capture of the Sepharose beads in the flow cell, even for blank measurements, causes a significant amount of signal response. The lowest trace labeled “AR4 Beads” shows the response to loading beads into the system. This signal is due to scattering of the excitation source. If the beads have been exposed to the QD-labeled reporter antibody, as shown in the trace labeled “Blank”, there is an additional increase in signal compared to unmixed beads. The Sepharose beads are highly porous and extremely flexible and even after multiple washings, some unbound RAZ1-QD conjugates remain within the beads, contributing to the blank signal. Nevertheless, samples incubated with the antigen lead to signals that are measurably higher than the blank.
After packing the beads in the column, they are washed with PBS buffer. Each dip in signal response as seen in Figure 5 occurs when flow stops for the 1 mL syringe to refill. When flow stops, pressure on the packed column is reduced and the porous Sepharose beads are able to expand, reducing the amount of beads and bound QD conjugates that are in the path of the detection optics. When flow resumes, the signal increases to its previous level due to the recompression of the beads under pressure pushing more of the QD conjugates into the path of the optics. As can be seen from the plots shown in Figure 5, the signal resulting from the sandwich assay complex is reasonably stable through more than 4 mL of total wash volume indicating that the bead-based assay with flow cell detection is a robust method for measuring BoNT/A.
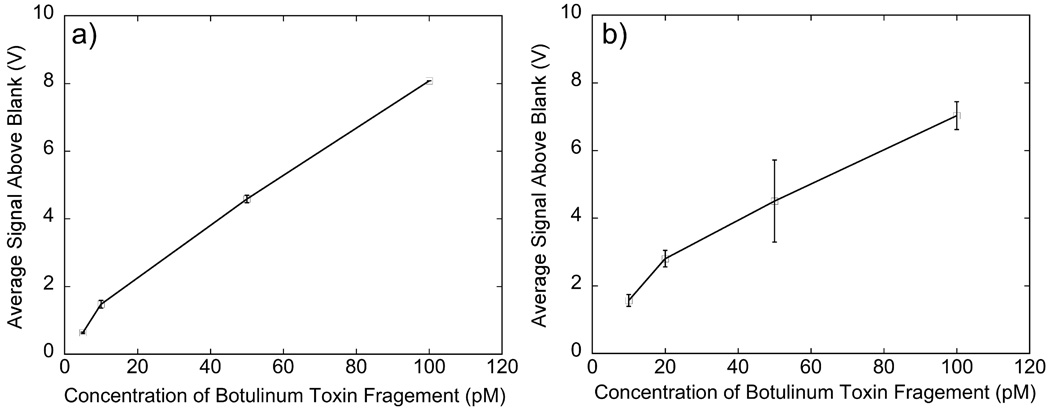
The system gives a response to increase in antigen concentration with very little deviation among triplicate measurements as shown in Figure 6a. The detection limit, taken as the average background subtracted signal greater than 3 times the standard deviation of the blank, is consistently 5 pM BoNT/A-HC-fragment in PBS buffer matrix.(Robinson et al., 2005) The results using QD-labeled antibodies stand in contrast to our previous results using AlexaFluor647-labeled antibodies for toxin detection.(Grate et al. 2009; Ozanich et al. 2009) Using the latter conjugates, we observed that the fluorescence intensity fades with time. This result was observed when the assay steps were carried out both within the flow cell and in microcentrifuge tubes, followed by analysis in the flow cell. Thus, the antibody-quantum dot conjugates yielded much more stable optical signals (as demonstrated in Figure 5) than AlexaFluor647-labeled antibodies in the same assay and measurement system.
Figure 6.
Calibration curve for the detection of BoNT/A-Hc fragment in a) PBS buffer and b) FBS using a bead based sandwich immunoassay with 655 nm quantum dots and detection on an in house flow system. Each point represents the average of the difference in response between the sample and the blank of three samples at that concentration. The standard deviation of the blank (not shown) was determined to be a) ± 0.047 V for PBS and b) ± 0.078 V for FBS.
The assay was also performed in FBS, which contains a complex mixture of proteins. The variability in run-to-run triplicate responses was much greater in FBS and the detection limits were slightly higher at 10 pM compared to 5 pM in PBS due to increased noise in the blank measurement. A calibration curve in FBS is shown in Figure 6b. The proteins in the FBS matrix may interfere with the assay by increasing non-specific binding leading to the higher detection limit.(Kane et al. 2003)
We have observed significant variability in signal response from day to day that is being investigated This variability may be attributed to the slow degradation (over periods of storage > 1 week) of the QD-antibody conjugates either due to aggregation of the QD or decomposition and denaturation of the attached RAZ1 antibody. In addition, there may be non-specific binding interactions between the protein-labeled QD and the protein functionalized bead surface, as well as between the tubing sidewalls and the QD-labeled protein. The non-specific binding can be caused by protein-protein interactions, as well as the possibility of electrostatic and van Der Waals interactions between the tubing sidewalls and the proteins.(Kane et al. 2003) As we continue to develop the automated detection system, measures to overcome the nonspecific binding, including chemical steps that would impart specific functionalities onto the surface of the bead (e.g. poly-ethylene glycol) and manipulations of the flow cell and tubing that will minimize or eliminate nonspecific binding of the protein to bead column and/or the sidewalls of the flow system, are being investigated.(Dilly et al. 2006; Herrwerth et al. 2003; Kane et al. 2003)
4. Conclusions
The 96-well plate assay reported can be adapted to work in any fluorescence plate reader and provides reasonably sensitive detection in 3 hours making it an attractive candidate for use in laboratories already using the standard plate-based ELISA detection methods. The bead-based assay performed in microcentrifuge tubes with detection in a 96-well plate reduces assay time to just over 1 hour. However, the same bead-based assay with detection in the renewable surface flow cell has excellent signal stability and more sensitive detection limits. The one hour, 5 pM detection limit for the bead-based assay with renewable surface flow cell detection is equivalent to 250 pg/mL for the 50 kDa BoNT/A-HC-fragment, or to 750 pg/mL for the full 150 kDa botulinum toxin. Although it currently requires user interaction, it has the potential to be more fully automated.
The bead-based assay with flow cell detection differs from the plate-based assay in having more capture antibody present, in being mixed during the incubation, and in the fluorescence measurement approach. The first two factors also apply when the bead fluorescence is read out with a plate reader, where the detection limit is not improved compared to the standard plate approach. Therefore, the superior detection limits for the final bead-based assay must be attributed to the concentration of the fluorophores in the microcolumn and the optical measurement system. The first two factors, however, most likely contribute to the bead-based assay being faster.
The bead-based assay is also somewhat simpler. All the reagents are mixed together in one step and incubated. Then this mixture is aspirated in the flow system, the wash steps are carried out automatically by the flow system and the signal is measured. In this regard, it is somewhat similar to flow cytometric bead-based assays, where all the reagents are mixed and incubated followed by aspiration into the flow cytometer for analysis.(BDBiosciences)
Supplementary Material
Acknowledgements
This work has been supported with funding from the United States Department of Homeland Security Science and Technology Directorate, project IAA No. HSHQDC-06-X-00213. In addition, the antibody development work at UCSF was partially supported by NIAID R21 grant AI53389-01, NIAID cooperative agreement U01 AI056493, and DoD contract DAMD17-03-C-0076. The research was performed in part at the W. R. Wiley Environmental Molecular Sciences Laboratory, a national scientific user facility sponsored by the U.S. Department of Energy’s Office of Biological and Environmental Research and located at Pacific Northwest National Laboratory, which is operated for the U.S. DOE by Battelle Memorial Institute.
Footnotes
Publisher's Disclaimer: This is a PDF file of an unedited manuscript that has been accepted for publication. As a service to our customers we are providing this early version of the manuscript. The manuscript will undergo copyediting, typesetting, and review of the resulting proof before it is published in its final citable form. Please note that during the production process errors may be discovered which could affect the content, and all legal disclaimers that apply to the journal pertain.
References
- Amersdorfer P, Wong C, Chen S, Smith T, Deshpande S, Sheridan R, Finnern R, Marks JD. Infect. Immun. 1997;65(9):3743–3752. doi: 10.1128/iai.65.9.3743-3752.1997. [DOI] [PMC free article] [PubMed] [Google Scholar]
- Amersdorfer P, Wong C, Smith T, Chen S, Deshpande S, Sheridan R, Marks JD. Vaccine. 2002;20(11–12):1640–1648. doi: 10.1016/s0264-410x(01)00482-0. [DOI] [PubMed] [Google Scholar]
- Arnon SS, Schechter R, Inglesby TV, Henderson DA, Bartlett JG, Ascher MS, Eitzen E, Fine AD, Hauer J, Layton M, Lillibridge S, Osterholm MT, O'Toole T, Parker G, Perl TM, Russell PK, Swerdlow DL, Tonat K. JAMA, J. Am. Med. Assoc. 2001;285(8):1059–1070. doi: 10.1001/jama.285.8.1059. [DOI] [PubMed] [Google Scholar]
- Attree O, Guglielmo-Viret V, Gros V, Thullier P. J. Immunol. Methods. 2007;325(1–2):78–87. doi: 10.1016/j.jim.2007.06.003. [DOI] [PubMed] [Google Scholar]
- Bagramyan K, Barash JR, Arnon SS, Kalkum M. PLoS ONE. 2008;3(4):e2041. doi: 10.1371/journal.pone.0002041. [DOI] [PMC free article] [PubMed] [Google Scholar]
- BD Biosciences: For example, mixing all the beads and reagents in one step is the method for using BD Biosciences Cytometric Bead Array Kits.
- Bruckner-Lea CJ, Stottlemyre MS, Holman DA, Grate JW, Brockman FJ, Chandler DP. Anal. Chem. 2000;72(17):4135–4141. doi: 10.1021/ac000246m. [DOI] [PubMed] [Google Scholar]
- Byrne MP, Smith TJ, Montgomery VA, Smith LA. Infect. Immun. 1998;66(10):4817–4822. doi: 10.1128/iai.66.10.4817-4822.1998. [DOI] [PMC free article] [PubMed] [Google Scholar]
- CDC: Centers for Disease Control and Prevention. Botulism in the United States 1899–1996: Handbook for epidemiologists, clinicians, and laboratory workers. [Accessed June 3, 2009];Atlanta, GA: 1998 http://www.cdc.gov/ncidod/dbmd/diseaseinfo/files/botulism.pdf.
- Chandler DP, Brockman FJ, Holman DA, Grate JW, Bruckner-Lea CJ. Trends Anal. Chem. 2000;19(5):314–321. doi: 10.1021/ac000246m. [DOI] [PubMed] [Google Scholar]
- Clayton MA, Clayton JM, Brown DR, Middlebrook JL. Infect. Immun. 1995;63(7):2738–2742. doi: 10.1128/iai.63.7.2738-2742.1995. [DOI] [PMC free article] [PubMed] [Google Scholar]
- Costa-Fernandez JM, Pereiro R, Sanz-Mendel A. Trends Anal. Chem. 2006;25(3):207–218. [Google Scholar]
- Dilly SJ, Beecham MP, Brown SP, Griffin JM, Clark AJ, Griffin CD, Marshall J, Napier RM, Taylor PC, Marsh A. Langmuir. 2006;22(19):8144–8150. doi: 10.1021/la060743j. [DOI] [PubMed] [Google Scholar]
- Dong M, Tepp WH, Johnson EA, Chapman ER. PNAS. 2004;101(41):14701–14706. doi: 10.1073/pnas.0404107101. [DOI] [PMC free article] [PubMed] [Google Scholar]
- Ekong TAN, McLellan K, Sesardic D. J. Immunol. Methods. 1995;180(2):181–191. doi: 10.1016/0022-1759(94)00313-l. [DOI] [PubMed] [Google Scholar]
- Esser P. [January 21, 2009];Nunc Bulletin. 2003 6:317–321. http://www.nuncbrand.com/frame.aspx?ID=579.
- Ferreira JL, Maslanka S, Johnson EA, Goodnough M. J AOAC Int. 2003;86:314–331. [PubMed] [Google Scholar]
- Frisk ML, Berthier E, Tepp W, Johnson EA, Beebe DJ. Lab on a Chip. 2008;8:1793–1800. doi: 10.1039/b811075a. [DOI] [PubMed] [Google Scholar]
- Garcia-Rodriguez C, Levy R, Arndt JW, Forsyth CM, Razai A, Lou J, Geren IN, Stevens RC, Marks JD. Nat. Biotechnol. 2007;25(1):107–116. doi: 10.1038/nbt1269. [DOI] [PubMed] [Google Scholar]
- Gessler F, Hampe K, Schmidt M, Boehnel H. Diagn. Microbiol. Infect. Dis. 2006;56:225–232. doi: 10.1016/j.diagmicrobio.2006.04.014. [DOI] [PubMed] [Google Scholar]
- Gessler F, Pagel-Wieder S, Avondet MA, Boehnel H. Diagn. Microbiol. Infect. Dis. 2007;57:243–249. doi: 10.1016/j.diagmicrobio.2006.07.017. [DOI] [PubMed] [Google Scholar]
- Gill MD. Microbiol. Rev. 1982;46(1):86–94. doi: 10.1128/mr.46.1.86-94.1982. [DOI] [PMC free article] [PubMed] [Google Scholar]
- Goldman ER, Clapp AR, Anderson GP, Uyeda HT, Mauro JM, Medintz IL, Mattoussi H. Anal. Chem. 2004;76(3):684–688. doi: 10.1021/ac035083r. [DOI] [PubMed] [Google Scholar]
- Grate JW, Warner MG, Ozanich RM, Miller KD, Colburn HA, Dockendorff BD, Antolick KA, Anheier NC, Lind MA, Lou J, Marks JD, Bruckner-Lea CJ. Analyst. 2009 doi: 10.1039/b900794f. [DOI] [PubMed] [Google Scholar]
- Grate JW, Bruckner-Lea CJ, Jarrell AE, Chandler DP. Anal. Chim. Acta. 2003;478(1):85–98. [Google Scholar]
- Guglielmo-Viret V, Attree O, Blanco-Gros V, Thullier P. J. Immunol. Methods. 2005;301:164–172. doi: 10.1016/j.jim.2005.04.003. [DOI] [PubMed] [Google Scholar]
- Han SM, Cho JH, Cho IH, Paek EH, Oh HB, Kim BS, Ryu C, Lee KJ, Kim YK, Paek SH. Anal. Chim. Acta. 2007;587:1–8. doi: 10.1016/j.aca.2007.01.028. [DOI] [PubMed] [Google Scholar]
- Herrwerth S, Rosendahl T, Feng C, Fick J, Eck W, Himmelhaus M, Dahint R, Grunze M. Langmuir. 2003;19:1880–1887. [Google Scholar]
- Kane RS, Deschatelets P, Whitesides GM. Langmuir. 2003;19:2388–2391. [Google Scholar]
- Kautter DA, Solomon HM. J. AOAC Int. 1977;60(3):541–545. [PubMed] [Google Scholar]
- Lacy DB, Stevens RC. J. Mol. Bio. 1999;291(5):1091–1104. doi: 10.1006/jmbi.1999.2945. [DOI] [PubMed] [Google Scholar]
- Lacy DB, Tepp W, Cohen AC, DasGupta BR, Stevens RC. Nat. Struct. Biol. 1998;5(10):898–902. doi: 10.1038/2338. [DOI] [PubMed] [Google Scholar]
- Levy R, Forsyth CM, LaPorte SL, Geren IN, Smith LA, Marks JD. J. Mol. Bio. 2007;365(1):196–210. doi: 10.1016/j.jmb.2006.09.084. [DOI] [PMC free article] [PubMed] [Google Scholar]
- Ligler FS, Taitt CR, Shriver-Lake LC, Sapsford KE, Shubin Y, Golden JP. Anal. Bioanal. Chem. 2003;377(3):469–477. doi: 10.1007/s00216-003-1992-0. [DOI] [PubMed] [Google Scholar]
- Mason JT, Xu L, Sheng ZM, O'Leary TJ. Nat. Biotechnol. 2007;24(5):555–557. doi: 10.1038/nbt1201. [DOI] [PubMed] [Google Scholar]
- Michalet X, Pinaud FF, Bentolila LA, Tsay JM, Doose S, Li JJ, Sundaresan G, Wu AM, Gambhir SS, Weiss S. Science. 2005;307:538–544. doi: 10.1126/science.1104274. [DOI] [PMC free article] [PubMed] [Google Scholar]
- Miro M, Hartwell SK, Jakmunee J, Grudpan K, Hansen EH. Trends Anal. Chem. 2008;27:749–761. [Google Scholar]
- Moorthy J, Mensing GA, Kim D, Mohanty S, Eddington DT, Tepp WH, Johnson EA, Beebe DJ. Electrophoresis. 2004;25(10–11):1705–1713. doi: 10.1002/elps.200405888. [DOI] [PubMed] [Google Scholar]
- Mullaney BP, Pallavicini MG, Marks JD. Infection and Immunity. 2001;69(10):6511–6514. doi: 10.1128/IAI.69.10.6511-6514.2001. [DOI] [PMC free article] [PubMed] [Google Scholar]
- Nowakowski A, Wang C, Powers DB, Amersdorfer P, Smith TJ, Montgomery VA, Sheridan R, Blake R, Smith LA, Marks JD. Proc. Nat. Acad. Sci. U.S.A. 2002;99(17):11346–11350. doi: 10.1073/pnas.172229899. [DOI] [PMC free article] [PubMed] [Google Scholar]
- Ozanich RM, Bruckner-Lea CJ, Warner MG, Miller KD, Antolick KC, Marks JD, Lou J, Grate JW. Anal. Chem. 2009 doi: 10.1021/ac9006914. In Press. [DOI] [PubMed] [Google Scholar]
- Poli MA, Rivera VR, Neal D. Toxicon. 2002;40(6):797–802. doi: 10.1016/s0041-0101(01)00288-4. [DOI] [PubMed] [Google Scholar]
- Razai A, Garcia-Rodriguez C, Lou J, Geren IN, Forsyth CM, Robles Y, Tsai R, Smith TJ, Smith LA, Siegel RW, Feldhaus M, Marks JD. J. Mol. Bio. 2005;351(1):158–169. doi: 10.1016/j.jmb.2005.06.003. [DOI] [PubMed] [Google Scholar]
- Rivera VR, Gamez FJ, Keener WK, White JA, Poli MA. Anal. Biochem. 2006;353:248–256. doi: 10.1016/j.ab.2006.02.030. [DOI] [PubMed] [Google Scholar]
- Robinson JW, Skelly Frame EM, Frame GM. Undergraduate Instrumental Analysis. 6 ed. New York: CRC Press; 2005. [Google Scholar]
- Ruzicka J. Analyst. 1994;119:1925–1934. doi: 10.1039/an9941901925. [DOI] [PubMed] [Google Scholar]
- Ruzicka J. Anal. Chim. Acta. 1995;308(1–3):14–19. [Google Scholar]
- Ruzicka J, Scampavia L. Anal. Chem. 1999;71:257A–263A. doi: 10.1021/ac990293i. [DOI] [PubMed] [Google Scholar]
- Scarlatos A, Welt BA, Cooper BY, Archer D, DeMarse T, Chau KV. J. Food Sci. 2005;70(8):R121–R130. [Google Scholar]
- Schantz EJ, Kautter DA. J. AOAC Int. 1978;61(1):96–99. [Google Scholar]
- Sharma SK, Ferreira JL, Eblen BS, Whiting RC. Appl. Environ. Microbiol. 2006;72(2):1231–1238. doi: 10.1128/AEM.72.2.1231-1238.2006. [DOI] [PMC free article] [PubMed] [Google Scholar]
- Sharma SK, Whiting RC. J. Food Prot. 2005;68(6):1256–1263. doi: 10.4315/0362-028x-68.6.1256. [DOI] [PubMed] [Google Scholar]
- Shriver-Lake LC, Ogert RA, Ligler FS. Sens. Actuators. 1993;B11(1–3):239–243. [Google Scholar]
- Smith TJ, Lou J, Geren IN, Forsyth CM, Tsai R, LaPorte SL, Tepp WH, Bradshaw M, Johnson EA, Smith LA, Marks JD. Infect. Immun. 2005;73(9):5450–5457. doi: 10.1128/IAI.73.9.5450-5457.2005. [DOI] [PMC free article] [PubMed] [Google Scholar]
- Somers RC, Bawendi MG, Nocera DG. Chem. Soc. Rev. 2007;36:579–591. doi: 10.1039/b517613c. [DOI] [PubMed] [Google Scholar]
- Varnum SM, Warner MG, Dockendorff B, Anheier NC, Lou J, Marks JD, Smith LA, Feldhaus MJ, Grate JW, Bruckner-Lea CJ. Anal. Chim. Acta. 2006;570(2):137–143. doi: 10.1016/j.aca.2006.04.047. [DOI] [PubMed] [Google Scholar]
- Wictome M, Newton K, Jameson K, Hallis B, Dunnigan P, Mackay E, Clarke S, Taylor R, Gaze J, Foster K, Shone C. Appl. Environ. Microbiol. 1999a;65(9):3787–3792. doi: 10.1128/aem.65.9.3787-3792.1999. [DOI] [PMC free article] [PubMed] [Google Scholar]
- Wictome M, Newton KA, Jameson K, Dunnigan P, Clarke S, Gaze J, Tauk A, Foster KA, Shone CC. FEMS Immunol. Med. Microbiol. 1999b;24(3):319–323. doi: 10.1111/j.1574-695X.1999.tb01300.x. [DOI] [PubMed] [Google Scholar]
- Woodruff BA, Griffin PM, McCroskey LM, Smart JF, Wainwright RB, Bryant RG, Hutwagner LD, Hatheway DL. J. Infect. Dis. 1992;166(6):1281–1286. doi: 10.1093/infdis/166.6.1281. [DOI] [PubMed] [Google Scholar]
Associated Data
This section collects any data citations, data availability statements, or supplementary materials included in this article.


